

The DOI matches its Crossref record; 42 of the 42 references it cites were found in a registry or an index.
Computational Design of a TCR-Based Bispecific Engager Targeting Cancerous KRAS G12V Mutations
Open accessPublished version of a preprint
Abstract
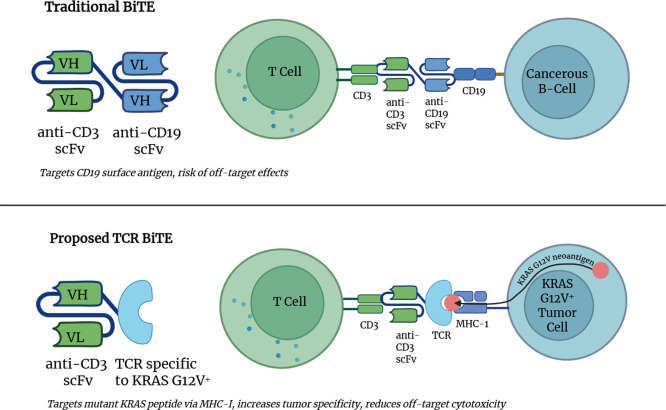
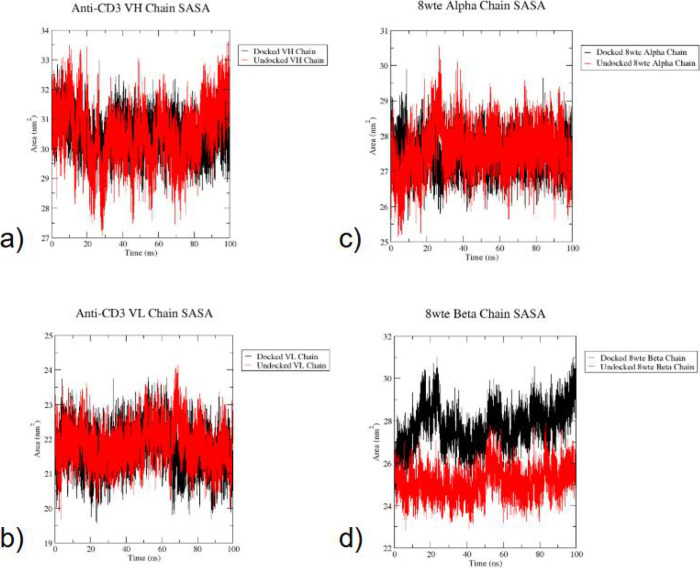
Bispecific T-cell engager (BiTE) therapy is a type of immunotherapy that redirects cytotoxic T cells to target tumor cells. Traditionally, a BiTE structure dual binds to the CD3 receptor on the T-cell surface and to the mutated antigen presented on the surface of the cancer cell as an extracellular protein. An example of this is blinatumomab, an FDA-approved BiTE structure for the treatment of B-cell acute lymphoblastic leukemia (B-ALL). However, traditional BiTE complexes are at risk of off-tumor effects due to their targeting of cell surface antigens, which are not specific to certain cancer variants. In this study, we utilized a computational approach, an area that remains underdeveloped in current immunotherapy design, to design the initial structures of two TCR-BiTEs that consist of a single-chain variable fragment (scFv) in conjunction with a T-cell receptor (TCR) that binds specifically to the KRAS G12V neoantigen, which currently does not have any FDA-approved targeted therapy treatments. Ultimately, we present two promising TCR-BiTEs that are specific to two different HLAs (HLA:03:01 and HLA:11:01) targeting KRAS G12V, serving as valuable starting points for further evaluation and design in vitro. We validated the design of our TCR-BiTE structures through AlphaFold tools, free energy estimation methods, and molecular dynamics analysis, thereby also providing a potential computational pipeline that can be applied in the design of TCR-BiTE structures targeting other mutations in addition to KRAS G12V.
Overview
The claims and statistics of this paper haven’t been checked yet.
Run the check — free, no account needed. It reads the open-access text and checks the sources it cites.
Integrity signals
Registry
Cites
Statistics
Figures
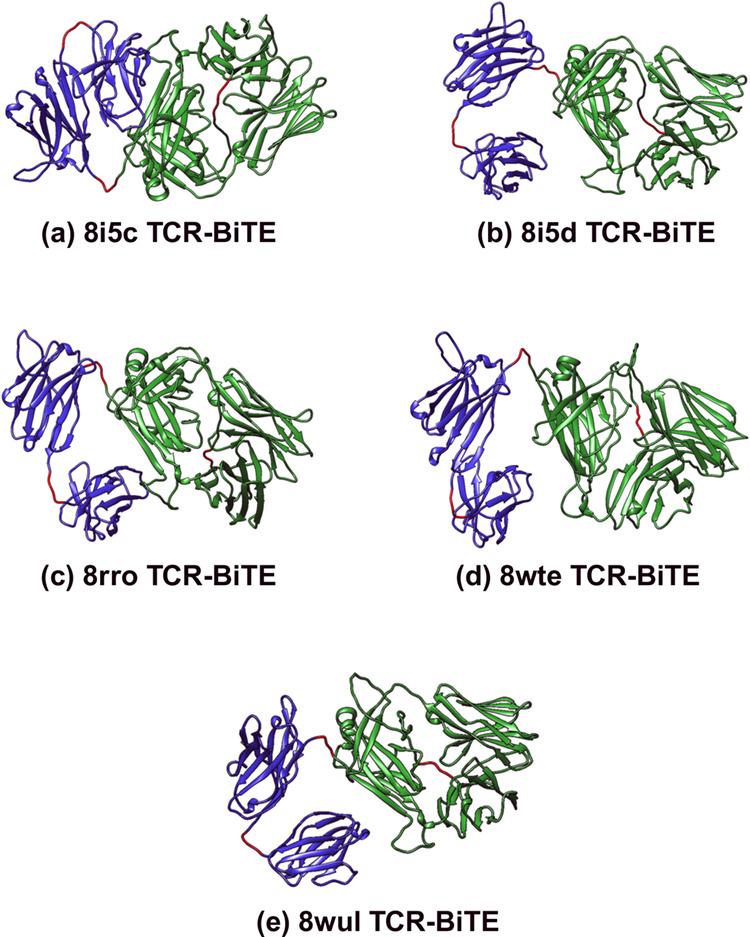
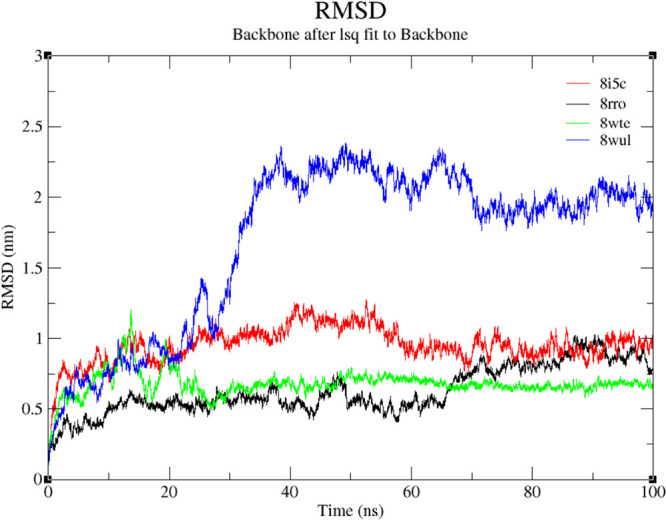
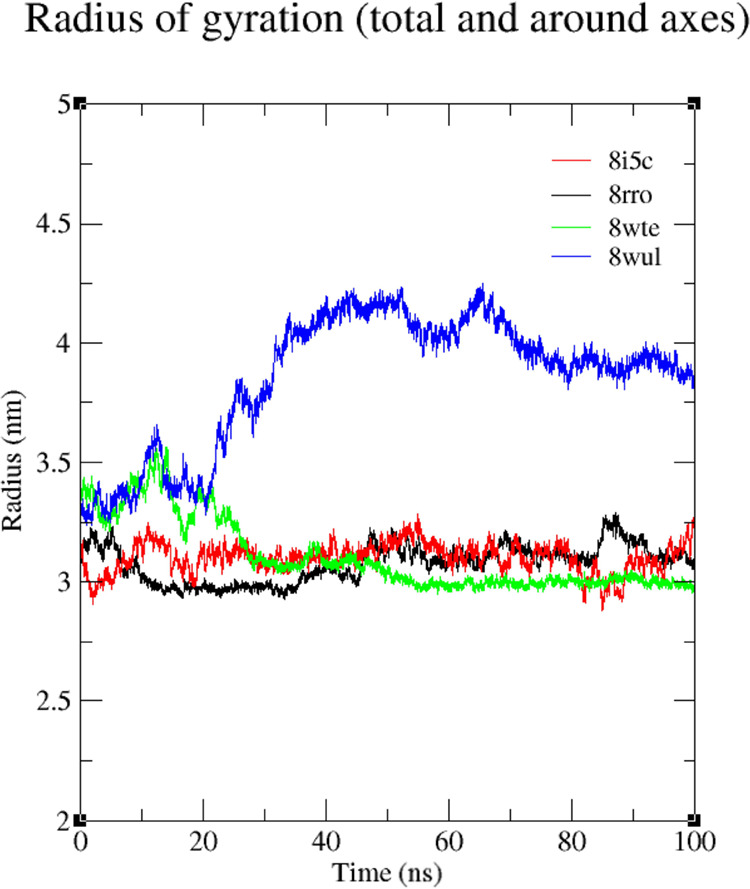
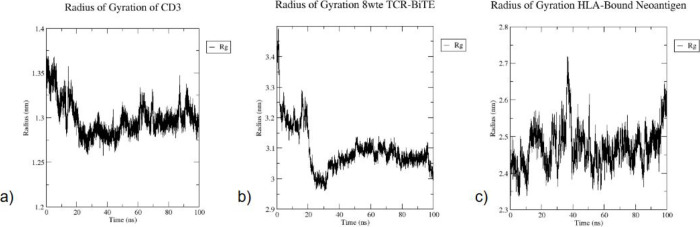
Verification
Claims the paper makes
The claims and statistics of this paper haven’t been checked yet.
Run the check — free, no account needed. It reads the open-access text and checks the sources it cites.
Self-check
Percentages, sums and reported differences re-computed from the paper’s own numbers.
The self-check needs the paper’s full text.
Citations
Cites
Highly accurate protein structure prediction with AlphaFold
Jumper, J., Evans, R., Pritzel, A., Green, T., Figurnov, M., Ronneberger, O., Tunyasuvunakool, K., Bates, R., Žídek, A., Potapenko, A., et al. (2021) · Nature · doi:10.1038/s41586-021-03819-2 · Cited by 43,764 · cited 2×
“15,16 The software was able to predict interdomain contracts that focused on the TCR variable regions and fusion components.”
Abraham, M. J., Murtola, T., Schulz, R., Páll, S., Smith, J. C., Hess, B., & Lindahl, E. (2015) · SoftwareX · doi:10.1016/j.softx.2015.06.001 · Cited by 27,190
Jorgensen, W. L., Maxwell, D. S., & Tirado-Rives, J. (1996) · Journal of the American Chemical Society · doi:10.1021/ja9621760 · Cited by 15,409
ColabFold - Making protein folding accessible to all
Mirdita, M., Schütze, K., Moriwaki, Y., Heo, L., Ovchinnikov, S., & Steinegger, M. (2021) · doi:10.1101/2021.08.15.456425 · Cited by 9,391
Reynisson, B., Alvarez, B., Paul, S., Peters, B., & Nielsen, M. (2020) · Nucleic Acids Research · doi:10.1093/nar/gkaa379 · Cited by 2,361
Statistical potential for assessment and prediction of protein structures
Shen, M., & Šali, A. (2006) · Protein Science · doi:10.1110/ps.062416606 · Cited by 2,349
Rapin, N., Lund, O., Bernaschi, M., & Castiglione, F. (2010) · PLoS ONE · doi:10.1371/journal.pone.0009862 · Cited by 1,169
KRAS Mutation: From Undruggable to Druggable in Cancer
Huang, L., Guo, Z., Wang, F., & Fu, L. (2021) · Signal Transduction and Targeted Therapy · doi:10.1038/s41392-021-00780-4 · Cited by 1,127
Regulation of protein-ligand binding affinity by hydrogen bond pairing
Chen, D., Oezguen, N., Urvil, P., Ferguson, C. G., Dann, S. M., & Savidge, T. (2016) · Science Advances · doi:10.1126/sciadv.1501240 · Cited by 976
Uniclust databases of clustered and deeply annotated protein sequences and alignments
Mirdita, M., von den Driesch, L., Galiez, C., Martin, M. J., Söding, J., & Steinegger, M. (2017) · Nucleic Acids Research · doi:10.1093/nar/gkw1081 · Cited by 759
Research works printed but not linked: 6
- Baeuerle P. A., 2009, Curr. Opin. Mol. Ther., 11, 22
- 10.1038/s41592-022-01488-1 · DOI · Paper page
- 10.3389/fimmu.2019.02064 · DOI
- 10.1093/bioinformatics/btv552 · DOI
- Zhou J., 2017, Cell. Mol. Immunol., 14, 826
- Paggi J. M., 2023, Nucleic Acids Res., 53, W306
Metadata
- Authors
- Shah, N., Sharma, G., Patel, V., Wu, M., Mummadi, A., Taneja, A., Shah, M., Le, G. B., Krishna, M., & Brah, H.
- Affiliations
- Aspiring Scholars Directed Research Program (US)
- Corresponding author
- Brah, Harman
- Venue
- ACS Omega
- Publisher
- American Chemical Society (ACS)
- Published
- 2026-03-09
- Volume
- 11
- Issue
- 11
- Pages
- 17366-17380
- ISSN
- 2470-1343 (ISSN-L)
- PMC
- PMC13019212
- OpenAlex
- W7134948581
- Cited by
- 0
- References
- 42
- FWCI
- 0.00
- Type
- journal article
- Language
- en
- Open access
- gold
- doi.org
- Licence
- Locations
- ACS Omega (publishedVersion, cc-by-nc-nd)
- ChemRxiv (acceptedVersion, cc-by)
- PubMed (publishedVersion)
- PubMed Central (publishedVersion, cc-by-nc-nd)
- Topics
- Life Sciences › Immunology and Microbiology › Immunology › Monoclonal and Polyclonal Antibodies Research
- Life Sciences › Biochemistry, Genetics and Molecular Biology › Molecular Biology › vaccines and immunoinformatics approaches
- Life Sciences › Biochemistry, Genetics and Molecular Biology › Molecular Biology › Protein Degradation and Inhibitors
- Keywords
- bispecific T-cell engagers, KRAS G12V mutation, neoantigens, T cell receptor engineering, scFv, HLA class I binding, cancer immunotherapy, computational protein design, on-target off-tumor toxicity, AlphaFold, free energy calculation, molecular dynamics
About these checks
Registry, retraction, Cites and statistics results are computed, not judged, with one exception: a printed reference that no index lists is read once by a model before it counts as a citation error. Claims are extracted by a model and kept only when their quote appears verbatim in the text; each cited source is then checked, with a model’s help, for whether it says what the claim relies on. Those verdicts can be wrong — read the claim’s quote and the cited source before relying on one.
Statistics and arithmetic are recomputed, not judged.
Confidence bands are shown only for fields calibrated on our annotated test set. None is calibrated yet, so no band is shown.
What counts as a claim ›How we measure confidence ›How we check this ›
Are you an author, or do you see a problem with this page? Request a review
How to cite
Cite CoChat for the checks on this page, and the paper for its own findings.
- This page
- CoChat. (2026). Citation check: Computational Design of a TCR-Based Bispecific Engager Targeting Cancerous KRAS G12V Mutations. https://app.cochat.ai/papers/10.1021/acsomega.5c10229
- The paper
- Shah, N., Sharma, G., Patel, V., Wu, M., Mummadi, A., Taneja, A., Shah, M., Le, G. B., Krishna, M., & Brah, H. (2026). Computational Design of a TCR-Based Bispecific Engager Targeting Cancerous KRAS G12V Mutations. ACS Omega. https://doi.org/10.1021/acsomega.5c10229
Data sources
Bibliographic data: Semantic Scholar, OpenAlex, Crossref.
Contains information from the Semantic Scholar Academic Graph Datasets, made available under the ODC Attribution License (ODC-BY 1.0).
Semantic Scholar’s data is described in: Kinney, R., et al. (2023). The Semantic Scholar Open Data Platform. arXiv:2301.10140.
