

The DOI matches its Crossref record; 94 of the 94 references it cites were found in a registry or an index; none of the 47 sources its claims cite is checked for support yet.
Enhancing River Channel Dimension Estimation: A Machine Learning Approach Leveraging the National Water Model, Hydrographic Networks, and Landscape Characteristics
Open accessAbstract
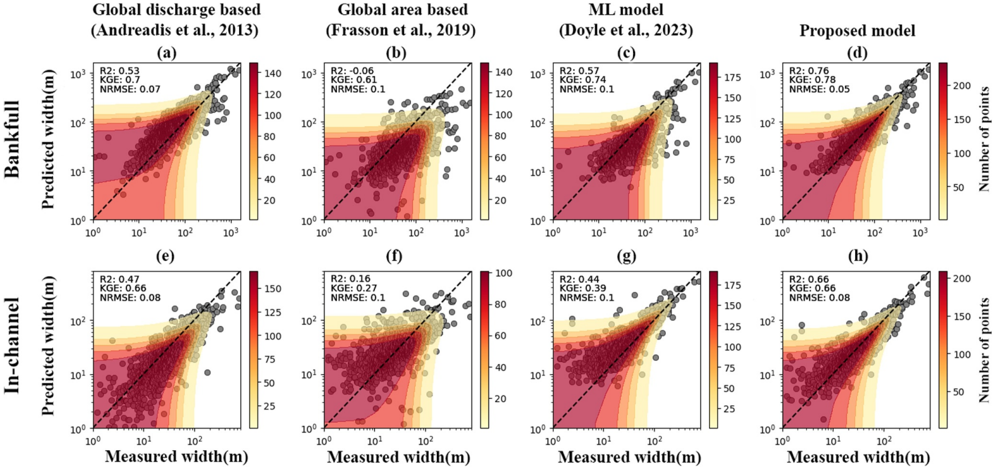
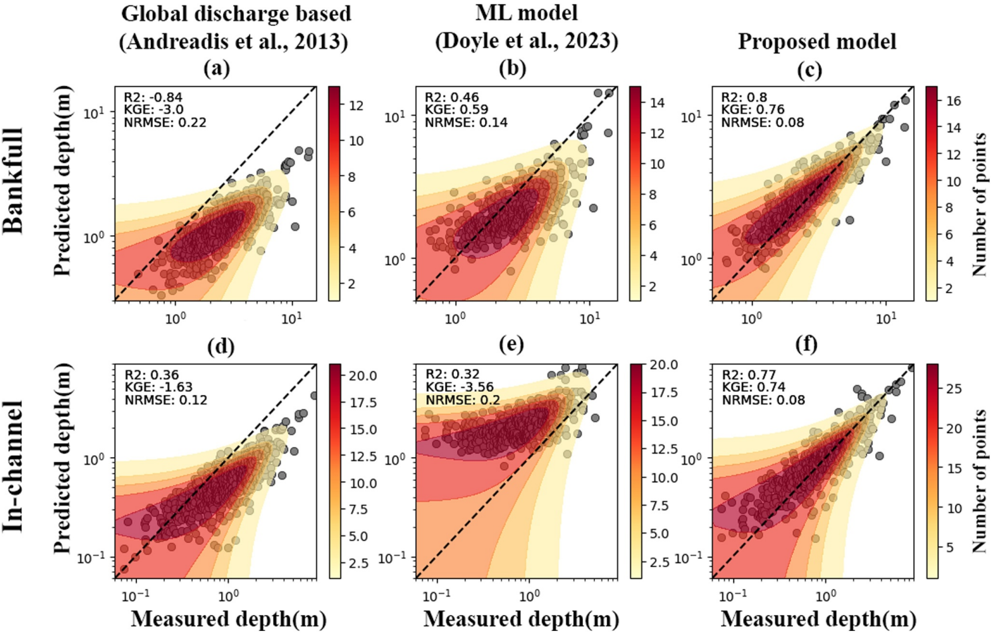
Knowledge of bankfull hydraulic geometry represents an essential requirement for various applications, including accurate flood prediction, hydrological routing, river behavior analysis, river management and engineering practices, water resource management, and beyond. Our work builds upon an extensive body of literature about estimating bankfull top‐width and depth at ungauged locations to enhance the understanding of observable factors that affect these parameters. Using more than 200,000 USGS Acoustic Doppler Current Profiler (ADCP) records, we developed a method employing machine learning (ML) using discharge estimates and landscape characteristics from sources, including the National Water Model (NWM), the National Hydrologic Geospatial Fabric network (NHGF), the EPA stream characteristic data set (StreamCat), and an array of satellite and reanalysis data products. Our method achieved log‐transformed R2 = 0.8 predicting bankfull depth (R2 = 0.77 for in‐channel conditions) and R2 = 0.76 predicting bankfull top‐width (R2 = 0.66 for in‐channel conditions) in the testing data set. The depth and width predictions showed lowest skill in mountainous and plateau regions. Our analysis demonstrates the benefit of data‐driven modeling in contrast to other global scaling‐based or regional statistical methods. In summary, our study illustrates how top‐width and depth can be better predicted using ML, reanalysis streamflow simulations, hydrographic networks, and summarized geospatial data.
Overview
CoChat Summary
TL;DR
The paper develops machine-learning models to estimate bankfull and in-channel river top-width and depth across CONUS using >200,000 USGS ADCP records and predictors from the National Water Model, hydrographic networks, and landscape characteristics. The meta-learner ensemble achieved log-transformed R² = 0.80 for bankfull depth and 0.76 for bankfull top-width, outperforming global/regional equations and a prior ML approach.
Key findings
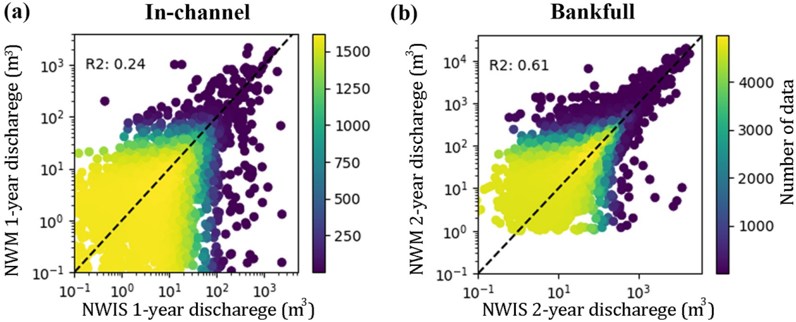
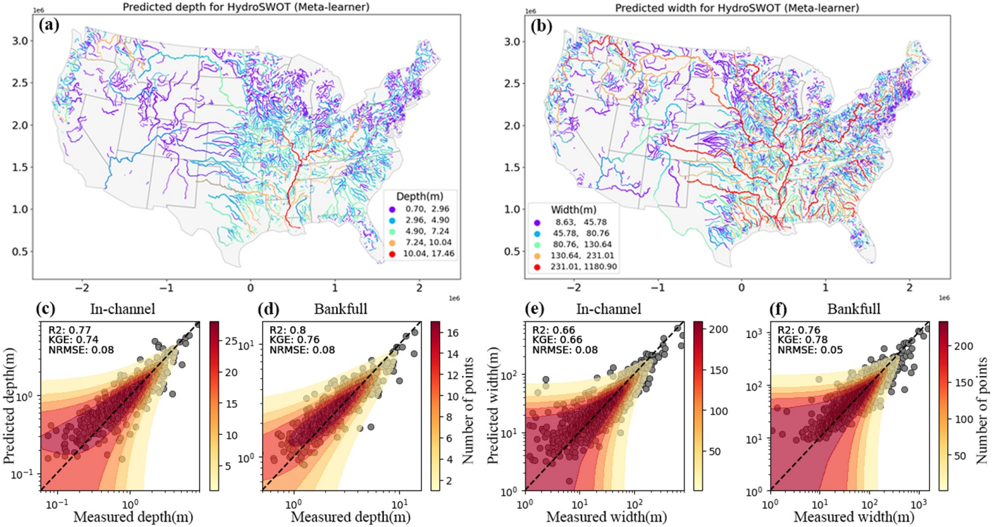
- Using >200,000 ADCP records from 10,081 USGS gauging locations, after filtering 4,229 of 6,226 initial sites were retained; testing-data log-transformed R² was 0.80 for bankfull depth (0.77 in-channel) and 0.76 for bankfull top-width (0.66 in-channel).
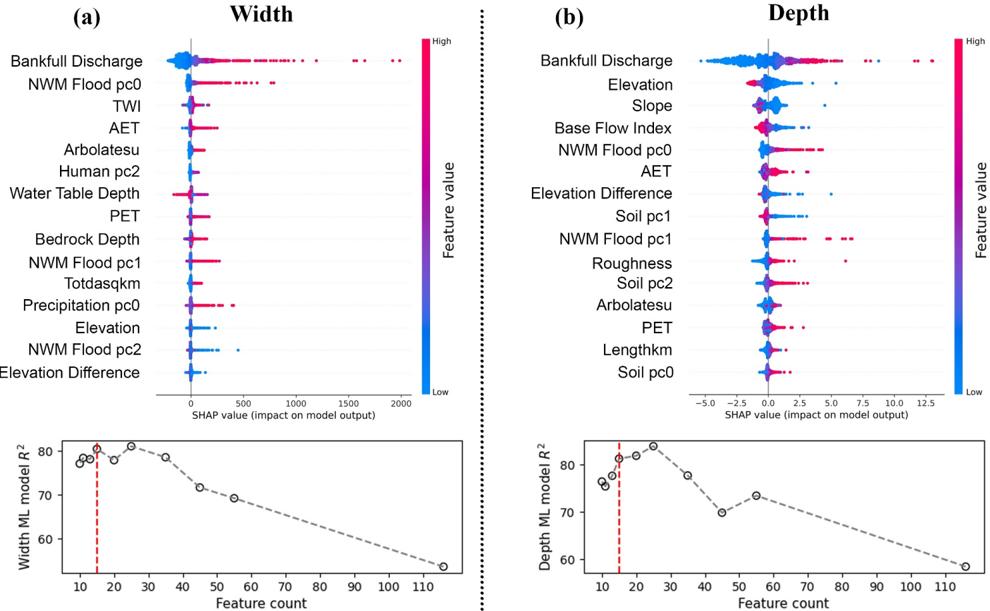
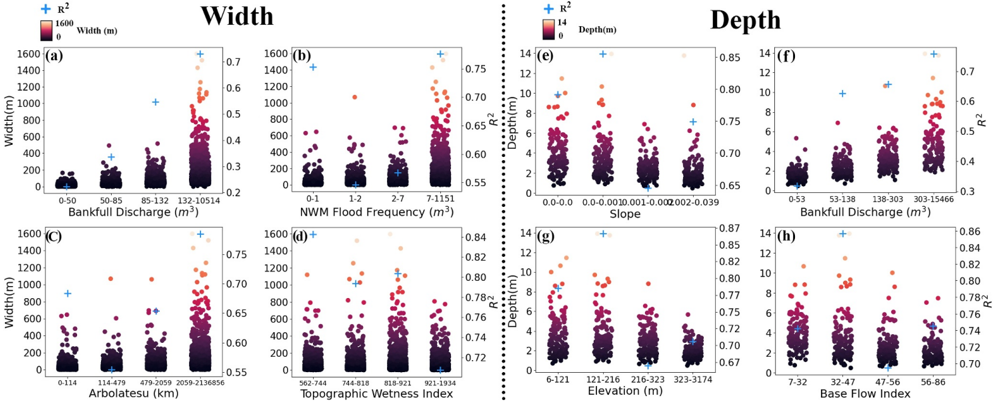
- The most influential predictor was bankfull/in-channel discharge, especially NWM-derived flood-frequency principal components; width was also influenced by cumulative upstream flowline length (Arbolatesu), topographic wetness index, and actual evapotranspiration, while depth was influenced by mean catchment elevation, channel slope, and base flow index.
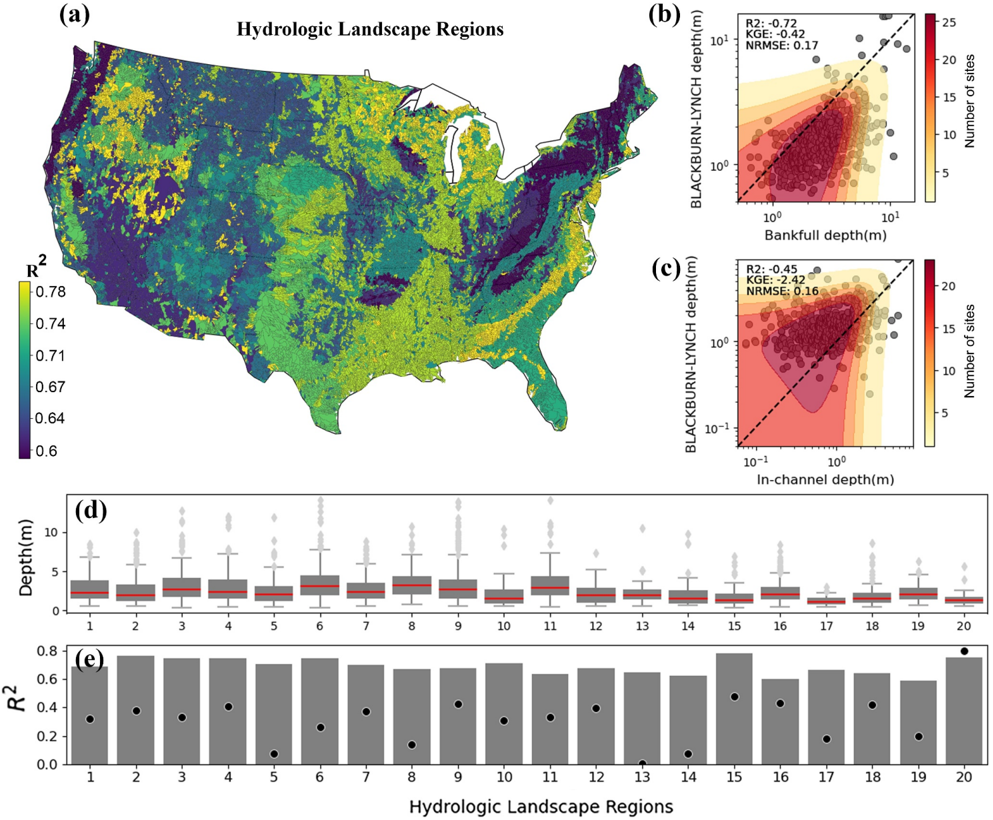
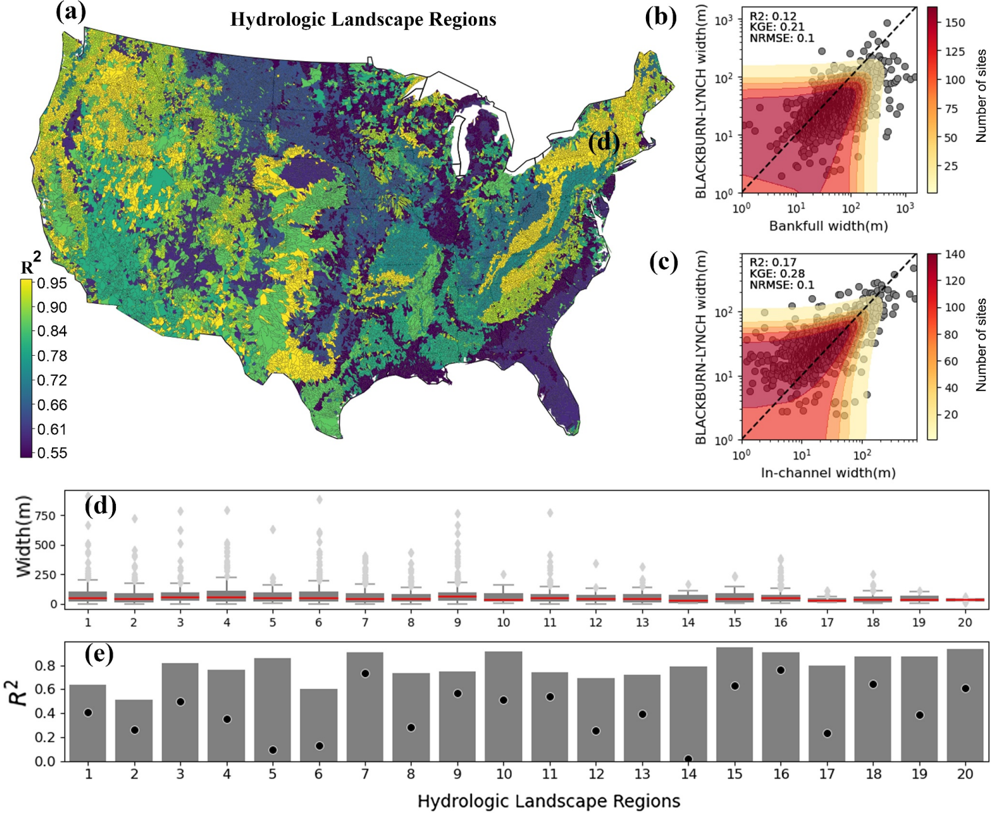
- Model skill varied by hydrologic landscape region: depth models performed better in plains and permeable-bedrock regions, while top-width models had lowest GOF in HLR 2 (very humid plains, R² ≈ 0.53) and highest in mountainous/plateau regions; the abstract reports lowest skill in mountainous and plateau regions.
- The ML models outperformed global drainage-area and discharge-based equations and the Doyle et al. (2023) ML method, with reduced scatter for mid-size and larger rivers but overprediction in smaller rivers.
Methods
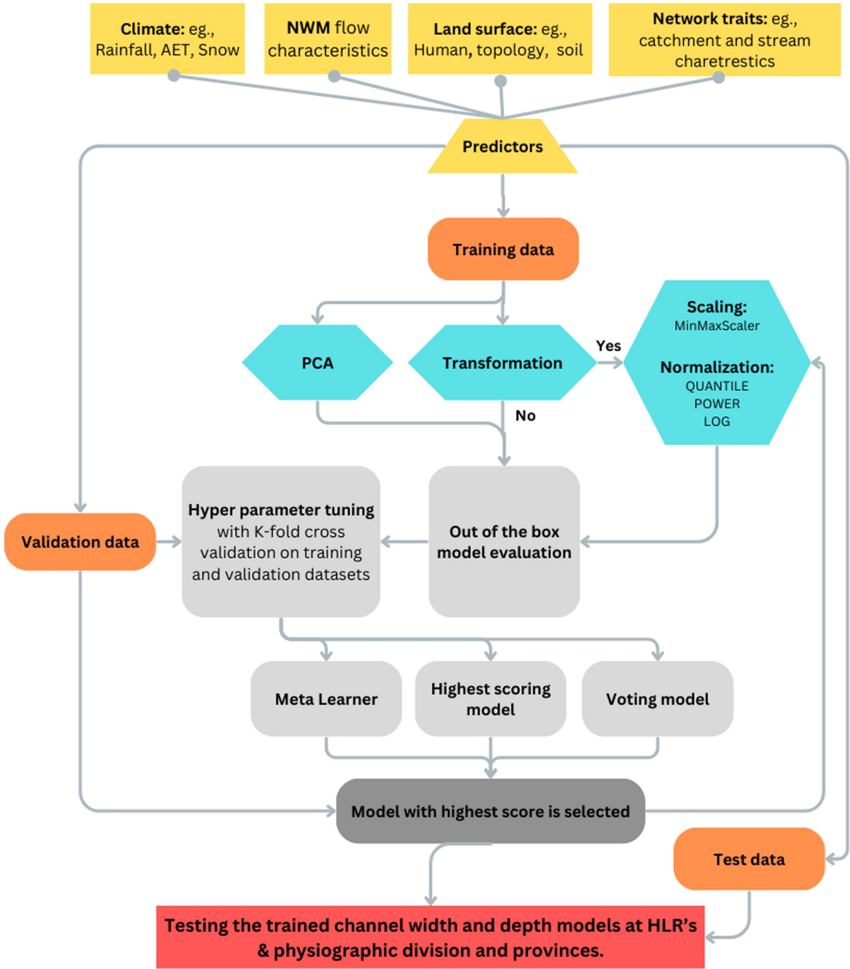
- Data: HYDRoSWOT ADCP observations (200,000+ measurements at 10,081 USGS gauges); profiles filtered to 2000–2015, depth <65 m, top-width <4 km, discharge agreement with NWIS, and no negative values; sites with inverse discharge–depth relationships or <5 profiles removed; AHG fits retained 4,229 of 6,226 sites with R² > 0.6. Bankfull was defined as 50% annual exceedance probability discharge and in-channel as 100%, computed via flood-frequency distributions (GEV, GP, LP3, generalized gamma; KS selection) and AHG relations.
- Predictors: 116 initial variables from NWM v2.1 retrospective streamflow statistics (20%–0.1% annual exceedance probability and flow percentiles), NHGF hydrographic network, EPA StreamCat (58 watershed predictors), and climateR-aggregated soil/landscape/weather data (31 predictors); reduced to 15 features using SHAP and PCA/correlation clustering.
- Modeling: trained 40 ML models (neural network, tree-based, SVM), selected top 10 by R²/RMSE, fine-tuned with five-fold cross-validation and three repeats, then built meta-learner and voting ensembles; used 70% training, 10% validation, 20% testing; applied to approximately 2.7 million NHGF reaches across CONUS.
Limitations
- Paper states: training data are constrained to USGS sites, often with high banks, and may not represent entire reach geometry; no ADCP measurements in estuaries near river mouths make estimates unreliable there; estimates are unreliable near anthropogenically altered systems (dams, levees, irrigation canals, ponds); NWM’s diminished skill for 100% annual exceedance probability discharge impacts model GOF; reach-scale resolution overlooks braiding, incision, and aggradation; global scalability is constrained by reliance on NWM retrospective data and source-data biases/inconsistencies.
- Text makes evident: models underpredict top-width and depth for smaller rivers, and there is a shortage of large-river data in HYDRoSWOT; performance declines with lower discharge; top-width model GOF is lowest in HLR 2 plains, while depth model GOF is lower in mountainous/impermeable-bedrock regions.
Model-written summary. Check it against the paper before relying on it.
Integrity signals
Registry
Cites
Statistics
Figures









Verification
Claims the paper makes
0 Valid · 1 Not valid · 30 Not checked · 79 Own results and interpretations
A result the paper reports from its own data — it cites no other source for it, so there is none to check. The quote shows it is in the paper.
In the paper
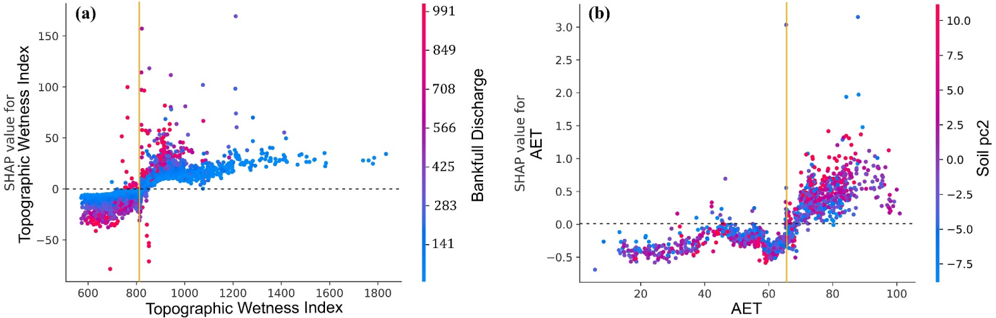
“In Figure 6a we saw a nonlinear relationship between bankfull discharge/TWI and channel dimensionality.”
§ Enhancing River Channel Dimension Estimation: A Machine Learning Approach Leveraging the National Water Model, Hydrographic Networks, and Landscape Characteristics > 4.1. Significance of Discharge in Channel Geometry Modeling
plainstates an association- Asserted: passes — The authors put it forward as true.
- Checkable: passes — It can be checked against evidence.
- Load-bearing: passes — The paper’s conclusions depend on it.
- Based: passes — The paper gives a reason why it holds.
- Rests on an assumption not shown here.
None of the sources cited for this claim have been checked yet.
In the paper
“It consistently (in width and depth under both flow conditions) demonstrates a strong positive correlation between higher magnitudes of the flood (Bankfull discharge and NWM Flood PCs), and broader, deeper channels, aligning with the established literature (Bjerklie et al., 2005;Brown & Pasternack, 2014;Wohl & Wilcox, 2005).”
§ Enhancing River Channel Dimension Estimation: A Machine Learning Approach Leveraging the National Water Model, Hydrographic Networks, and Landscape Characteristics > 4.1. Significance of Discharge in Channel Geometry Modeling
What the sources say
boostedstates an association- Asserted: passes — The authors put it forward as true.
- Checkable: passes — It can be checked against evidence.
- Load-bearing: passes — The paper’s conclusions depend on it.
- Based: passes — The paper gives a reason why it holds.
- Rests on an assumption not shown here.
None of the sources cited for this claim have been checked yet.
In the paper
“The analysis reveals a pattern where channel depth models show higher GOF (R 2 ) in the prediction of bankfull depth predominantly in plains (HLR 1-8; Table S3 in Supporting Information S1) and regions with permeable bedrock (Carlier et al., 2018;Santhi et al., 2008).”
§ Enhancing River Channel Dimension Estimation: A Machine Learning Approach Leveraging the National Water Model, Hydrographic Networks, and Landscape Characteristics > 3.5. Performance in Hydrologic Landscape Regions
What the sources say
plainstates an association- Asserted: passes — The authors put it forward as true.
- Checkable: passes — It can be checked against evidence.
- Load-bearing: unclear — It is unclear whether the paper’s conclusions depend on it.
- Based: passes — The paper gives a reason why it holds.
- Rests on an assumption not shown here.
A result the paper states — it cites no source for it, so there is none to check. The quote shows it is in the paper.
In the paper
“Validation of the models across different regions indicated better performance in flatter regions and lower performance in steeper areas.”
§ Enhancing River Channel Dimension Estimation: A Machine Learning Approach Leveraging the National Water Model, Hydrographic Networks, and Landscape Characteristics > Abstract
hedgedstates an association- Asserted: passes — The authors put it forward as true.
- Checkable: passes — It can be checked against evidence.
- Load-bearing: unclear — It is unclear whether the paper’s conclusions depend on it.
- Based: passes — The paper gives a reason why it holds.
A result the paper reports from its own data — it cites no other source for it, so there is none to check. The quote shows it is in the paper.
In the paper
“All three variables exhibit a positive relationship with channel top-width, as indicated by SHAP importance values.”
§ Enhancing River Channel Dimension Estimation: A Machine Learning Approach Leveraging the National Water Model, Hydrographic Networks, and Landscape Characteristics > 3.2. Impactful Predictors
hedgedstates an association- Asserted: passes — The authors put it forward as true.
- Checkable: passes — It can be checked against evidence.
- Load-bearing: passes — The paper’s conclusions depend on it.
- Based: passes — The paper gives a reason why it holds.
- Rests on an assumption not shown here.
57 more claims
Create a free account to see all 110 claims and to verify the 35 references still open.
- Probably not a substantial claim. 22
- It may state two separate claims as one. 33
- The quote only partly states this claim. 3
Self-check
Percentages, sums and reported differences re-computed from the paper’s own numbers.
Each contradiction between two passages listed here was confirmed by an independent check.
Rated major: it would touch a result — a value a result rests on, reported and recomputed p-values on opposite sides of the significance level, two passages that conflict with no sign which is right, or a cited work retracted before this paper was published.
In the paper
§ Enhancing River Channel Dimension Estimation: A Machine Learning Approach Leveraging the National Water Model, Hydrographic Networks, and Landscape Characteristics > 3.1. In-Channel and Bankfull Model Performance
“In general, the models underpredict both top-width and depth as channel top-width and depth decrease (smaller rivers; scatter dots located on the right side of the 1:1 line in Figures 3 c-3f).”
§ Enhancing River Channel Dimension Estimation: A Machine Learning Approach Leveraging the National Water Model, Hydrographic Networks, and Landscape Characteristics > 3.6. Comparative Model Assessment
“Conversely, the ML methods tend to overpredict channel width in smaller rivers, as evidenced by the skewed tail in the plots.”
Rated major: it would touch a result — a value a result rests on, reported and recomputed p-values on opposite sides of the significance level, two passages that conflict with no sign which is right, or a cited work retracted before this paper was published.
In the paper
§ Enhancing River Channel Dimension Estimation: A Machine Learning Approach Leveraging the National Water Model, Hydrographic Networks, and Landscape Characteristics > Abstract
“The depth and width predictions showed lowest skill in mountainous and plateau regions.”
§ Enhancing River Channel Dimension Estimation: A Machine Learning Approach Leveraging the National Water Model, Hydrographic Networks, and Landscape Characteristics > 3.5. Performance in Hydrologic Landscape Regions
“The highest GOF based on R 2 are seen in all mountainous regions (HLR 15-20) and plateau regions (i.e., HLR 9-13; Vidon & Hill, 2004).”
Rated minor: it would not touch a result — a value no result rests on, a p-value that stays on the same side of the significance level, or a conflict that is clerical, resolved elsewhere in the paper, or outside its own findings.
In the paper
§ Enhancing River Channel Dimension Estimation: A Machine Learning Approach Leveraging the National Water Model, Hydrographic Networks, and Landscape Characteristics > 3.4. Hydrological Thresholds
“The soil PC2, which is a representative of clay and silt components (see Figure S3 in Supporting Information S1), is evenly scattered and shows no pattern.”
§ Enhancing River Channel Dimension Estimation: A Machine Learning Approach Leveraging the National Water Model, Hydrographic Networks, and Landscape Characteristics > 5. Conclusions
“Soil PC0 represents soil moisture, Soil PC1 represents % of clay and silt, and Soil PC2 represents % of sand.”
Rated minor: it would not touch a result — a value no result rests on, a p-value that stays on the same side of the significance level, or a conflict that is clerical, resolved elsewhere in the paper, or outside its own findings.
In the paper
§ Enhancing River Channel Dimension Estimation: A Machine Learning Approach Leveraging the National Water Model, Hydrographic Networks, and Landscape Characteristics > 4.3. Utility and Limitations
“This process helped reduce the number of model predictors from 116 to 15.”
§ Enhancing River Channel Dimension Estimation: A Machine Learning Approach Leveraging the National Water Model, Hydrographic Networks, and Landscape Characteristics > 4.3. Utility and Limitations
“Moreover, although our modeling strategy effectively reduced 112 variables into 15 components, the reliance on source data restricts the scalability of this approach to different geographical locations.”
Citations
Cites
Advances in Neural Information Processing Systems 29
Teymur, O., Zygalakis, K., & Calderhead, B. (2016) · Cited by 13,887
The Global Land Data Assimilation System
Rodell, M., Houser, P. R., Jambor, U., Gottschalck, J., Mitchell, K., Meng, C.-J., Arsenault, K., Cosgrove, B., Radakovich, J., Bosilovich, M., et al. (2004) · Bulletin of the American Meteorological Society · doi:10.1175/bams-85-3-381 · Cited by 5,614
High-resolution mapping of global surface water and its long-term changes
Pekel, J.-F., Cottam, A., Gorelick, N., & Belward, A. S. (2016) · Nature · doi:10.1038/nature20584 · Cited by 5,513
Abatzoglou, J. T., Dobrowski, S. Z., Parks, S. A., & Hegewisch, K. C. (2018) · Scientific Data · doi:10.1038/sdata.2017.191 · Cited by 3,421
The hydraulic geometry of stream channels and some physiographic implications
Leopold, L. B., & Maddock, T. (1953) · Professional Paper · doi:10.3133/pp252 · Cited by 2,966
Learning from imbalanced data: open challenges and future directions
Krawczyk, B. (2016) · Progress in Artificial Intelligence · doi:10.1007/s13748-016-0094-0 · Cited by 2,459
River channel patterns: Braided, meandering, and straight
Leopold, L. B., & Wolman, M. G. (1957) · USGS professional paper · doi:10.3133/pp282b · Cited by 2,294
Water in Environmental Planning
Clark, J., Dunne, T., & Leopold, L. B. (1980) · The Journal of Wildlife Management · doi:10.2307/3808399 · Cited by 2,251
Lehner, B., & Grill, G. (2013) · Hydrological Processes · doi:10.1002/hyp.9740 · Cited by 2,193
A classification of natural rivers
Rosgen, D. L. (1994) · CATENA · doi:10.1016/0341-8162(94)90001-9 · Cited by 1,713
Research works printed but not linked: 3
- Bock A. R., 2022, Provisional: National hydrologic geospatial fabric reference and derived hydrofabrics, 2022120390
- Haan C. T. Johnson H. P. &Brakensiek D. L.(1982).Hydrologic modeling of small watersheds.https://doi.org/10.5555/19851999449 · doi:10.5555/19851999449
- Köppen M., 2000, 5th Online World Conference on Soft Computing in Industrial Applications (WSC5), 4
Cited by
Ogden, F. L., Jennings, K. S., Clark, E. P., Coon, E. T., Cosgrove, B. A., da Cunha, L. K., Farthing, M. W., Flowers, T., Frame, J., Frazier, N., et al. (2026) · JAWRA Journal of the American Water Resources Association · doi:10.1111/1752-1688.70089 · Cited by 12
Self-citationPatel, A., Halgren, J., Wills, Z., Frazier, N., Lee, B., Cunningham, J., Laser, J., Karimiziarani, M., Patel, T., Romero, G., et al. (2025) · Environmental Modelling & Software · doi:10.1016/j.envsoft.2025.106666 · Cited by 10
Self-citationBaruah, A., Zarrabi, R., Cohen, S., Johnson, J. M., & McDermott, R. (2025) · Scientific Reports · doi:10.1038/s41598-025-27881-2 · Cited by 8
Self-citationChen, Y., Cohen, S., Baruah, A., Devi, D., Dhital, S., Tian, D., & Munasinghe, D. (2025) · Scientific Data · doi:10.1038/s41597-025-05941-6 · Cited by 8
High‐Resolution Channel Geometry Reveals Contrasting Styles of Gravel River Adjustment
Kostynick, R. P., Phillips, C. B., & Masteller, C. C. (2026) · Geophysical Research Letters · doi:10.1029/2025gl118412 · Cited by 4
Metadata
- Authors
- Modaresi Rad, A., Johnson, J. M., Ghahremani, Z., Coll, J., & Frazier, N.
- Affiliations
- Lynker Fort Collins CO USA
- National Oceanic and Atmospheric Administration (US)
- Corresponding author
- Johnson, J. Michael
- Venue
- Journal of Geophysical Research: Machine Learning and Computation
- Publisher
- American Geophysical Union (AGU)
- Published
- 2024-11-25
- Volume
- 1
- Issue
- 4
- ISSN
- 2993-5210 (ISSN-L)
- OpenAlex
- W4404699222
- Semantic Scholar
- dd01d84abfc695cff27825fef089e22e219238e9
- Cited by
- 11
- References
- 94
- Citations by year
- 2026: 7 · 2025: 4
- FWCI
- 2.26
- Type
- journal article
- Language
- en
- Open access
- gold
- doi.org
- Licence
- Locations
- Journal of Geophysical Research Machine Learning and Computation (publishedVersion, cc-by)
- NOAA Institutional Repository (submittedVersion, cc-by)
- DOAJ (DOAJ: Directory of Open Access Journals) (submittedVersion, cc-by-sa)
- Funders
- National Oceanic and Atmospheric Administration
- Topics
- Physical Sciences › Earth and Planetary Sciences › Earth-Surface Processes › Hydrology and Sediment Transport Processes
- Physical Sciences › Environmental Science › Water Science and Technology › Hydrology and Watershed Management Studies
- Physical Sciences › Environmental Science › Environmental Engineering › Hydrological Forecasting Using AI
- Keywords
- bankfull depth, ungauged rivers, National Water Model, river networks, landscape elements, acoustic Doppler current profiler, discharge estimation, flood forecasting
About these checks
Registry, retraction, Cites and statistics results are computed, not judged, with one exception: a printed reference that no index lists is read once by a model before it counts as a citation error. Claims are extracted by a model and kept only when their quote appears verbatim in the text; each cited source is then checked, with a model’s help, for whether it says what the claim relies on. Those verdicts can be wrong — read the claim’s quote and the cited source before relying on one.
A language model drew the claims from the paper on 2026-11-18, under version 3 of the claim definition (model deepseek-v4.1-flash, prompt extract-v3).
A second model labelled each claim on 2026-11-18 (model jev-1.13-20260917, definition revision gold-guideline-v0.2).
Statistics and arithmetic are recomputed, not judged.
Confidence bands are shown only for fields calibrated on our annotated test set. None is calibrated yet, so no band is shown.
What counts as a claim ›How we measure confidence ›How we check this ›
Are you an author, or do you see a problem with this page? Request a review
How to cite
Cite CoChat for the checks on this page, and the paper for its own findings.
- This page
- CoChat. (2026). Citation check: Enhancing River Channel Dimension Estimation: A Machine Learning Approach Leveraging the National Water Model, Hydrographic Networks, and Landscape Characteristics. https://app.cochat.ai/papers/10.1029/2024jh000173
- The paper
- Modaresi Rad, A., Johnson, J. M., Ghahremani, Z., Coll, J., & Frazier, N. (2024). Enhancing River Channel Dimension Estimation: A Machine Learning Approach Leveraging the National Water Model, Hydrographic Networks, and Landscape Characteristics. Journal of Geophysical Research: Machine Learning and Computation. https://doi.org/10.1029/2024jh000173
Data sources
Bibliographic data: Semantic Scholar, OpenAlex, Crossref.
Contains information from the Semantic Scholar Academic Graph Datasets, made available under the ODC Attribution License (ODC-BY 1.0).
Semantic Scholar’s data is described in: Kinney, R., et al. (2023). The Semantic Scholar Open Data Platform. arXiv:2301.10140.
