Cited by 66

The DOI matches its Crossref record; 2 of the 2 references it cites were found in a registry or an index.

Proteasome inhibition and oxidative reactions disrupt cellular homeostasis during heme stress

Vallelian, F, Deuel, J W, Opitz, L, Schaer, C A, Puglia, M, Lönn, M, Engelsberger, W, Schauer, S, Karnaukhova, E, Spahn, D R, Stocker, R, Buehler, P W, Schaer, D J·2015·Cell Death & Differentiation

Overview

The claims and statistics of this paper haven’t been checked yet.

Run the check — free, no account needed. It reads the open-access text and checks the sources it cites.

A few free checks a day · papers already verified open instantly · results are public

Integrity signals

Registry

Crossref · 10.1038/cdd.2014.154

Cites

2 of 2 references verified0 citation errors · 0 not checkable

Statistics

Figures

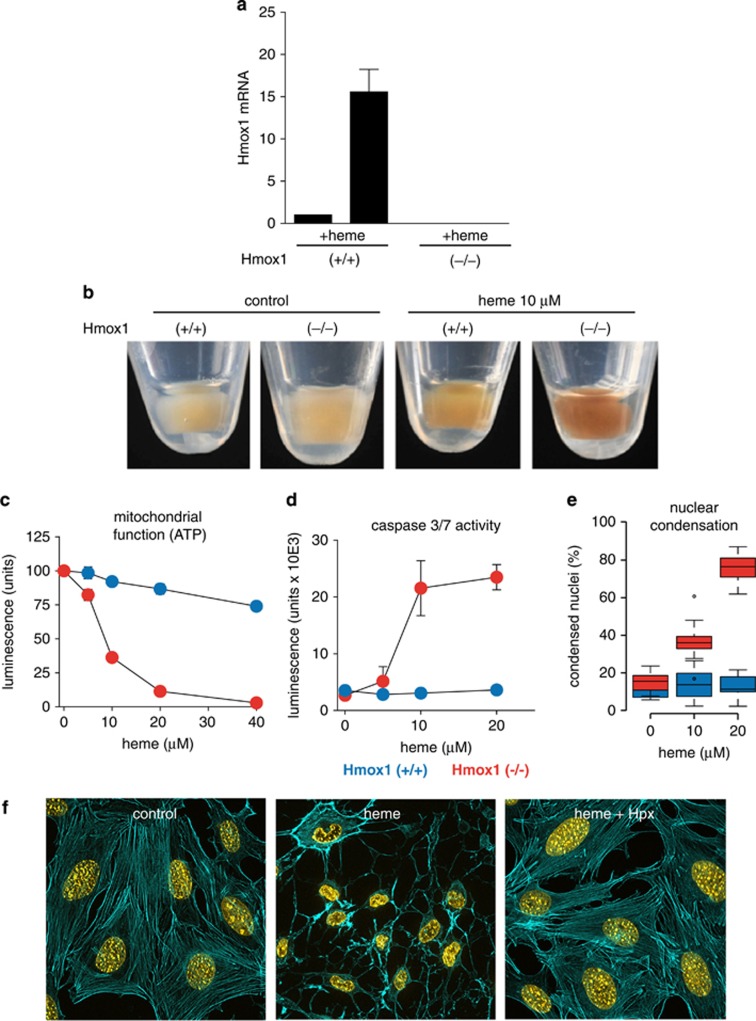
Figure 1 Cell culture model of heme toxicity. (a) Hmox1 (+/+) and Hmox1 (−/−) cells were incubated with 10 μM heme for 4 h. The relative Hmox1 mRNA induction in response to heme exposure was quantified by TaqMan RT-PCR. The mRNA levels are indicated as fold expression over control. No transcript was detected in the Hmox1 (−/−) cell line. (b) Cell pellets of Hmox1 (+/+) and Hmox1 (−/−) cells after 24 h of heme exposure (10 μM). Before imaging, cells were washed three times in large volumes of PBS containing EDTA. (c and d) Hmox1 (+/+) MEFs (blue) and Hmox1 (−/−) MEFs (red) were treated with the indicated concentrations of heme for 12 h. Intracellular ATP (c) and caspase 3/7 activity (d) were measured by luminescence assays. Data represent the mean±S.D. of six biologic replicates. (e) Hmox1 (+/+) MEFs (blue) and Hmox1 (−/−) MEFs (red) were treated with the indicated concentrations of heme for 14 h. Condensed nuclei were quantified by digital image analysis after Hoechst staining. Data include images (15 per replicate) from three independent biologic replicates. (f) Hmox 1 (−/−) MEFs were incubated with or without 20 μM heme for 12 h and stained with Hoechst (nuclei=yellow) and Alexa 488 phalloidin (actin cytoskeleton=cyan). The heme toxicity, which was characterized by cytoskeleton rarefication and nuclear condensation, was totally prevented by hemopexin (Hpx; 0.5 mg/ml). Images were acquired with a Zeiss Observer Z1 equipped with an ApoTome.2 module and an Axiocam MRm at × 400 original magnification. °indicates outlier values
Figure 1 Cell culture model of heme toxicity. (a) Hmox1 (+/+) and Hmox1 (−/−) cells were incubated with 10 μM heme for 4 h. The relative Hmox1 mRNA induction in response to heme exposure was quantified by TaqMan RT-PCR. The mRNA levels are indicated as fold expression over control. No transcript was detected in the Hmox1 (−/−) cell line. (b) Cell pellets of Hmox1 (+/+) and Hmox1 (−/−) cells after 24 h of heme exposure (10 μM). Before imaging, cells were washed three times in large volumes of PBS containing EDTA. (c and d) Hmox1 (+/+) MEFs (blue) and Hmox1 (−/−) MEFs (red) were treated with the indicated concentrations of heme for 12 h. Intracellular ATP (c) and caspase 3/7 activity (d) were measured by luminescence assays. Data represent the mean±S.D. of six biologic replicates. (e) Hmox1 (+/+) MEFs (blue) and Hmox1 (−/−) MEFs (red) were treated with the indicated concentrations of heme for 14 h. Condensed nuclei were quantified by digital image analysis after Hoechst staining. Data include images (15 per replicate) from three independent biologic replicates. (f) Hmox 1 (−/−) MEFs were incubated with or without 20 μM heme for 12 h and stained with Hoechst (nuclei=yellow) and Alexa 488 phalloidin (actin cytoskeleton=cyan). The heme toxicity, which was characterized by cytoskeleton rarefication and nuclear condensation, was totally prevented by hemopexin (Hpx; 0.5 mg/ml). Images were acquired with a Zeiss Observer Z1 equipped with an ApoTome.2 module and an Axiocam MRm at × 400 original magnification. °indicates outlier valuesCC BY-NC-SA · PubMed Central
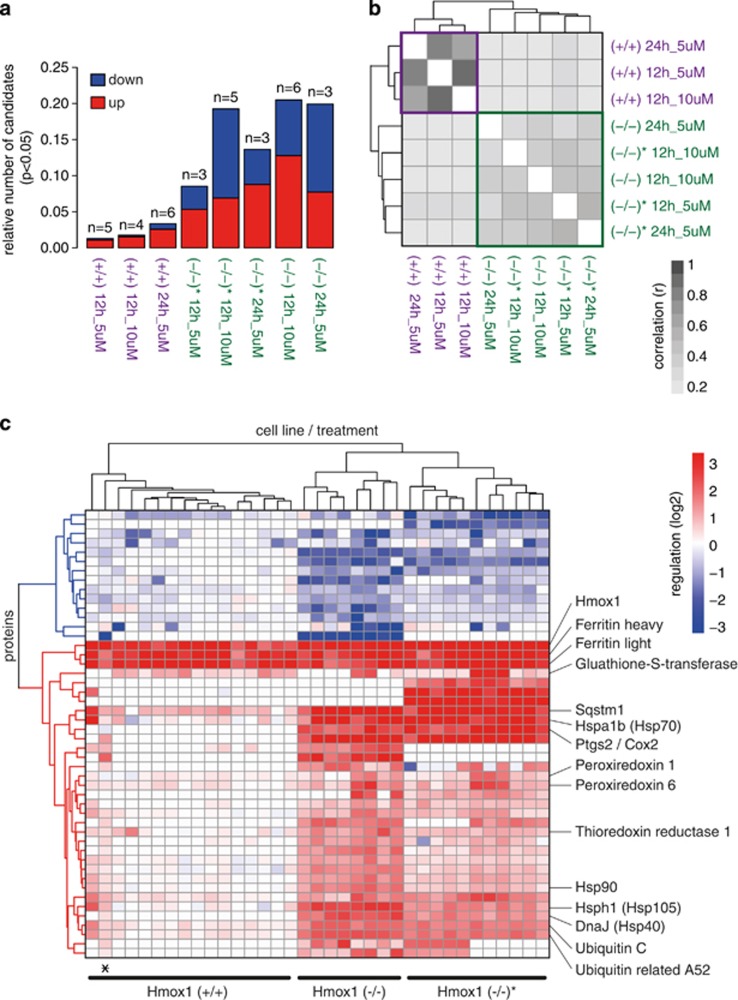
Figure 2 Proteome changes in response to uncontrolled cellular heme overload. (a) Number of experiments and fraction of proteins that were significantly changed compared with matched untreated cells (P<0.05) for each treatment × cell type condition. Hmox (−/−) and Hmox (−/−)* are two independent cell lines derived from two independent mouse embryos. Red indicates fraction of upregulated proteins, and blue indicates fraction of downregulated proteins. (b) Correlation plot of the log2 expression ratios of all significantly changed proteins for each treatment × cell type condition (darker=stronger correlation of protein expression pattern between two conditions). The plot defines a clear segregation of the protein expression data according to Hmox1 expression status. (c) Hierarchical clustering analysis of all proteins that have been identified as differentially expressed in any of the tested conditions. Each column in the plot represents data from an individual SILAC experiment. The plot includes all proteins with an absolute expression ratio of >0.5 (log2) in treated compared with matched untreated control cells (P<0.05). Red indicates protein expression is higher in treated cells, and blue indicates protein expression is lower in treated cells. The asterisk indicates a single Hmox (−/−) experiment that clustered within the group of Hmox (+/+) experiments. The identical plot with labeling information of all proteins can be found in Supplementary Figure 1
Figure 2 Proteome changes in response to uncontrolled cellular heme overload. (a) Number of experiments and fraction of proteins that were significantly changed compared with matched untreated cells (P<0.05) for each treatment × cell type condition. Hmox (−/−) and Hmox (−/−)* are two independent cell lines derived from two independent mouse embryos. Red indicates fraction of upregulated proteins, and blue indicates fraction of downregulated proteins. (b) Correlation plot of the log2 expression ratios of all significantly changed proteins for each treatment × cell type condition (darker=stronger correlation of protein expression pattern between two conditions). The plot defines a clear segregation of the protein expression data according to Hmox1 expression status. (c) Hierarchical clustering analysis of all proteins that have been identified as differentially expressed in any of the tested conditions. Each column in the plot represents data from an individual SILAC experiment. The plot includes all proteins with an absolute expression ratio of >0.5 (log2) in treated compared with matched untreated control cells (P<0.05). Red indicates protein expression is higher in treated cells, and blue indicates protein expression is lower in treated cells. The asterisk indicates a single Hmox (−/−) experiment that clustered within the group of Hmox (+/+) experiments. The identical plot with labeling information of all proteins can be found in Supplementary Figure 1CC BY-NC-SA · PubMed Central
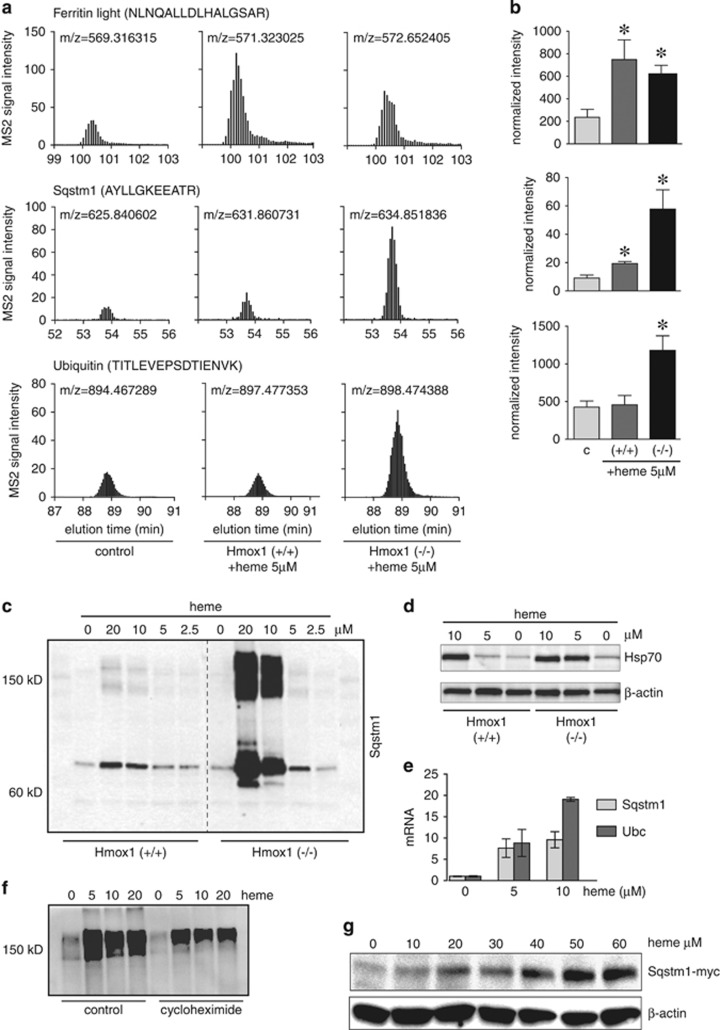
Figure 3 Expression of heme-triggered proteins. (a) Selected reaction mode (SRM) quantitative mass spectrometry of the ferritin light chain, Sqstm1, and ubiquitin. The graphs show elution profiles of the sum intensities of three SRM transitions of the indicated peptides. The m/z indicates the precursor mass of the respective peptide from light, medium, and heavy labeled cells. (b) The bar graphs show normalized sum intensities of four peptides per protein±S.E.M. from three independent experiments (*P<0.05 compared with control). (c and d) Detection of Sqstm1/p62 (c) and HSP-70 (d) by western blot of cell lysates from Hmox1 (+/+) and Hmox1 (−/−) MEF cells stimulated with a range of heme concentrations for 8 h. (e) RT-PCR of Sqstm1 and Ubc in control and heme-stimulated (5 h) Hmox1 (−/−) MEFs. Relative mRNA quantities were normalized to Hprt expression. (f) Western blot (nonreducing) of ubiquitin in control and heme-stimulated (6 h) Hmox1 (−/−) MEFs. Incubations were in the presence or absence of cycloheximide (100 μM) to inhibit de novo protein translation. (g) Anti-myc western blot of Sqstm1-myc expressed under a constitutive CMV promoter in stably transfected RAW-264 cells exposed to a range of heme concentrations
Figure 3 Expression of heme-triggered proteins. (a) Selected reaction mode (SRM) quantitative mass spectrometry of the ferritin light chain, Sqstm1, and ubiquitin. The graphs show elution profiles of the sum intensities of three SRM transitions of the indicated peptides. The m/z indicates the precursor mass of the respective peptide from light, medium, and heavy labeled cells. (b) The bar graphs show normalized sum intensities of four peptides per protein±S.E.M. from three independent experiments (*P<0.05 compared with control). (c and d) Detection of Sqstm1/p62 (c) and HSP-70 (d) by western blot of cell lysates from Hmox1 (+/+) and Hmox1 (−/−) MEF cells stimulated with a range of heme concentrations for 8 h. (e) RT-PCR of Sqstm1 and Ubc in control and heme-stimulated (5 h) Hmox1 (−/−) MEFs. Relative mRNA quantities were normalized to Hprt expression. (f) Western blot (nonreducing) of ubiquitin in control and heme-stimulated (6 h) Hmox1 (−/−) MEFs. Incubations were in the presence or absence of cycloheximide (100 μM) to inhibit de novo protein translation. (g) Anti-myc western blot of Sqstm1-myc expressed under a constitutive CMV promoter in stably transfected RAW-264 cells exposed to a range of heme concentrationsCC BY-NC-SA · PubMed Central
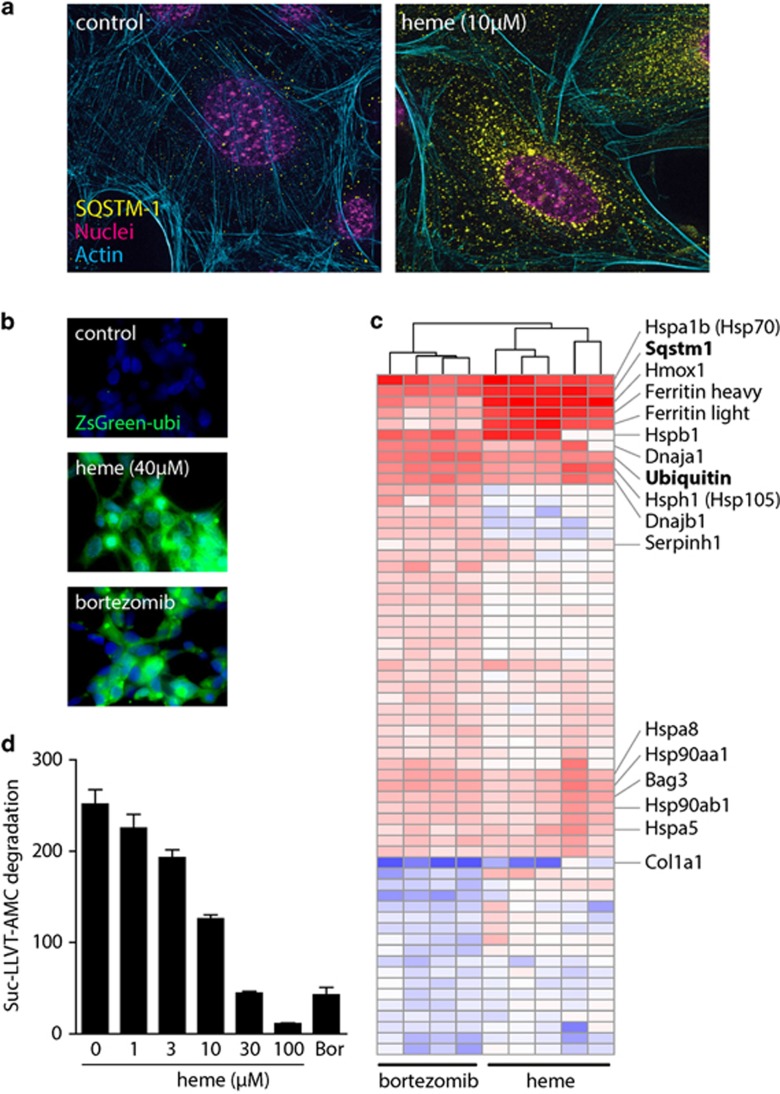
Figure 4 Heme is an inhibitor of the proteasome. (a) Immunofluorescence of Sqstm1/p62 (yellow) and actin (cyan) in Hmox1 (+/+) and Hmox1 (−/−) MEFs after exposure to heme (5 μM) for 5 h. Magenta indicates nuclei. Images were acquired with a Zeiss Observer Z1 equipped with an ApoTome.2 module and an Axiocam MRm at × 400 original magnification. (b) Effect of heme (40 μM) and bortezomib (100 pM) treatment for 6 h on the accumulation of an ubiquitin-tagged fluorescent protein (ZsGreen) expressed in HEK-293 cells. (c) Hierarchical clustering analysis of all proteins that have been identified as differentially expressed in heme-treated Hmox1 (−/−) cells and bortezomib-treated (10 pM) Hmox1 (+/+) MEF cells, respectively. The heme response data include all data from heme-treated Hmox1 (−/−) MEF cells shown in Figure 2 that were included into this analysis as the five condition group means. The bortezomib data represent data from four independent SILAC experiments. The plot includes all proteins with an absolute expression ratio of >0.5 (log2) in treated compared with matched untreated control cells (P<0.05). Red indicates protein expression higher in treated cells, and blue indicates protein expression lower in treated cells. The identical plot with labeling of all proteins can be found in Supplementary Figure 2. (d) Enzymatic activity of purified 26S proteasome±increasing concentrations of heme, as assessed by monitoring the release of fluorescent AMP from the proteasome substrate peptide Suc-LLVT-Amc. Bortezomib (Bor, 100 pM) was used as a positive proteasome inhibitor control. Data were corrected for fluorescence quenching by heme, and represent mean±S.D. of six independent replicates
Figure 4 Heme is an inhibitor of the proteasome. (a) Immunofluorescence of Sqstm1/p62 (yellow) and actin (cyan) in Hmox1 (+/+) and Hmox1 (−/−) MEFs after exposure to heme (5 μM) for 5 h. Magenta indicates nuclei. Images were acquired with a Zeiss Observer Z1 equipped with an ApoTome.2 module and an Axiocam MRm at × 400 original magnification. (b) Effect of heme (40 μM) and bortezomib (100 pM) treatment for 6 h on the accumulation of an ubiquitin-tagged fluorescent protein (ZsGreen) expressed in HEK-293 cells. (c) Hierarchical clustering analysis of all proteins that have been identified as differentially expressed in heme-treated Hmox1 (−/−) cells and bortezomib-treated (10 pM) Hmox1 (+/+) MEF cells, respectively. The heme response data include all data from heme-treated Hmox1 (−/−) MEF cells shown in Figure 2 that were included into this analysis as the five condition group means. The bortezomib data represent data from four independent SILAC experiments. The plot includes all proteins with an absolute expression ratio of >0.5 (log2) in treated compared with matched untreated control cells (P<0.05). Red indicates protein expression higher in treated cells, and blue indicates protein expression lower in treated cells. The identical plot with labeling of all proteins can be found in Supplementary Figure 2. (d) Enzymatic activity of purified 26S proteasome±increasing concentrations of heme, as assessed by monitoring the release of fluorescent AMP from the proteasome substrate peptide Suc-LLVT-Amc. Bortezomib (Bor, 100 pM) was used as a positive proteasome inhibitor control. Data were corrected for fluorescence quenching by heme, and represent mean±S.D. of six independent replicatesCC BY-NC-SA · PubMed Central
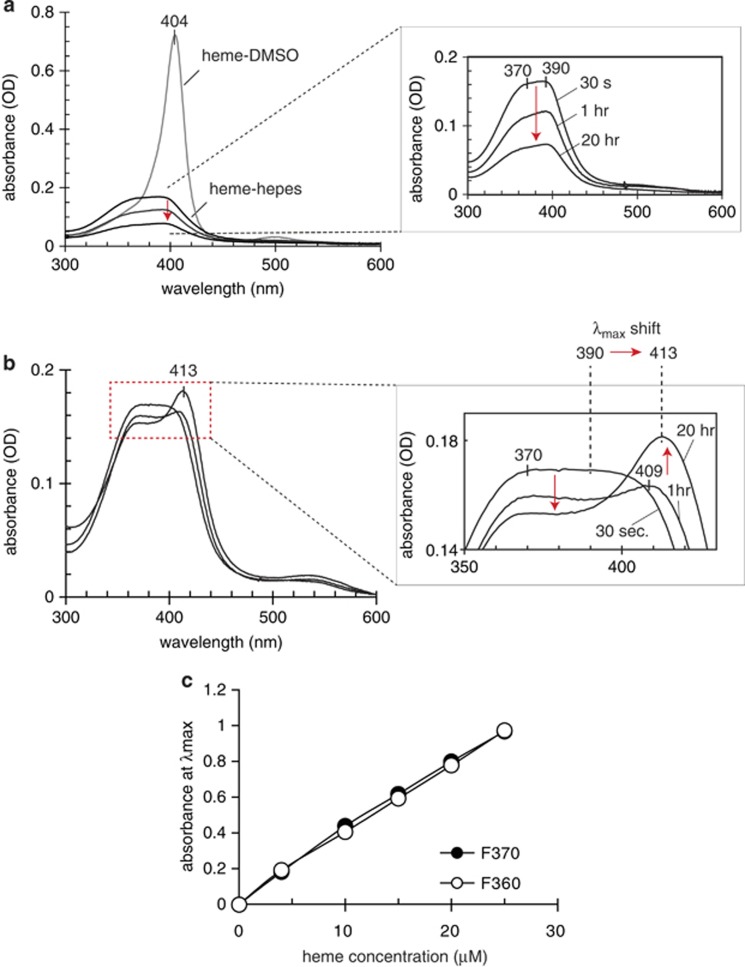
Figure 5 Heme binding to proteasome: UV/Vis spectrophotometry. (a) UV/Vis spectra of heme in DMSO or diluted in Hepes buffer (pH 7.4). The inset shows the time-dependent absorbance decay (red arrow) of heme in HEPES buffer. The spectra of heme in DMSO remained stable over days. (b) Time-dependent changes in the UV/Vis spectra of the heme in HEPES buffer sample shown in (a) after addition of proteasome-enriched cytoplasmic protein fraction. The inset shows enlarged selected spectra that reflect the major changes over time. The protein concentration in the proteasome fraction was 1.4 mg/ml. Identical results were observed with two proteasome fractions from rabbit reticulocyte (F360) and from HeLa cells (F370), respectively. (c) Changes in maximum absorbance after heme binding to the two proteasome fractions F360 and F370 across a range of heme concentrations
Figure 5 Heme binding to proteasome: UV/Vis spectrophotometry. (a) UV/Vis spectra of heme in DMSO or diluted in Hepes buffer (pH 7.4). The inset shows the time-dependent absorbance decay (red arrow) of heme in HEPES buffer. The spectra of heme in DMSO remained stable over days. (b) Time-dependent changes in the UV/Vis spectra of the heme in HEPES buffer sample shown in (a) after addition of proteasome-enriched cytoplasmic protein fraction. The inset shows enlarged selected spectra that reflect the major changes over time. The protein concentration in the proteasome fraction was 1.4 mg/ml. Identical results were observed with two proteasome fractions from rabbit reticulocyte (F360) and from HeLa cells (F370), respectively. (c) Changes in maximum absorbance after heme binding to the two proteasome fractions F360 and F370 across a range of heme concentrationsCC BY-NC-SA · PubMed Central
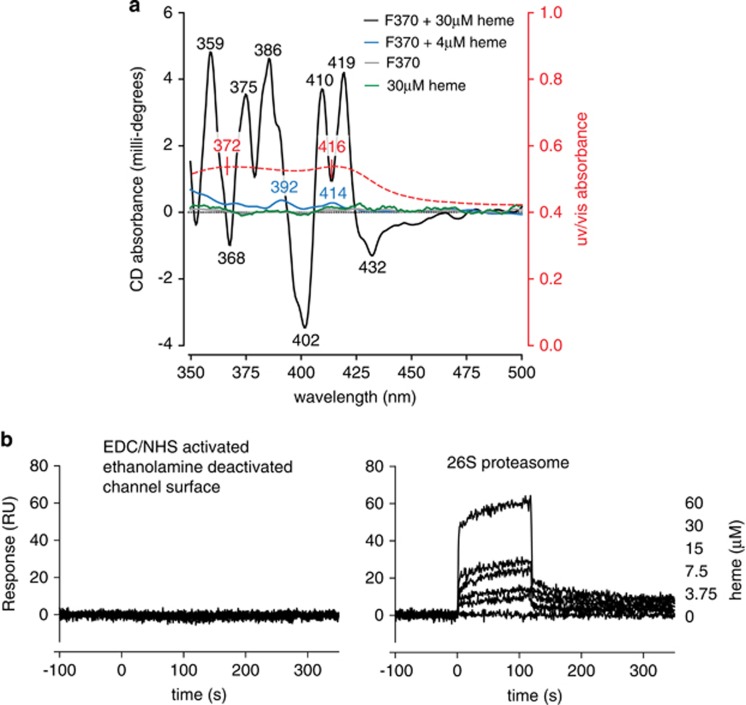
Figure 6 Heme binding to proteasome: circular dichroism and surface plasmon resonance. (a) CD of proteasome fraction F370, 6.6 mg/ml protein content (gray trace), heme, 30 μM (green trace), and 4 μM heme in the F370 proteasome fraction is shown (blue trace). The optical activities observed at 414 and at 392 nm (blue trace) are both related to the heme absorption spectrum (red overlay of absorbance). These two CEs in the visible range of the CD spectrum indicated protein-induced chirality. The CD spectrum of the F370 fractione containing 30 μM heme (black trace) shows several relatively strong CES in the 350–450 nm range, indicative of multiple heme binding sites. (b) Surface plasmon resonance measurements of heme binding to 26S proteasome. Sensograms of a heme concentration series (0–60 μM). (Left panel) Negative control channel that had been EDC/NHS activated and ethanolamine deactivated but not been protein covered (left). (Right panel) Channel with immobilized 26S proteasome showing a concentration-dependent binding response
Figure 6 Heme binding to proteasome: circular dichroism and surface plasmon resonance. (a) CD of proteasome fraction F370, 6.6 mg/ml protein content (gray trace), heme, 30 μM (green trace), and 4 μM heme in the F370 proteasome fraction is shown (blue trace). The optical activities observed at 414 and at 392 nm (blue trace) are both related to the heme absorption spectrum (red overlay of absorbance). These two CEs in the visible range of the CD spectrum indicated protein-induced chirality. The CD spectrum of the F370 fractione containing 30 μM heme (black trace) shows several relatively strong CES in the 350–450 nm range, indicative of multiple heme binding sites. (b) Surface plasmon resonance measurements of heme binding to 26S proteasome. Sensograms of a heme concentration series (0–60 μM). (Left panel) Negative control channel that had been EDC/NHS activated and ethanolamine deactivated but not been protein covered (left). (Right panel) Channel with immobilized 26S proteasome showing a concentration-dependent binding responseCC BY-NC-SA · PubMed Central
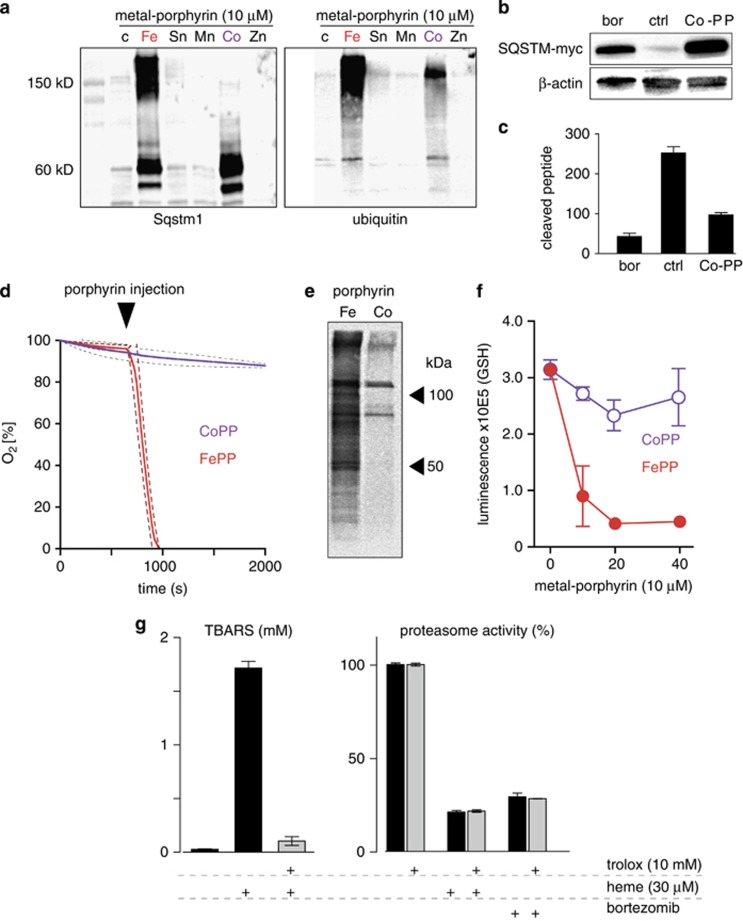
Figure 7 Dissection of proteasome inhibitor and oxidative activities of heme. (a) Hmox1 (−/−) MEFs were incubated with different metal porphyrins at 10 μM for 18 h. Expression of Sqstm1 and ubiquitin protein was probed by western blot. Accumulation of Sqstm1 and high-molecular-weight ubiquitin protein aggregates in cells treated with FePP and CoPP (Fe: iron; Sn: tin; Mn: manganese; Co: cobalt; Zn: zinc). (b) Accumulation of constitutively expressed SQSTM-myc in RAW264 cells after treatment with CoPP and bortezomib (Bor, 100 pM) for 12 h (western blot against myc-tag; β-actin as a loading control). (c) Inhibition of the proteolytic activity of purified 26S proteasome by CoPP and bortezomib was quantified by monitoring the release of fluorescent AMP from the proteasome substrate peptide Suc-LLVT-Amc. All data for CoPP were corrected for fluorescence quenching by the porphyrin. Data represent mean±S.D. of six biologic replicates. (d) Linoleic acid oxidation by FePP but not by CoPP. Equal amounts of each porphyrin (final concentration 10 μM) were injected into stirred, airtight reaction vessels at 37°C containing linoleic acid as the reactant. Oxygen concentration was measured continuously during the reaction with a Clark type electrode. Data represent mean±S.D. (dashed lines) of three independent experiments. (e) Formation of cellular protein-lipid adducts in FePP-treated (20 μM, 5 h) or CoPP-treated (20 μM, 5 h) Hmox1 (−/−) MEFs detected by click chemistry facilitated biotinylation of cell lysates and subsequent western blot detection by HRP streptavidin. (f) Glutathione (GSH) in Hmox1 (−/−) MEF cells after incubation with different concentrations of FePP and CoPP for 12 h. Data indicate mean±S.D. of luminescence from six biologic replicates. (g, left) Heme (30 μM)-triggered lipid peroxidation (TBARS) in soybean lecithin micelles and inhibition by Trolox (10 mM). Data represent mean±S.D. of three biologic replicates. (g, right) Enzymatic activity of purified 26S proteasome as assessed by monitoring the release of fluorescent AMP from the proteasome substrate peptide Suc-LLVT-Amc in the presence or absence of heme (30 μM), bortezomib (100 pM)±the antioxidant Trolox (10 mM). Data were corrected for fluorescence quenching by heme, and represent mean±S.D. of six independent replicates
Figure 7 Dissection of proteasome inhibitor and oxidative activities of heme. (a) Hmox1 (−/−) MEFs were incubated with different metal porphyrins at 10 μM for 18 h. Expression of Sqstm1 and ubiquitin protein was probed by western blot. Accumulation of Sqstm1 and high-molecular-weight ubiquitin protein aggregates in cells treated with FePP and CoPP (Fe: iron; Sn: tin; Mn: manganese; Co: cobalt; Zn: zinc). (b) Accumulation of constitutively expressed SQSTM-myc in RAW264 cells after treatment with CoPP and bortezomib (Bor, 100 pM) for 12 h (western blot against myc-tag; β-actin as a loading control). (c) Inhibition of the proteolytic activity of purified 26S proteasome by CoPP and bortezomib was quantified by monitoring the release of fluorescent AMP from the proteasome substrate peptide Suc-LLVT-Amc. All data for CoPP were corrected for fluorescence quenching by the porphyrin. Data represent mean±S.D. of six biologic replicates. (d) Linoleic acid oxidation by FePP but not by CoPP. Equal amounts of each porphyrin (final concentration 10 μM) were injected into stirred, airtight reaction vessels at 37°C containing linoleic acid as the reactant. Oxygen concentration was measured continuously during the reaction with a Clark type electrode. Data represent mean±S.D. (dashed lines) of three independent experiments. (e) Formation of cellular protein-lipid adducts in FePP-treated (20 μM, 5 h) or CoPP-treated (20 μM, 5 h) Hmox1 (−/−) MEFs detected by click chemistry facilitated biotinylation of cell lysates and subsequent western blot detection by HRP streptavidin. (f) Glutathione (GSH) in Hmox1 (−/−) MEF cells after incubation with different concentrations of FePP and CoPP for 12 h. Data indicate mean±S.D. of luminescence from six biologic replicates. (g, left) Heme (30 μM)-triggered lipid peroxidation (TBARS) in soybean lecithin micelles and inhibition by Trolox (10 mM). Data represent mean±S.D. of three biologic replicates. (g, right) Enzymatic activity of purified 26S proteasome as assessed by monitoring the release of fluorescent AMP from the proteasome substrate peptide Suc-LLVT-Amc in the presence or absence of heme (30 μM), bortezomib (100 pM)±the antioxidant Trolox (10 mM). Data were corrected for fluorescence quenching by heme, and represent mean±S.D. of six independent replicatesCC BY-NC-SA · PubMed Central
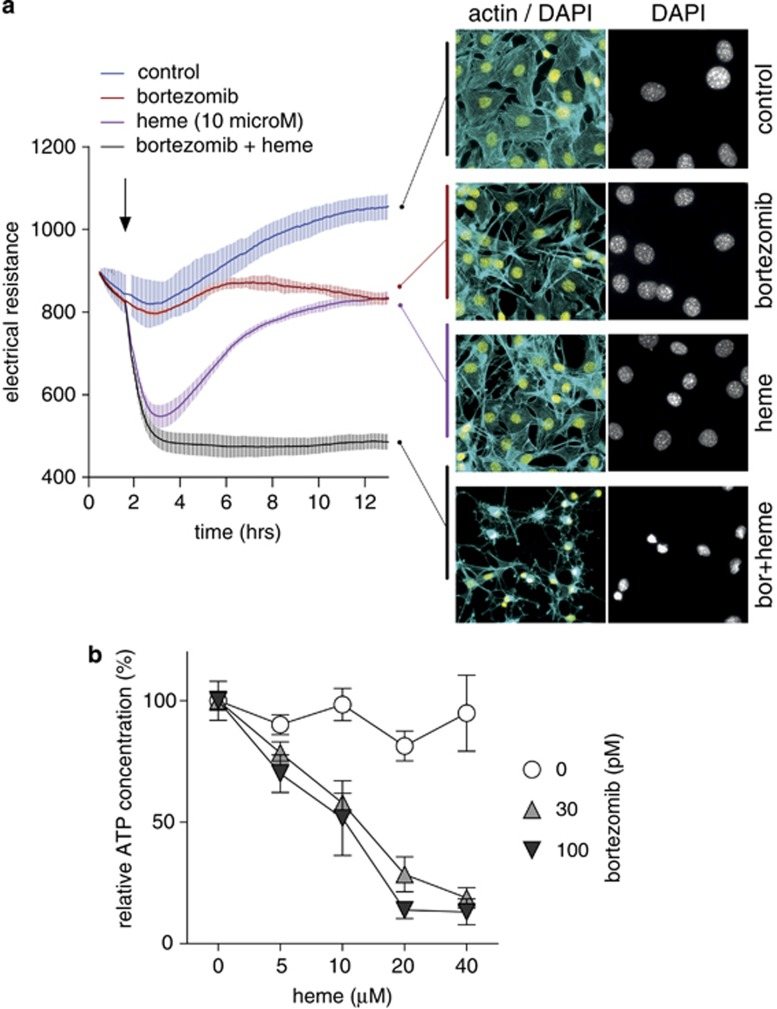
Figure 8 Proteasome inhibition sensitizes cells for heme toxicity. (a) Monolayer resistance of confluent Hmox1 (+/+) MEF cells was measured with an ECIS instrument during incubation of the cells with or without heme (10 μM), bortezomib (100 pM), or the combination of heme+bortezomib. Data represent mean±S.D. of four biologic replicates. At the end of the experiment, cells were fixed and stained for fluorescence microscopy with DAPI (yellow: nuclei) and Alexa 488 phalloidin (cyan: actin cytoskeleton). (b) Hmox1 (+/+) MEF cells were treated with a range of heme concentrations in the presence or absence of bortezomib (30 pM and 100 pM). After 12 h, cellular ATP was measured with a luminescence assay. Data are normalized to the respective control and represent mean±S.D. of six biologic replicates
Figure 8 Proteasome inhibition sensitizes cells for heme toxicity. (a) Monolayer resistance of confluent Hmox1 (+/+) MEF cells was measured with an ECIS instrument during incubation of the cells with or without heme (10 μM), bortezomib (100 pM), or the combination of heme+bortezomib. Data represent mean±S.D. of four biologic replicates. At the end of the experiment, cells were fixed and stained for fluorescence microscopy with DAPI (yellow: nuclei) and Alexa 488 phalloidin (cyan: actin cytoskeleton). (b) Hmox1 (+/+) MEF cells were treated with a range of heme concentrations in the presence or absence of bortezomib (30 pM and 100 pM). After 12 h, cellular ATP was measured with a luminescence assay. Data are normalized to the respective control and represent mean±S.D. of six biologic replicatesCC BY-NC-SA · PubMed Central

Verification

Claims the paper makes

The claims and statistics of this paper haven’t been checked yet.

Run the check — free, no account needed. It reads the open-access text and checks the sources it cites.

A few free checks a day · papers already verified open instantly · results are public

Claims other papers make about this one

Each is checked against this paper’s own text: does it say what the citing paper says it does?

Self-check

Percentages, sums and reported differences re-computed from the paper’s own numbers.

The self-check needs the paper’s full text.

Citations

Cites

Show all 2 references

Research works printed but not linked: 32

  1. Balla G, Vercellotti G, Eaton JW, Jacob HS . Heme uptake by endothelium synergizes polymorphonuclear granulocyte-mediated damage. Trans Assoc Am Physicians 1990; 103: 174–179.
  2. Schaer DJ, Buehler PW, Alayash AI, Belcher JD, Vercellotti GM . Hemolysis and free hemoglobin revisited: exploring hemoglobin and hemin scavengers as a novel class of therapeutic proteins. Blood 2013; 121: 1276–1284. · DOI · Paper page
  3. Boretti FS, Buehler PW, D'Agnillo F, Kluge K, Glaus T, Butt OI et al. Sequestration of extracellular hemoglobin within a haptoglobin complex decreases its hypertensive and oxidative effects in dogs and guinea pigs. J Clin Invest 2009; 119: 2271–2280.
  4. Balla J, Jacob HS, Balla G, Nath K, Vercellotti GM . Endothelial cell heme oxygenase and ferritin induction by heme proteins: a possible mechanism limiting shock damage. Trans Assoc Am Physicians 1992; 105: 1–6.
  5. Nath KA, Balla G, Vercellotti GM, Balla J, Jacob HS, Levitt MD et al. Induction of heme oxygenase is a rapid, protective response in rhabdomyolysis in the rat. J Clin Invest 1992; 90: 267–270. · DOI
  6. Balla J, Jacob HS, Balla G, Nath K, Eaton JW, Vercellotti GM . Endothelial-cell heme uptake from heme proteins: induction of sensitization and desensitization to oxidant damage. Proc Natl Acad Sci USA 1993; 90: 9285–9289. · DOI
  7. Jeney V, Balla J, Yachie A, Varga Z, Vercellotti GM, Eaton JW et al. Pro-oxidant and cytotoxic effects of circulating heme. Blood 2002; 100: 879–887. · DOI · Paper page
  8. Abraham NG, Kappas A . Pharmacological and clinical aspects of heme oxygenase. Pharmacol Rev 2008; 60: 79–127. · DOI · Paper page
  9. Yachie A, Niida Y, Wada T, Igarashi N, Kaneda H, Toma T et al. Oxidative stress causes enhanced endothelial cell injury in human heme oxygenase-1 deficiency. J Clin Invest 1999; 103: 129–135. · DOI
  10. Higdon AN, Benavides GA, Chacko BK, Ouyang X, Johnson MS, Landar A et al. Hemin causes mitochondrial dysfunction in endothelial cells through promoting lipid peroxidation: the protective role of autophagy. Am J Physiol Heart Circ Physiol 2012; 302: H1394–H1409. · DOI
  11. Lin S, Yin Q, Zhong Q, Lv FL, Zhou Y, Li JQ et al. Heme activates TLR4-mediated inflammatory injury via MyD88/TRIF signaling pathway in intracerebral hemorrhage. J Neuroinflammation 2012; 9: 46.
  12. Fortes GB, Alves LS, de Oliveira R, Dutra FF, Rodrigues D, Fernandez PL et al. Heme induces programmed necrosis on macrophages through autocrine TNF and ROS production. Blood 2012; 119: 2368–2375. · DOI · Paper page
  13. Schaer CA, Deuel JW, Bittermann AG, Rubio IG, Schoedon G, Spahn DR et al. Mechanisms of haptoglobin protection against hemoglobin peroxidation triggered endothelial damage. Cell Death Differ 2013; 20: 1569–1579. · DOI
  14. Pimenova T, Pereira CP, Gehrig P, Buehler PW, Schaer DJ, Zenobi R . Quantitative mass spectrometry defines an oxidative hotspot in hemoglobin that is specifically protected by haptoglobin. J Proteome Res 2010; 9: 4061–4070. · DOI
  15. Vallelian F, Schaer CA, Kaempfer T, Gehrig P, Duerst E, Schoedon G et al. Glucocorticoid treatment skews human monocyte differentiation into a hemoglobin-clearance phenotype with enhanced heme-iron recycling and antioxidant capacity. Blood 2010; 116: 5347–5356. · DOI
  16. Ong SE, Blagoev B, Kratchmarova I, Kristensen DB, Steen H, Pandey A et al. Stable isotope labeling by amino acids in cell culture, SILAC, as a simple and accurate approach to expression proteomics. Mol Cell Proteomics 2002; 1: 376–386. · DOI · Paper page
  17. Grunberg-Etkovitz N, Greenbaum L, Grinblat B, Malik Z . Proteasomal degradation regulates expression of porphobilinogen deaminase (PBGD) mutants of acute intermittent porphyria. Biochim Biophys Acta 2006; 1762: 819–827. · DOI
  18. Sacchetta P, Santarone S, Battista P, Di Cola D . Isolation of two high-molecular-mass proteinases from human erythrocytes. Eur J Biochem 1990; 191: 275–280. · DOI
  19. Hoffman L, Rechsteiner M . Nucleotidase activities of the 26S proteasome and its regulatory complex. J Biol Chem 1996; 271: 32538–32545. · DOI
  20. Xiong X, Chong E, Skach WR . Evidence that endoplasmic reticulum (ER)-associated degradation of cystic fibrosis transmembrane conductance regulator is linked to retrograde translocation from the ER membrane. J Biol Chem 1999; 274: 2616–2624. · DOI
  21. Oberdorf J, Carlson EJ, Skach WR . Uncoupling proteasome peptidase and ATPase activities results in cytosolic release of an ER polytopic protein. J Cell Sci 2006; 119 (Pt 2): 303–313. · DOI
  22. Johnston JA, Ward CL, Kopito RR . Aggresomes: a cellular response to misfolded proteins. J Cell Biol 1998; 143: 1883–1898. · DOI · Paper page
  23. Fineschi S, Reith W, Guerne PA, Dayer JM, Chizzolini C . Proteasome blockade exerts an antifibrotic activity by coordinately down-regulating type I collagen and tissue inhibitor of metalloproteinase-1 and up-regulating metalloproteinase-1 production in human dermal fibroblasts. FASEB J 2006; 20: 562–564. · DOI
  24. Buehler PW, D’Agnillo F, Schaer DJ . Hemoglobin-based oxygen carriers: from mechanisms of toxicity and clearance to rational drug design. Trends Mol Med 2010; 16: 447–457. · DOI
  25. Kriegenburg F, Poulsen EG, Koch A, Kruger E, Hartmann-Petersen R . Redox control of the ubiquitin-proteasome system: from molecular mechanisms to functional significance. Antioxid Redox Signal 2011; 15: 2265–2299. · DOI
  26. Breusing N, Grune T . Regulation of proteasome-mediated protein degradation during oxidative stress and aging. Biol Chem 2008; 389: 203–209. · DOI
  27. Kanayama HO, Tamura T, Ugai S, Kagawa S, Tanahashi N, Yoshimura T et al. Demonstration that a human 26S proteolytic complex consists of a proteasome and multiple associated protein components and hydrolyzes ATP and ubiquitin-ligated proteins by closely linked mechanisms. Eur J Biochem 1992; 206: 567–578. · DOI
  28. Santoro AM, Lo Giudice MC, D’Urso A, Lauceri R, Purrello R, Milardi D . Cationic porphyrins are reversible proteasome inhibitors. J Am Chem Soc 2012; 134: 10451–10457. · DOI
  29. Lipiski M, Deuel JW, Baek JH, Engelsberger WR, Buehler PW, Schaer DJ . Human hp1-1 and hp2-2 phenotype-specific haptoglobin therapeutics are both effective in vitro and in Guinea pigs to attenuate hemoglobin toxicity. Antioxid Redox Signal 2013; 19: 1619–1633. · DOI
  30. Gallien S, Bourmaud A, Kim SY, Domon B . Technical considerations for large-scale parallel reaction monitoring analysis. J Proteomics 2014; 100: 147–159. · DOI
  31. Collier GS, Pratt JM, De Wet CR, Tshabalala CF . Studies on haemin in dimethyl sulphoxide/water mixtures. Biochem J 1979; 179: 281–289. · DOI
  32. Schaer CA, Vallelian F, Imhof A, Schoedon G, Schaer DJ . Heme carrier protein (HCP-1) spatially interacts with the CD163 hemoglobin uptake pathway and is a target of inflammatory macrophage activation. J Leukoc Biol 2008; 83: 325–333. · DOI

Cited by

Sorted by citations

Metadata

Authors
Vallelian, F., Deuel, J. W., Opitz, L., Schaer, C. A., Puglia, M., Lönn, M., Engelsberger, W., Schauer, S., Karnaukhova, E., Spahn, D. R., Stocker, R., Buehler, P. W., & Schaer, D. J.
Venue
Cell Death & Differentiation
Published
2014-10-10
Volume
22
Issue
4
Pages
597-611
ISSN
  • 1350-9047
  • 1476-5403
Cited by
66
References
2
Language
en

About these checks

Registry, retraction, Cites and statistics results are computed, not judged, with one exception: a printed reference that no index lists is read once by a model before it counts as a citation error. Claims are extracted by a model and kept only when their quote appears verbatim in the text; each cited source is then checked, with a model’s help, for whether it says what the claim relies on. Those verdicts can be wrong — read the claim’s quote and the cited source before relying on one.

Statistics and arithmetic are recomputed, not judged.

Confidence bands are shown only for fields calibrated on our annotated test set. None is calibrated yet, so no band is shown.

What counts as a claim ›How we measure confidence ›How we check this ›

Are you an author, or do you see a problem with this page? Request a review