

The DOI matches its Crossref record; 2 of the 2 references it cites were found in a registry or an index.
IFN-γ signaling, with the synergistic contribution of TNF-α, mediates cell specific microglial and astroglial activation in experimental models of Parkinson's disease
Overview
The claims and statistics of this paper haven’t been checked yet.
Run the check — free, no account needed. It reads the open-access text and checks the sources it cites.
Integrity signals
Registry
Cites
Statistics
Figures
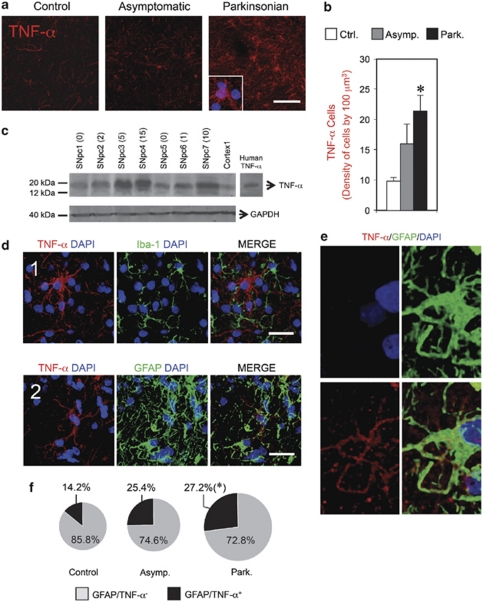
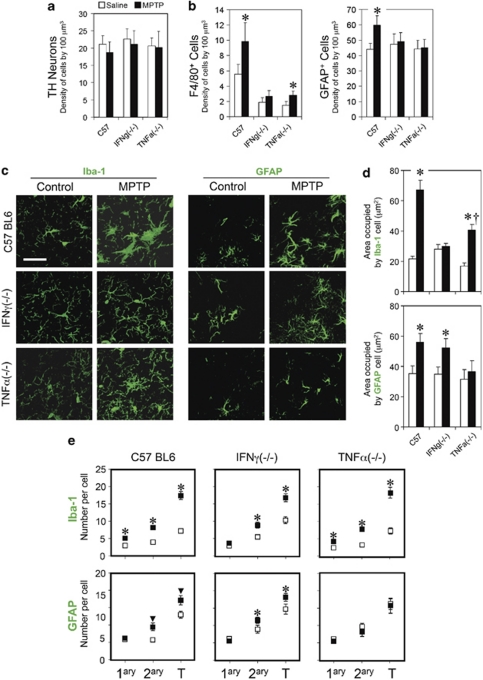
Verification
Claims the paper makes
The claims and statistics of this paper haven’t been checked yet.
Run the check — free, no account needed. It reads the open-access text and checks the sources it cites.
Claims other papers make about this one
Each is checked against this paper’s own text: does it say what the citing paper says it does?
The source backs part of the claim, not all of it — or backs it for a different population, condition or comparison.
In the citing paper
“Proinflammatory factors interferon gamma (IFNγ) and tumor necrosis factor-alpha (TNFα) are secreted by microglia and astrocytes, elevated in AD, and a subset of the Matrisome signal (Barcia et al., 2011; Chung and Benveniste, 1990; Clarke et al., 2010; Wang et al., 2015).”
From Cholesterol and matrisome pathways dysregulated in astrocytes and microglia (2022) · cites this paper as Barcia et al., 2011
Experimental — accuracy not yet measuredThe cited source says what the claim attributes to it.
In the citing paper
“Proinflammatory factors interferon gamma (IFNγ) and tumor necrosis factor-alpha (TNFα) are secreted by microglia and astrocytes, elevated in AD, and a subset of the Matrisome signal (Barcia et al., 2011; Chung and Benveniste, 1990; Clarke et al., 2010; Wang et al., 2015).”
From Cholesterol and matrisome pathways dysregulated in astrocytes and microglia (2022) · cites this paper as Barcia et al., 2011
The check wasn’t confident either way, so it gives no verdict — never disputed.
In the citing paper
“Proinflammatory factors interferon gamma (IFNγ) and tumor necrosis factor-alpha (TNFα) are secreted by microglia and astrocytes, elevated in AD, and a subset of the Matrisome signal (Barcia et al., 2011; Chung and Benveniste, 1990; Clarke et al., 2010; Wang et al., 2015).”
From Cholesterol and matrisome pathways dysregulated in astrocytes and microglia (2022) · cites this paper as Barcia et al., 2011
Experimental — accuracy not yet measured
Self-check
Percentages, sums and reported differences re-computed from the paper’s own numbers.
The self-check needs the paper’s full text.
Citations
Cites
McGeer, P. L., Itagaki, S., Boyes, B. E., & McGeer, E. G. (1988) · Neurology · doi:10.1212/wnl.38.8.1285 · Cited by 2,990
McGeer, P. L., Schwab, C., Parent, A., & Doudet, D. (2003) · Annals of Neurology · doi:10.1002/ana.10728 · Cited by 400
Research works printed but not linked: 38
- Forno LS, DeLanney LE, Irwin I, Di Monte D, Langston JW . Astrocytes and Parkinson's disease. Prog Brain Res 1992; 94: 429–436. · DOI
- Langston JW, Forno LS, Tetrud J, Reeves AG, Kaplan JA, Karluk D . Evidence of active nerve cell degeneration in the substantia nigra of humans years after 1-methyl-4-phenyl-1,2,3,6-tetrahydropyridine exposure. Ann Neurol 1999; 46: 598–605. · DOI · Paper page
- Barcia C, Sanchez Bahillo A, Fernandez-Villalba E, Bautista V, Poza YPM, Fernandez-Barreiro A et al. Evidence of active microglia in substantia nigra pars compacta of Parkinsonian monkeys 1 year after MPTP exposure. Glia 2004; 46: 402–409. · DOI
- Benveniste EN, Kwon J, Chung WJ, Sampson J, Pandya K, Tang LP . Differential modulation of astrocyte cytokine gene expression by TGF-beta. J Immunol 1994; 153: 5210–5221. · DOI
- Dickson DW, Lee SC, Mattiace LA, Yen SH, Brosnan C . Microglia and cytokines in neurological disease, with special reference to AIDS and Alzheimer's disease. Glia 1993; 7: 75–83. · DOI
- Mount MP, Lira A, Grimes D, Smith PD, Faucher S, Slack R et al. Involvement of interferon-gamma in microglial-mediated loss of dopaminergic neurons. J Neurosci 2007; 27: 3328–3337. · DOI
- Reale M, Iarlori C, Thomas A, Gambi D, Perfetti B, Di Nicola M et al. Peripheral cytokines profile in Parkinson's disease. Brain Behav Immun 2009; 23: 55–63. · DOI · Paper page
- Mogi M, Harada M, Riederer P, Narabayashi H, Fujita K, Nagatsu T . Tumor necrosis factor-alpha (TNF-alpha) increases both in the brain and in the cerebrospinal fluid from Parkinsonian patients. Neurosci Lett 1994; 165: 208–210. · DOI · Paper page
- Sriram K, Matheson JM, Benkovic SA, Miller DB, Luster MI, O’Callaghan JP . Mice deficient in TNF receptors are protected against dopaminergic neurotoxicity: implications for Parkinson's disease. FASEB J 2002; 16: 1474–1476. · DOI
- Ferger B, Leng A, Mura A, Hengerer B, Feldon J . Genetic ablation of tumor necrosis factor-alpha (TNF-alpha) and pharmacological inhibition of TNF-synthesis attenuates MPTP toxicity in mouse striatum. J Neurochem 2004; 89: 822–833. · DOI
- Barcia C, de Pablos V, Bautista-Hernandez V, Sanchez-Bahillo A, Bernal I, Fernandez-Villalba E et al. Increased plasma levels of TNF-alpha but not of IL1-beta in MPTP-treated monkeys one year after the MPTP administration. Parkinsonism Relat Disord 2005; 11: 435–439. · DOI
- Vazquez-Claverie M, Garrido-Gil P, San Sebastian W, Izal-Azcarate A, Belzunegui S, Marcilla I et al. Acute and chronic 1-methyl-4-phenyl-1,2,3,6-tetrahydropyridine administrations elicit similar microglial activation in the substantia nigra of monkeys. J Neuropathol Exp Neurol 2009; 68: 977–984. · DOI
- Hashioka S, Klegeris A, Schwab C, McGeer PL . Interferon-gamma-dependent cytotoxic activation of human astrocytes and astrocytoma cells. Neurobiol Aging 2009; 30: 1924–1935. · DOI
- Tsuda M, Masuda T, Kitano J, Shimoyama H, Tozaki-Saitoh H, Inoue K . IFN-gamma receptor signaling mediates spinal microglia activation driving neuropathic pain. Proc Natl Acad Sci USA 2009; 106: 8032–8037. · DOI
- Vega C, Pellerin L, Dantzer R, Magistretti PJ . Long-term modulation of glucose utilization by IL-1 alpha and TNF-alpha in astrocytes: Na+ pump activity as a potential target via distinct signaling mechanisms. Glia 2002; 39: 10–18. · DOI
- Kipp M, Karakaya S, Johann S, Kampmann E, Mey J, Beyer C . Oestrogen and progesterone reduce lipopolysaccharide-induced expression of tumour necrosis factor-alpha and interleukin-18 in midbrain astrocytes. J Neuroendocrinol 2007; 19: 819–822. · DOI · Paper page
- Lung HL, Leung KN, Stadlin A, Ma CM, Tsang D . Induction of tumor necrosis factor receptor type 2 gene expression by tumor necrosis factor-alpha in rat primary astrocytes. Life Sci 2001; 68: 2081–2091. · DOI
- Scalzo P, Kummer A, Cardoso F, Teixeira AL . Increased serum levels of soluble tumor necrosis factor-alpha receptor-1 in patients with Parkinson's disease. J Neuroimmunol 2009; 216: 122–125. · DOI
- Godoy MC, Tarelli R, Ferrari CC, Sarchi MI, Pitossi FJ . Central and systemic IL-1 exacerbates neurodegeneration and motor symptoms in a model of Parkinson's disease. Brain 2008; 131 (Part 7): 1880–1894. · DOI · Paper page
- Kurkowska-Jastrzebska I, Balkowiec-Iskra E, Ciesielska A, Joniec I, Cudna A, Zaremba MM et al. Decreased inflammation and augmented expression of trophic factors correlate with MOG-induced neuroprotection of the injured nigrostriatal system in the murine MPTP model of Parkinson's disease. Int Immunopharmacol 2009; 9: 781–791. · DOI
- Luchtman DW, Shao D, Song C . Behavior, neurotransmitters and inflammation in three regimens of the MPTP mouse model of Parkinson's disease. Physiol Behav 2009; 98: 130–138. · DOI
- Hebert G, Arsaut J, Dantzer R, Demotes-Mainard J . Time-course of the expression of inflammatory cytokines and matrix metalloproteinases in the striatum and mesencephalon of mice injected with 1-methyl-4-phenyl-1,2,3,6-tetrahydropyridine, a dopaminergic neurotoxin. Neurosci Lett 2003; 349: 191–195. · DOI
- Brochard V, Combadiere B, Prigent A, Laouar Y, Perrin A, Beray-Berthat V et al. Infiltration of CD4+ lymphocytes into the brain contributes to neurodegeneration in a mouse model of Parkinson disease. J Clin Invest 2009; 119: 182–192.
- Bogdan C, Schleicher U . Production of interferon-gamma by myeloid cells--fact or fancy? Trends Immunol 2006; 27: 282–290. · DOI
- Puddu P, Fantuzzi L, Borghi P, Varano B, Rainaldi G, Guillemard E et al. IL-12 induces IFN-gamma expression and secretion in mouse peritoneal macrophages. J Immunol 1997; 159: 3490–3497. · DOI
- Munder M, Mallo M, Eichmann K, Modolell M . Murine macrophages secrete interferon gamma upon combined stimulation with interleukin (IL)-12 and IL-18: a novel pathway of autocrine macrophage activation. J Exp Med 1998; 187: 2103–2108. · DOI
- Saijo K, Winner B, Carson CT, Collier JG, Boyer L, Rosenfeld MG et al. A Nurr1/CoREST pathway in microglia and astrocytes protects dopaminergic neurons from inflammation-induced death. Cell 2009; 137: 47–59. · DOI · Paper page
- Downen M, Amaral TD, Hua LL, Zhao ML, Lee SC . Neuronal death in cytokine-activated primary human brain cell culture: role of tumor necrosis factor-alpha. Glia 1999; 28: 114–127. · DOI
- Boka G, Anglade P, Wallach D, Javoy-Agid F, Agid Y, Hirsch EC . Immunocytochemical analysis of tumor necrosis factor and its receptors in Parkinson's disease. Neurosci Lett 1994; 172: 151–154. · DOI
- Chen H, Jacobs E, Schwarzschild MA, McCullough ML, Calle EE, Thun MJ et al. Nonsteroidal antiinflammatory drug use and the risk for Parkinson's disease. Ann neurol 2005; 58: 963–967. · DOI
- Hamza TH, Zabetian CP, Tenesa A, Laederach A, Montimurro J, Yearout D et al. Common genetic variation in the HLA region is associated with late-onset sporadic Parkinson's disease. Nat genet 2010; 42: 781–785. · DOI
- Kopf M, Bachmann MF, Marsland BJ . Averting inflammation by targeting the cytokine environment. Nat rev 2010; 9: 703–718.
- Herrero MT, Hirsch EC, Kastner A, Ruberg M, Luquin MR, Laguna J et al. Does neuromelanin contribute to the vulnerability of catecholaminergic neurons in monkeys intoxicated with MPTP? Neuroscience 1993; 56: 499–511. · DOI
- Paxinos GC, Franklin KBJ . The mouse brain in stereotaxic coordinates. Academic Press: New York, 2001.
- Paxinos G, Xu-Feng H, Toga A . The Rhesus Monkey Brain in Stereotaxic Coordinates. Academic Press: San Diego, 1999.
- Olzewski J., Baxter D . In: Boyd JD (ed.). Cytoarchitecture of the Human Brainstem S. Karger, Lippincott Company: Philadelphia and Montreal, 1954.
- Damier P, Hirsch EC, Agid Y, Graybiel AM . The substantia nigra of the human brain. II. Patterns of loss of dopamine-containing neurons in Parkinson's disease. Brain 1999; 122 (Part 8): 1437–1448. · DOI
- Barcia C, Thomas CE, Curtin JF, King GD, Wawrowsky K, Candolfi M et al. In vivo mature immunological synapses forming SMACs mediate clearance of virally infected astrocytes from the brain. J Exp Med 2006; 203: 2095–2107. · DOI
Cited by
Sorted by citations
Microglia in Neuroinflammation and Neurodegeneration: From Understanding to Therapy
Muzio, L., Viotti, A., & Martino, G. (2021) · Frontiers in Neuroscience · doi:10.3389/fnins.2021.742065 · Cited by 581
Reactive astrocytes in neurodegenerative diseases
Li, K., Li, J., Zheng, J., & Qin, S. (2019) · Aging and disease · doi:10.14336/ad.2018.0720 · Cited by 398
Astrocytes in Neurodegenerative Disease: Table 1.
Phatnani, H., & Maniatis, T. (2015) · Cold Spring Harbor Perspectives in Biology · doi:10.1101/cshperspect.a020628 · Cited by 420
Cholesterol and matrisome pathways dysregulated in astrocytes and microglia
TCW, J., Qian, L., Pipalia, N. H., Chao, M. J., Liang, S. A., Shi, Y., Jain, B. R., Bertelsen, S. E., Kapoor, M., Marcora, E., et al. (2022) · Cell · doi:10.1016/j.cell.2022.05.017 · Cited by 411
González, H., Elgueta, D., Montoya, A., & Pacheco, R. (2014) · Journal of Neuroimmunology · doi:10.1016/j.jneuroim.2014.07.012 · Cited by 352
Metadata
- Authors
- Barcia, C., Ros, C. M., Annese, V, Gómez, A., Ros-Bernal, F., Aguado-Llera, D., Martínez-Pagán, M. E., de Pablos, V, Fernandez-Villalba, E., & Herrero, M. T.
- Venue
- Cell Death & Disease
- Published
- 2011-04-07
- Volume
- 2
- Issue
- 4
- Pages
- e142-e142
- ISSN
- 2041-4889
- PMC
- PMC3122054
- Cited by
- 203
- References
- 2
- Language
- en
- Update notices
- erratum (2012-08-23)
About these checks
Registry, retraction, Cites and statistics results are computed, not judged, with one exception: a printed reference that no index lists is read once by a model before it counts as a citation error. Claims are extracted by a model and kept only when their quote appears verbatim in the text; each cited source is then checked, with a model’s help, for whether it says what the claim relies on. Those verdicts can be wrong — read the claim’s quote and the cited source before relying on one.
Statistics and arithmetic are recomputed, not judged.
Confidence bands are shown only for fields calibrated on our annotated test set. None is calibrated yet, so no band is shown.
What counts as a claim ›How we measure confidence ›How we check this ›
Are you an author, or do you see a problem with this page? Request a review
How to cite
Cite CoChat for the checks on this page, and the paper for its own findings.
- This page
- CoChat. (2026). Citation check: IFN-γ signaling, with the synergistic contribution of TNF-α, mediates cell specific microglial and astroglial activation in experimental models of Parkinson's disease. https://app.cochat.ai/papers/10.1038/cddis.2011.17
- The paper
- Barcia, C., Ros, C. M., Annese, V, Gómez, A., Ros-Bernal, F., Aguado-Llera, D., Martínez-Pagán, M. E., de Pablos, V, Fernandez-Villalba, E., & Herrero, M. T. (2011). IFN-γ signaling, with the synergistic contribution of TNF-α, mediates cell specific microglial and astroglial activation in experimental models of Parkinson's disease. Cell Death & Disease. https://doi.org/10.1038/cddis.2011.17
