

The DOI matches its Crossref record; 5 of the 5 references it cites were found in a registry or an index.
BECN1 and BIM interactions with MCL-1 determine fludarabine resistance in leukemic B cells
Overview
The claims and statistics of this paper haven’t been checked yet.
Run the check — free, no account needed. It reads the open-access text and checks the sources it cites.
Integrity signals
Registry
Cites
Statistics
Figures
Verification
Claims the paper makes
The claims and statistics of this paper haven’t been checked yet.
Run the check — free, no account needed. It reads the open-access text and checks the sources it cites.
Claims other papers make about this one
Each is checked against this paper’s own text: does it say what the citing paper says it does?
In the citing paper
“However, being a nonspecific inhibitor of oxidative phosphorylation [674, 675]”
From Guidelines for the use and interpretation of assays for monitoring autophagy (4th edition) 1 (2021) · cites this paper as [674]
Self-check
Percentages, sums and reported differences re-computed from the paper’s own numbers.
The self-check needs the paper’s full text.
Citations
Cites
Guidelines for the use and interpretation of assays for monitoring autophagy
Klionsky, D. J., Abdalla, F. C., Abeliovich, H., Abraham, R. T., Acevedo-Arozena, A., Adeli, K., Agholme, L., Agnello, M., Agostinis, P., Aguirre-Ghiso, J. A., et al. (2012) · Autophagy · doi:10.4161/auto.19496 · Cited by 3,996 · cited 6×
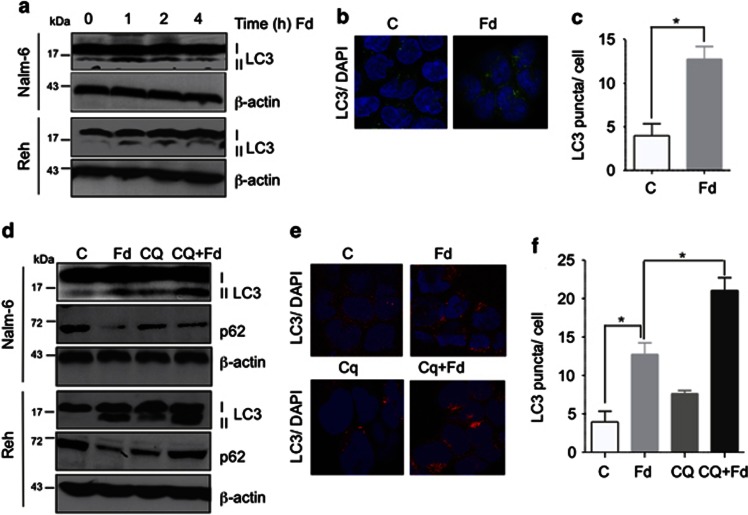
“Next, the autophagic flux was examined to distinguish between regulation of synthesis versus degradation of LC3-I/II.(14) To determine autophagic flux, chloroquine (CQ) was used to inhibit degradation through autophagy by blocking lysosomal acidification.”
BackgroundMethodInfluentialSelf-citationA Chemical Inhibitor of p53 That Protects Mice from the Side Effects of Cancer Therapy
Komarov, P. G., Komarova, E. A., Kondratov, R. V., Christov-Tselkov, K., Coon, J. S., Chernov, M. V., & Gudkov, A. V. (1999) · Science · doi:10.1126/science.285.5434.1733 · Cited by 1,270
Regulation of autophagy by cytoplasmic p53
Tasdemir, E., Maiuri, M. C., Galluzzi, L., Vitale, I., Djavaheri-Mergny, M., D'Amelio, M., Criollo, A., Morselli, E., Zhu, C., Harper, F., et al. (2008) · Nature Cell Biology · doi:10.1038/ncb1730 · Cited by 1,132
Li, H., Wang, P., Sun, Q., Ding, W.-X., Yin, X.-M., Sobol, R. W., Stolz, D. B., Yu, J., & Zhang, L. (2011) · Cancer Research · doi:10.1158/0008-5472.can-10-4475 · Cited by 150
Alternative Macroautophagic Pathways
Juenemann, K., & Reits, E. A. (2012) · International Journal of Cell Biology · doi:10.1155/2012/189794 · Cited by 58
Research works printed but not linked: 37
- Van den Neste E, Cardoen S, Offner F, Bontemps F . Old and new insights into the mechanisms of action of two nucleoside analogs active in lymphoid malignancies: fludarabine and cladribine. Int J Oncol 2005; 27: 1113–1124.
- Gribben JG, O'Brien S . Update on therapy of chronic lymphocytic leukemia. J Clin Oncol 2011; 29: 544–550. · DOI
- Kelly PN, Strasser A . The role of Bcl-2 and its pro-survival relatives in tumourigenesis and cancer therapy. Cell Death Differ 2011; 18: 1414–1424. · DOI
- Al-Harbi S, Hill BT, Mazumder S, Singh K, Devecchio J, Choudhary G et al. An antiapoptotic BCL-2 family expression index predicts the response of chronic lymphocytic leukemia to ABT-737. Blood 2011; 118: 3579–3590. · DOI
- Mazumder S, Choudhary GS, Al-Harbi S, Almasan A . Mcl-1 Phosphorylation defines ABT-737 resistance that can be overcome by increased NOXA expression in leukemic B cells. Cancer Res 2012; 72: 3069–3079. · DOI
- Pepper C, Lin TT, Pratt G, Hewamana S, Brennan P, Hiller L et al. Mcl-1 expression has in vitro and in vivo significance in chronic lymphocytic leukemia and is associated with other poor prognostic markers. Blood 2008; 112: 3807–3817. · DOI
- Garcia-Saez AJ . The secrets of the Bcl-2 family. Cell Death Differ 2012; 19: 1733–1740. · DOI
- Chen Q, Gong B, Almasan A . Distinct stages of cytochrome c release from mitochondria: evidence for a feedback amplification loop linking caspase activation to mitochondrial dysfunction in genotoxic stress induced apoptosis. Cell Death Differ 2000; 7: 227–233. · DOI
- Salvesen GS, Ashkenazi A . Snapshot: caspases. Cell 2011; 147: 476–476 e471. · DOI
- Youle RJ, Strasser A . The BCL-2 protein family: opposing activities that mediate cell death. Nat Rev Mol Cell Biol 2008; 9: 47–59. · DOI
- Hardwick JM, Chen YB, Jonas EA . Multipolar functions of BCL-2 proteins link energetics to apoptosis. Trends Cell Biol 2012; 22: 318–328. · DOI
- Kang R, Zeh HJ, Lotze MT, Tang D . The Beclin 1 network regulates autophagy and apoptosis. Cell Death Differ 2011; 18: 571–580. · DOI · Paper page
- Levine B, Sinha S, Kroemer G . Bcl-2 family members: dual regulators of apoptosis and autophagy. Autophagy 2008; 4: 600–606. · DOI
- Yorimitsu T, Klionsky DJ . Autophagy: molecular machinery for self-eating. Cell Death Differ 2005; 12 (Suppl 2): 1542–1552. · DOI
- Bonapace L, Bornhauser BC, Schmitz M, Cario G, Ziegler U, Niggli FK et al. Induction of autophagy-dependent necroptosis is required for childhood acute lymphoblastic leukemia cells to overcome glucocorticoid resistance. J Clinical Invest 2010; 120: 1310–1323. · DOI
- Marquez RT, Xu L . Bcl-2:Beclin 1 complex: multiple, mechanisms regulating autophagy/apoptosis toggle switch. Am J Cancer Res 2012; 2: 214–221.
- Chaachouay H, Ohneseit P, Toulany M, Kehlbach R, Multhoff G, Rodemann HP . Autophagy contributes to resistance of tumor cells to ionizing radiation. Radiother Oncol 2011; 99: 287–292. · DOI
- Gao W, Shen Z, Shang L, Wang X . Upregulation of human autophagy-initiation kinase ULK1 by tumor suppressor p53 contributes to DNA-damage-induced cell death. Cell Death Differ 2011; 18: 1598–1607. · DOI · Paper page
- Laane E, Tamm KP, Buentke E, Ito K, Kharaziha P, Oscarsson J et al. Cell death induced by dexamethasone in lymphoid leukemia is mediated through initiation of autophagy. Cell Death Differ 2009; 16: 1018–1029. · DOI
- Kabeya Y, Mizushima N, Uero T, Yamamoto A, Kirisako T, Noda T et al. LC3, a mammalian homologue of yeast Apg8p, is localized in autophagosome membranes after processing. EMBO J 2000; 19: 5720–5728. · DOI · Paper page
- Bjorkoy G, Lamark T, Brech A, Outzen H, Perander M, Overvatn A et al. p62/SQSTM1 forms protein aggregates degraded by autophagy and has a protective effect on huntingtin-induced cell death. J Cell Biol 2005; 171: 603–614. · DOI · Paper page
- Gonzalez-Polo RA, Boya P, Pauleau AL, Jalil A, Larochette N, Souquere S et al. The apoptosis/autophagy paradox: autophagic vacuolization before apoptotic death. J Cell Sci 2005; 118: 3091–3102. · DOI
- Maiuri MC, Zalckvar E, Kimchi A, Kroemer G . Self-eating and self-killing: crosstalk between autophagy and apoptosis. Nat Rev Mol Cell Biol 2007; 8: 741–752. · DOI
- Stacchini A, Aragno M, Vallario A, Alfarano A, Circosta P, Gottardi D et al. MEC1 and MEC2: two new cell lines derived from B-chronic lymphocytic leukaemia in prolymphocytoid transformation. Leuk Res 1999; 23: 127–136. · DOI
- Cassano C, Mactier S, Mulligan SP, Belov L, Huang P, Christopherson RI . Cladribine and fludarabine nucleoside change the levels of CD antigens on B-lymphoproliferative disorders. Int J Proteomics 2010; 2010: 964251. · DOI
- Egan DF, Shackelford DB, Mihaylova MM, Gelino S, Kohnz RA, Mair W et al. Phosphorylation of ULK1 (hATG1) by AMP-activated protein kinase connects energy sensing to mitophagy. Science 2011; 331: 456–461. · DOI · Paper page
- Levine B, Yuan J . Autophagy in cell death: an innocent convict? J Clin Invest 2005; 115: 2679–2688. · DOI
- Denton D, Nicolson S, Kumar S . Cell death by autophagy: facts and apparent artefacts. Cell Death Differ 2012; 19: 87–95. · DOI · Paper page
- Mahoney E, Lucas DM, Gupta SV, Wagner AJ, Herman SE, Smith LL et al. ER stress and autophagy: new discoveries in the mechanism of action and drug resistance of the cyclin-dependent kinase inhibitor flavopiridol. Blood 2012; 120: 1262–1273. · DOI
- Pattingre S, Tassa A, Qu X, Garuti R, Liang XH, Mizushima N et al. Bcl-2 antiapoptotic proteins inhibit Beclin 1-dependent autophagy. Cell 2005; 122: 927–939. · DOI · Paper page
- Maiuri MC, Le Toumelin G, Criollo A, Rain JC, Gautier F, Juin P et al. Functional and physical interaction between Bcl-X(L) and a BH3-like domain in Beclin-1. EMBO J 2007; 26: 2527–2539. · DOI
- Bannerji R, Kitada S, Flinn IW, Pearson M, Young D, Reed JC et al. Apoptotic-regulatory and complement-protecting protein expression in chronic lymphocytic leukemia: relationship to in vivo rituximab resistance. J Clin Oncol 2003; 21: 1466–1471. · DOI
- Paterson A, Mockridge CI, Adams JE, Krysov S, Potter KN, Duncombe AS et al. Mechanisms and clinical significance of BIM phosphorylation in chronic lymphocytic leukemia. Blood 2012; 119: 1726–1736. · DOI
- Zenz T, Krober A, Scherer K, Habe S, Buhler A, Benner A et al. Monoallelic TP53 inactivation is associated with poor prognosis in chronic lymphocytic leukemia: results from a detailed genetic characterization with long-term follow-up. Blood 2008; 112: 3322–3329. · DOI
- Chen Q, Chai YC, Mazumder S, Jiang C, Macklis RM, Chisolm GM et al. The late increase in intracellular free radical oxygen species during apoptosis is associated with cytochrome c release, caspase activation, and mitochondrial dysfunction. Cell Death Differ 2003; 10: 323–334. · DOI
- Park KJ, Lee SH, Lee CH, Jang JY, Chung J, Kwon MH et al. Upregulation of Beclin-1 expression and phosphorylation of Bcl-2 and p53 are involved in the JNK-mediated autophagic cell death. Biochem Biophys Res Commun 2009; 382: 726–729. · DOI
- Bucur O, Stancu AL, Khosravi-Far R, Almasan A . Analysis of apoptosis methods recently used in Cancer Research and Cell Death & Disease publications. Cell Death Dis 2012; 3: e263. · DOI
Cited by
Sorted by citations
Guidelines for the use and interpretation of assays for monitoring autophagy (3rd edition).
Klionsky, D. J., Abdelmohsen, K., Abe, A., Abedin, M. J., Abeliovich, H., Acevedo Arozena, A., Adachi, H., Adams, C. M., Adams, P. D., Adeli, K., et al. (2016) · Autophagy · doi:10.1080/15548627.2015.1100356 · Cited by 5,894
Self-citationGuidelines for the use and interpretation of assays for monitoring autophagy (4th edition) 1
Klionsky, D. J., Abdel-Aziz, A. K., Abdelfatah, S., Abdellatif, M., Abdoli, A., Abel, S., Abeliovich, H., Abildgaard, M. H., Abudu, Y. P., Acevedo-Arozena, A., et al. (2021) · Autophagy · doi:10.1080/15548627.2020.1797280 · Cited by 2,897
Self-citation
Metadata
- Authors
- Sharma, A., Singh, K., Mazumder, S., Hill, B. T., Kalaycio, M., & Almasan, A.
- Venue
- Cell Death & Disease
- Published
- 2013-05-16
- Volume
- 4
- Issue
- 5
- Pages
- e628-e628
- ISSN
- 2041-4889
- PMC
- PMC3674362
- Cited by
- 39
- References
- 5
- Language
- en
About these checks
Registry, retraction, Cites and statistics results are computed, not judged, with one exception: a printed reference that no index lists is read once by a model before it counts as a citation error. Claims are extracted by a model and kept only when their quote appears verbatim in the text; each cited source is then checked, with a model’s help, for whether it says what the claim relies on. Those verdicts can be wrong — read the claim’s quote and the cited source before relying on one.
Statistics and arithmetic are recomputed, not judged.
Confidence bands are shown only for fields calibrated on our annotated test set. None is calibrated yet, so no band is shown.
What counts as a claim ›How we measure confidence ›How we check this ›
Are you an author, or do you see a problem with this page? Request a review
