

The DOI matches its Crossref record; 67 of the 67 references it cites were found in a registry or an index.
Involvement of FoxO1 in the effects of follicle-stimulating hormone on inhibition of apoptosis in mouse granulosa cells
Open accessAbstract
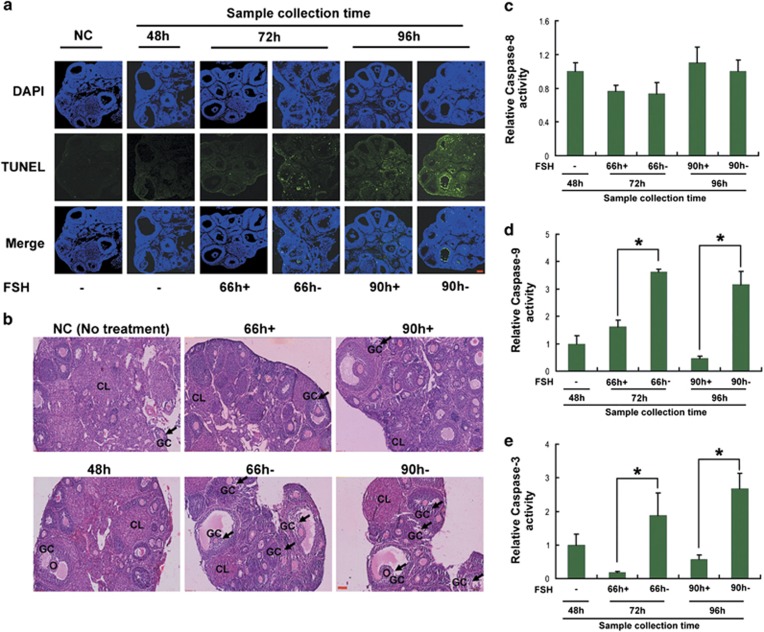
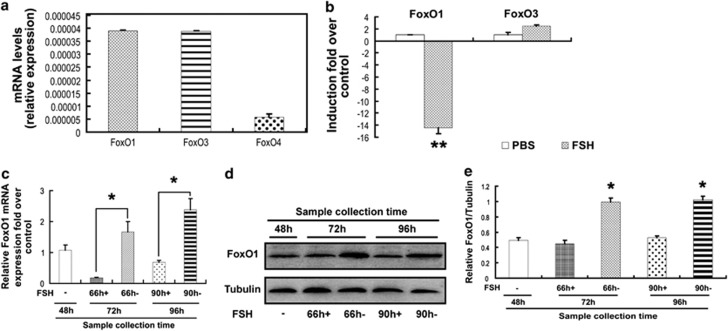
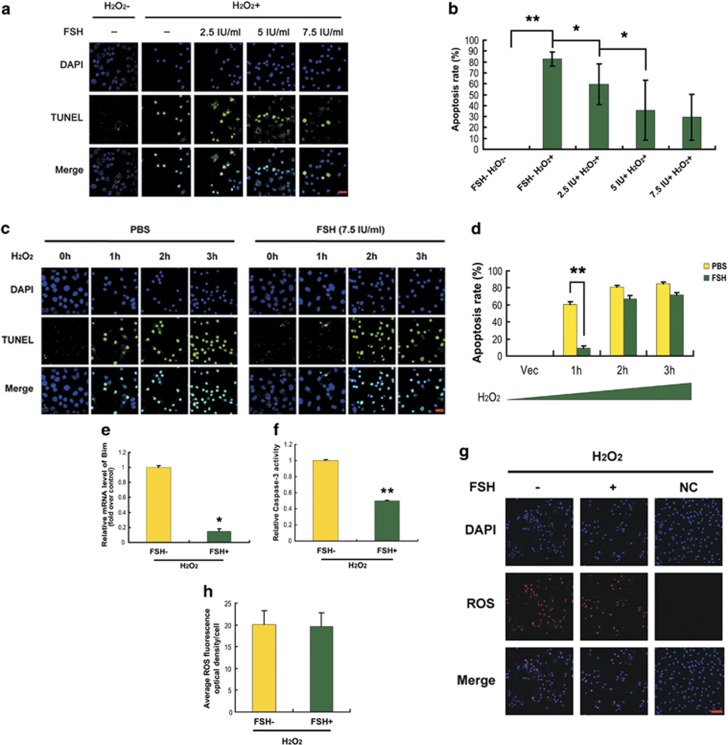
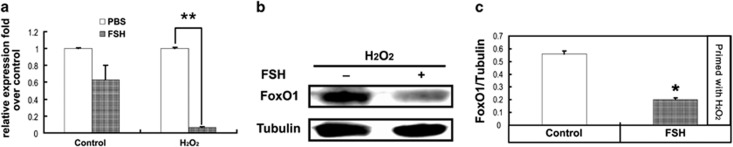
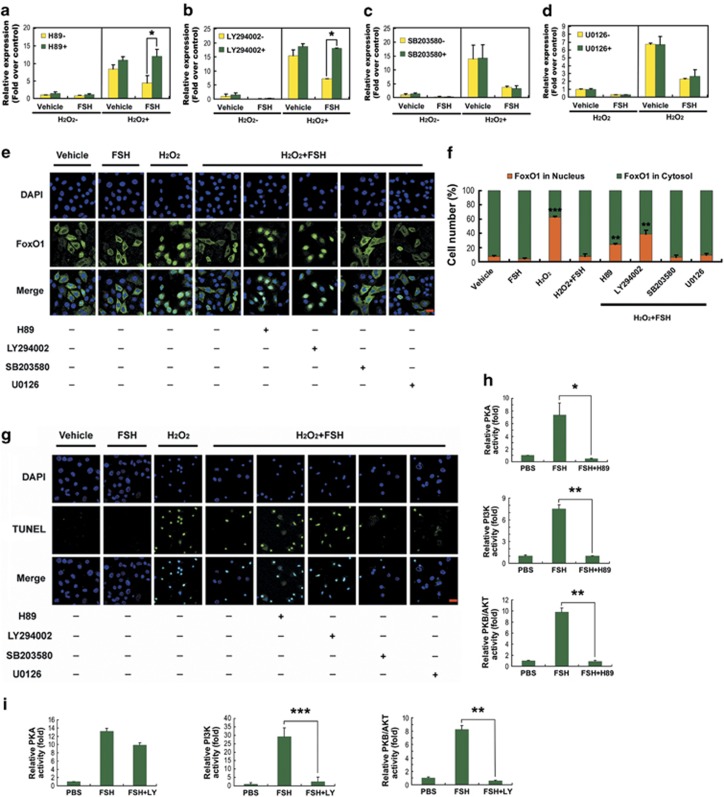
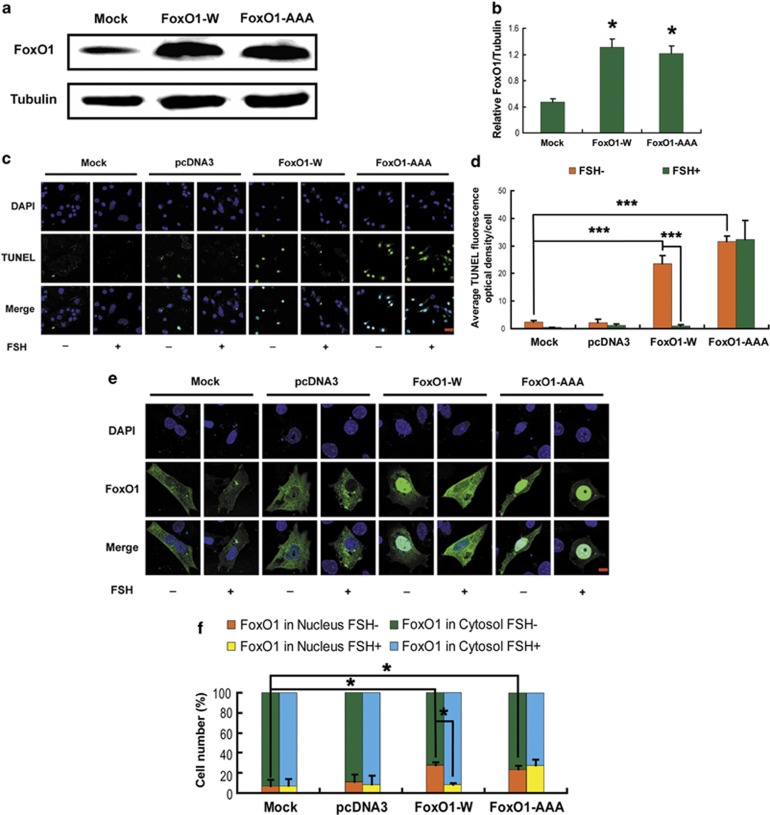
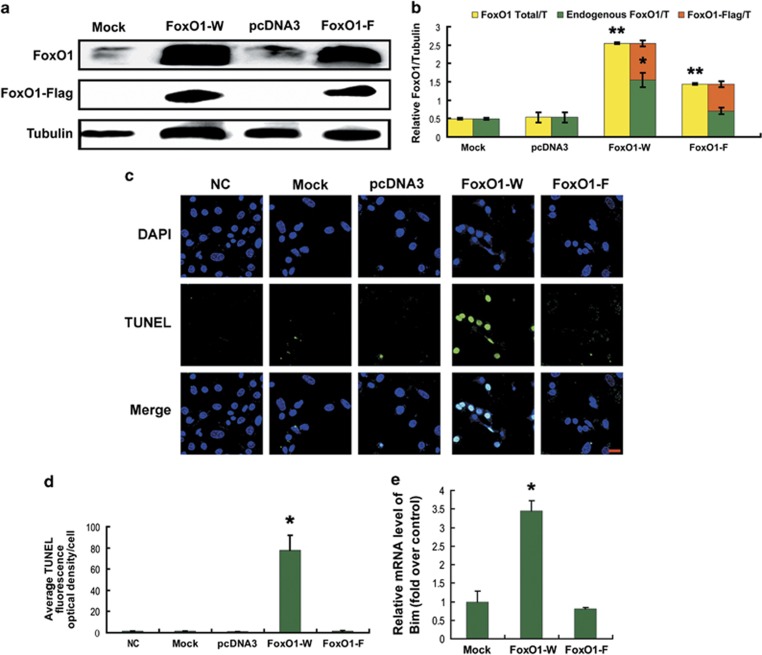
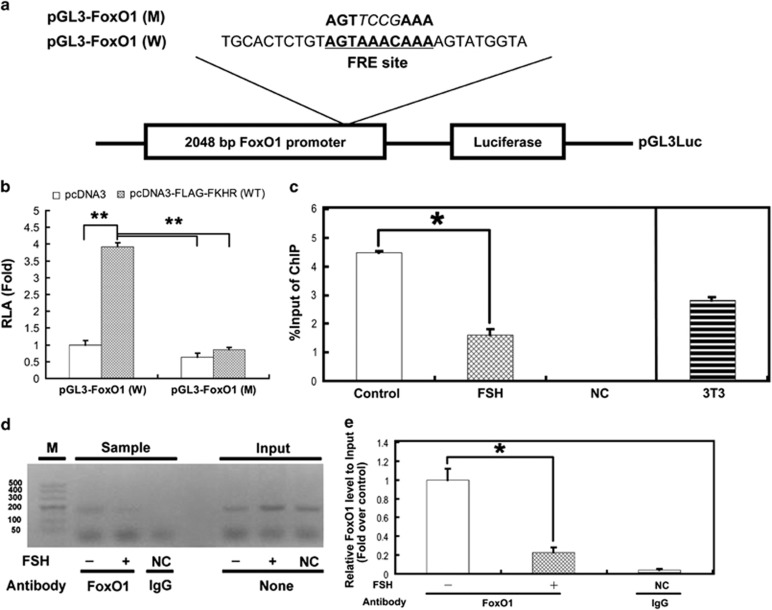
In mammalian ovaries, follicular atresia occurs periodically and destroys almost all the follicles in the ovary. Follicle-stimulating hormone (FSH) acts as the primary survival factor during follicular atresia by preventing apoptosis in granulosa cells. FoxO1 is a critical factor in promoting follicular atresia and granulosa cell apoptosis. FSH inhibits the induction of FoxO1. In this report, we investigated the role of FSH-FoxO1 pathway in mouse follicular atresia. FSH dampened stress-induced apoptosis and the expression of FoxO1 and pro-apoptosis genes in mouse granulosa cells (MGCs). In contrast, overexpression of FoxO1 inhibited the viability of MGCs and induced the expression of endogenous FoxO1. The signaling cascades involved in regulating FoxO1 activity upon FSH treatment were identified using FSH signaling antagonists. Blocking protein kinase A (PKA), phosphatidylinositol-3 kinase (PI3K) or protein kinase B (AKT) restored the upregulation of FoxO1 and apoptotic signals, which was suppressed by FSH. Moreover, inhibition of PKA or PI3K impaired FSH-induced AKT activity, but inactivation of PI3K or AKT had little effect on PKA activity in the presence of FSH. Correspondingly, constitutive activation of FoxO1 (all three AKT sites were replaced by alanines) also promoted MGC apoptosis despite FSH administration. Furthermore, both luciferase reporter assays and chromatin immunoprecipitation assays showed that FoxO1 directly bound to a FoxO-recognized element site within the FoxO1 promoter and contributed to the regulation of FoxO1 expression in response to FSH. Taken together, we propose a novel model in which FSH downregulates FoxO1-dependent apoptosis in MGCs by coordinating the PKA–PI3K–AKT–FoxO1 axis and FoxO1–FoxO1 positive feedback.
Overview
The claims and statistics of this paper haven’t been checked yet.
Run the check — free, no account needed. It reads the open-access text and checks the sources it cites.
Integrity signals
Registry
Cites
Statistics
Figures
Verification
Claims the paper makes
The claims and statistics of this paper haven’t been checked yet.
Run the check — free, no account needed. It reads the open-access text and checks the sources it cites.
Claims other papers make about this one
Each is checked against this paper’s own text: does it say what the citing paper says it does?
The source backs part of the claim, not all of it — or backs it for a different population, condition or comparison.
In the citing paper
“In PCOS, FOXO1 promotes follicle atresia and granulosa cell apoptosis by activation of pro-apoptotic proteins such as p27Kip1 and Bim, thereby contributing to the cystic changes in the ovaries13,14.”
From Efficacy and safety of GLP-1 receptor agonists on weight management and metabolic parameters in PCOS women: a meta-analysis of randomized controlled trials (2025) · cites this paper as [13]
Experimental — accuracy not yet measured
Self-check
Percentages, sums and reported differences re-computed from the paper’s own numbers.
The self-check needs the paper’s full text.
Citations
Cites
1 retracted
Li, X., Jiang, Y., Wang, Z., Liu, G., Hutz, R. J., Liu, W., Xie, Z., & Shi, F. (2005) · ZOOLOGICAL SCIENCE · doi:10.2108/zsj.22.1339 · Cited by 6
RetractedAkt Promotes Cell Survival by Phosphorylating and Inhibiting a Forkhead Transcription Factor
Brunet, A., Bonni, A., Zigmond, M. J., Lin, M. Z., Juo, P., Hu, L. S., Anderson, M. J., Arden, K. C., Blenis, J., & Greenberg, M. E. (1999) · Cell · doi:10.1016/s0092-8674(00)80595-4 · Cited by 5,594
Mammalian MAP kinase signalling cascades
Chang, L., & Karin, M. (2001) · Nature · doi:10.1038/35065000 · Cited by 5,118
Cloning of a novel receptor expressed in rat prostate and ovary.
Kuiper, G. G. J. M., Enmark, E., Pelto‐Huikko, M., Nilsson, S., & Gustafsson, J.-Α. (1996) · Proceedings of the National Academy of Sciences · doi:10.1073/pnas.93.12.5925 · Cited by 4,802
Mammalian Caspases: Structure, Activation, Substrates, and Functions During Apoptosis
Earnshaw, W. C., Martins, L. M., & Kaufmann, S. H. (1999) · Annual Review of Biochemistry · doi:10.1146/annurev.biochem.68.1.383 · Cited by 2,758
Follicle stimulating hormone is required for ovarian follicle maturation but not male fertility
Kumar, T. R., Wang, Y., Lu, N., & Matzuk, M. M. (1997) · Nature Genetics · doi:10.1038/ng0297-201 · Cited by 1,351
Dynamic FoxO transcription factors
Huang, H., & Tindall, D. J. (2007) · Journal of Cell Science · doi:10.1242/jcs.001222 · Cited by 1,124
A quantitative and cytological study of germ cells in human ovaries
Baker, T. G. (1963) · Proceedings of the Royal Society B Biological Sciences · doi:10.1098/rspb.1963.0055 · Cited by 1,094
DAF-16 Target Genes That Control C. elegans Life-Span and Metabolism
Lee, S. S., Kennedy, S., Tolonen, A. C., & Ruvkun, G. (2003) · Science · doi:10.1126/science.1083614 · Cited by 669
Gilley, J., Coffer, P. J., & Ham, J. (2003) · The Journal of Cell Biology · doi:10.1083/jcb.200303026 · Cited by 659
Dijkers, P., Medema, R. H., Pals, C., Banerji, L., Thomas, N., Lam, E., Burgering, B., Raaijmakers, J., Lammers, J.-W. J., Koenderman, L., et al. (2000) · Molecular and Cellular Biology · doi:10.1128/mcb.20.24.9138-9148.2000 · Cited by 621
Nakamura, N., Ramaswamy, S., Vázquez, F., Signoretti, S., Loda, M. F., & Sellers, W. R. (2000) · Molecular and Cellular Biology · doi:10.1128/mcb.20.23.8969-8982.2000 · Cited by 567
Manipulation of Human Ovarian Function: Physiological Concepts and Clinical Consequences*
Fauser, B. C. J. M., & van Heusden, A. M. (1997) · Endocrine Reviews · doi:10.1210/edrv.18.1.0290 · Cited by 509
Nicolson, G. L., Yanagimachi, R., & Yanagimachi, H. (1975) · The Journal of Cell Biology · doi:10.1083/jcb.66.2.263 · Cited by 489
Burgering, B. M. T., & Medema, R. H. (2003) · Journal of Leukocyte Biology · doi:10.1189/jlb.1202629 · Cited by 443
González, I., Falender, A. E., Ochsner, S. A., Firestone, G. L., & Richards, J. S. (2000) · Molecular Endocrinology · doi:10.1210/mend.14.8.0500 · Cited by 432
Hunzicker-Dunn, M. E., & Maizels, E. T. (2006) · Cellular Signalling · doi:10.1016/j.cellsig.2006.02.011 · Cited by 383
Roy, S. K., Srivastava, R. K., & Shankar, S. (2010) · Journal of Molecular Signaling · doi:10.1186/1750-2187-5-10 · Cited by 381
FOXO Proteins Regulate Tumor Necrosis Factor-related Apoptosis Inducing Ligand Expression
Modur, V., Nagarajan, R., Evers, B. M., & Milbrandt, J. (2002) · Journal of Biological Chemistry · doi:10.1074/jbc.m207509200 · Cited by 371
Liu, C., YU, K., SHI, X., Wang, J., Lam, P. K. S., Wu, R. S. S., & Zhou, B. S. (2007) · Aquatic Toxicology · doi:10.1016/j.aquatox.2007.02.006 · Cited by 367
Chun, S. Y., Billig, H., Tilly, J. L., Furuta, I., TSAFRIRI, A., & Hsueh, A. J. W. (1994) · Endocrinology · doi:10.1210/endo.135.5.7525255 · Cited by 363
Chun, S. Y., Eisenhauer, K. M., Minami, S., Billig, H., Perlas, E., & Hsueh, A. J. W. (1996) · Endocrinology · doi:10.1210/endo.137.4.8625923 · Cited by 360
FoxO transcription factors: their roles in the maintenance of skeletal muscle homeostasis
Sanchez, A. M. J., Candau, R. B., & Bernardi, H. (2013) · Cellular and Molecular Life Sciences · doi:10.1007/s00018-013-1513-z · Cited by 345
Dorrington, J. H., Moon, Y. S., & Armstrong, D. T. (1975) · Endocrinology · doi:10.1210/endo-97-5-1328 · Cited by 321
Harris, C. A., & Johnson, E. M. (2001) · Journal of Biological Chemistry · doi:10.1074/jbc.m104073200 · Cited by 307
Nakae, J., Barr, V. A., & Accili, D. (2000) · The EMBO Journal · doi:10.1093/emboj/19.5.989 · Cited by 274
Alam, H., Maizels, E. T., Park, Y., Ghaey, S., Feiger, Z. J., Chandel, N. S., & Hunzicker-Dunn, M. E. (2004) · Journal of Biological Chemistry · doi:10.1074/jbc.m401235200 · Cited by 267
Survival factors regulating ovarian apoptosis -- dependence on follicle differentiation
Markström, E., Svensson, E., Shao, R., Svanberg, B., & Billig, H. (2002) · Reproduction · doi:10.1530/rep.0.1230023 · Cited by 258
Genes involved in human premature ovarian failure
Persani, L., Rossetti, R., & Cacciatore, C. (2010) · Journal of Molecular Endocrinology · doi:10.1677/jme-10-0070 · Cited by 244
The Transcription of FOXO Genes Is Stimulated by FOXO3 and Repressed by Growth Factors
Essaghir, A., Dif, N., Marbehant, C. Y., Coffer, P. J., & Demoulin, J. (2009) · Journal of Biological Chemistry · doi:10.1074/jbc.m808848200 · Cited by 225
Richards, J., Sharma, S., Falender, A. E., & Lo, Y.-H. (2002) · Molecular Endocrinology · doi:10.1210/mend.16.3.0806 · Cited by 211
Urbich, C., Knau, A., Fichtlscherer, S., Walter, D. H., Brühl, T., Potente, M., Hofmann, W. K., de Vos, S., Zeiher, A. M., & Dimmeler, S. (2005) · The FASEB Journal · doi:10.1096/fj.04-2727fje · Cited by 200
FOXO3 induces FOXO1-dependent autophagy by activating the AKT1 signaling pathway
Zhou, J., Liao, W., Yang, J. H., Ma, K., Li, X., Wang, Y., Wang, D., Wang, L., Zhang, Y., Yin, Y., et al. (2012) · Autophagy · doi:10.4161/auto.21830 · Cited by 196
The Regulation of Ovarian Granulosa Cell Death by Pro- and Anti-apoptotic Molecules
MATSUDA‐MINEHATA, F., Inoue, N., Goto, Y., & MANABE, N. (2006) · Journal of Reproduction and Development · doi:10.1262/jrd.18069 · Cited by 193
Shen, M., Lin, F., Zhang, J., Tang, Y., Chen, W., & Liu, H. (2012) · Journal of Biological Chemistry · doi:10.1074/jbc.m112.349902 · Cited by 185
Self-citationKreeger, P. K., Fernandes, N., Woodruff, T. K., & Shea, L. D. (2005) · Biology of Reproduction · doi:10.1095/biolreprod.105.042390 · Cited by 185
FOXO transcription factors in ageing and cancer
Greer, E. L., & Brunet, A. (2007) · Acta Physiologica · doi:10.1111/j.1748-1716.2007.01780.x · Cited by 182
Park, Y., Maizels, E. T., Feiger, Z. J., Alam, H., Peters, C. A., Woodruff, T. K., Unterman, T. G., Lee, E. J., Jameson, J. L., & Hunzicker-Dunn, M. E. (2004) · Journal of Biological Chemistry · doi:10.1074/jbc.m409486200 · Cited by 172
Fan, H., O’Connor, A., Shitanaka, M., Shimada, M., Liu, Z., & Richards, J. S. (2010) · Molecular Endocrinology · doi:10.1210/me.2010-0141 · Cited by 167
Self-citationAdachi, M., Osawa, Y., Uchinami, H., Kitamura, T., Accili, D., & Brenner, D. A. (2007) · Gastroenterology · doi:10.1053/j.gastro.2007.01.033 · Cited by 158
Liu, Z., Rudd, M. D., Hernandez-Gonzalez, I., González, I., Fan, H., Zeleznik, A. J., & Richards, J. S. (2009) · Molecular Endocrinology · doi:10.1210/me.2008-0412 · Cited by 154
Self-citationHsu, S. Y., Lin, P., & Hsueh, A. J. W. (1998) · Molecular Endocrinology · doi:10.1210/mend.12.9.0166 · Cited by 137
Cottom, J. E., Salvador, L., Maizels, E. T., Reierstad, S., Park, Y., Carr, D. W., Davare, M. A., Hell, J. W., Palmer, S. S., Dent, P., et al. (2003) · Journal of Biological Chemistry · doi:10.1074/jbc.m203901200 · Cited by 136
Development of the dominant follicle: mechanisms of selection and maintenance of oocyte quality
WEBB, R., & Campbell, B. (2007) · Reproduction in Domestic Ruminants · doi:10.5661/rdr-vi-141 · Cited by 123
Proteomic Analysis of Coregulators Bound to ERα on DNA and Nucleosomes Reveals Coregulator Dynamics
Foulds, C. E., Feng, Q. F., Chen, D., Bailey, S., Hunsaker, T. L., Malovannaya, A., Hamilton, R. A., Gates, L. A., Zhang, Z., Li, C., et al. (2013) · Molecular Cell · doi:10.1016/j.molcel.2013.06.007 · Cited by 119
3-Nitropropionic Acid Induces Ovarian Oxidative Stress and Impairs Follicle in Mouse
Zhang, J., Shen, M., Zhu, C., Yu, F., Liu, Z., Ally, N., Sun, S., Li, K., & Liu, H. (2014) · PLoS ONE · doi:10.1371/journal.pone.0086589 · Cited by 112
Self-citationOxberry, B. A., & Greenwald, G. S. (1982) · Biology of Reproduction · doi:10.1095/biolreprod27.2.505 · Cited by 105
Mammalian Follicular Development and Atresia: Role of Apoptosis
Asselin, É., Xiao, C. W., Wang, Y. F., & Tsang, B. K. (2000) · Neurosignals · doi:10.1159/000014627 · Cited by 103
Lützner, N., Kalbacher, H., Krones, A., & Rösl, F. (2012) · PLoS ONE · doi:10.1371/journal.pone.0042166 · Cited by 101
FOXO1/3 Depletion in Granulosa Cells Alters Follicle Growth, Death and Regulation of Pituitary FSH
Liu, Z., Castrillón, D. H., Zhou, W. J., & Richards, J. S. (2013) · Molecular Endocrinology · doi:10.1210/me.2012-1296 · Cited by 97
Self-citationMubarak, B. R. A., Soriano, F. X., & Hardingham, G. E. (2009) · Channels · doi:10.4161/chan.3.4.9381 · Cited by 82
Hormone-dependent nuclear export of estradiol receptor and DNA synthesis in breast cancer cells
Lombardi, M., Castoria, G., Migliaccio, A., Barone, M. V., Stasio, R. D., Ciociola, A., Bottero, D., Yamaguchi, H., Appella, E., & Auricchio, F. (2008) · The Journal of Cell Biology · doi:10.1083/jcb.200712125 · Cited by 78
Wang, X. N., & Greenwald, G. S. (1993) · Reproduction · doi:10.1530/jrf.0.0990403 · Cited by 76
Wang, X.-L., Wu, Y., Tan, L.-B., Tian, Z., Liu, J.-H., Zhu, D.-S., & Shen-ming, Z. (2012) · Journal of Biological Chemistry · doi:10.1074/jbc.m111.293274 · Cited by 76
Munagala, R., Aqil, F., Vadhanam, M. V., & Gupta, R. C. (2013) · Cancer Letters · doi:10.1016/j.canlet.2013.06.012 · Cited by 72
Transforming growth factor-β: its role in ovarian follicle development
Rosairo, D., Kuyznierewicz, I., Findlay, J. K., & Drummond, A. E. (2008) · Reproduction · doi:10.1530/rep-08-0310 · Cited by 65
Role of FSH in regulating granulosa cell division and follicular atresia in rats
Peluso, J. J., & Steger, R. W. (1978) · Reproduction · doi:10.1530/jrf.0.0540275 · Cited by 65
Cunningham, M. A., Zhu, Q., Unterman, T. G., & Hammond, J. M. (2003) · Endocrinology · doi:10.1210/en.2003-0678 · Cited by 64
Shi, F., & Lapolt, P. (2003) · Journal of Endocrinology · doi:10.1677/joe.0.1790195 · Cited by 63
Cataldo, N. A., Dumesic, D. A., Goldsmith, P. C., & Jaffe, R. B. (2000) · Human Reproduction · doi:10.1093/humrep/15.9.1889 · Cited by 62
Parborell, F., Daín, L., & Tesone, M. (2001) · Molecular Reproduction and Development · doi:10.1002/mrd.1084 · Cited by 37
Luo, X., Xi, T., Guo, S., Liu, Z., Wang, N., Jiang, Y., & Zhang, T. (2009) · IUBMB Life · doi:10.1002/iub.216 · Cited by 36
Self-citationCarr, D. W., Cutler, R. E., Cottom, J. E., Salvador, L., Fraser, I. D. C., Scott, J. D., & Hunzicker-Dunn, M. E. (1999) · Biochemical Journal · doi:10.1042/0264-6021:3440613 · Cited by 36
Carr, D. W., Cutler, R. E., Cottom, J. E., et al. (1999) · Biochemical Journal · doi:10.1042/bj3440613 · Cited by 23
Rescue from dominant follicle atresia by follicle-stimulating hormone in mice
Zhou, X., Teng, Y., Cao, R., Fu, H., Xiong, K., Sun, W. X., Zhu, C. C., Huang, X., Xiao, P., & Liu, H. (2013) · Genetics and Molecular Research · doi:10.4238/2013.august.12.10 · Cited by 13
Self-citationDhanasekaran, N., & Moudgal, N. R. (1986) · Molecular and Cellular Endocrinology · doi:10.1016/0303-7207(86)90108-5 · Cited by 9
L'apoptose des cellules folliculaires : son implication dans les protocoles de stimulation ovarienne
Maillet, G., Féral, C., & Benhaïm, A. (2005) · Gynécologie Obstétrique & Fertilité · doi:10.1016/j.gyobfe.2005.06.016 · Cited by 8
Cited by
Sorted by citations
Shen, M., Jiang, Y., Guan, Z., Cao, Y., Li, L., Liu, H., & Sun, S. (2017) · Autophagy · doi:10.1080/15548627.2017.1327941 · Cited by 219
Self-citationGranulosa Cell Apoptosis in the Ovarian Follicle—A Changing View
Regan, S. L. P., Knight, P. G., Yovich, J. L., Leung, Y. C., Arfuso, F., & Dharmarajan, A. (2018) · Frontiers in Endocrinology · doi:10.3389/fendo.2018.00061 · Cited by 217
miR-181a increases FoxO1 acetylation and promotes granulosa cell apoptosis via SIRT1 downregulation
Zhang, M., Zhang, Q., Hu, Y., Xu, L., Jiang, Y., Zhang, C., Ding, L., Jiang, R., Sun, J., Sun, H., et al. (2017) · Cell Death and Disease · doi:10.1038/cddis.2017.467 · Cited by 169
Shen, M., Cao, Y., Jiang, Y., Wei, Y., & Liu, H. (2018) · Redox Biology · doi:10.1016/j.redox.2018.07.004 · Cited by 161
Self-citationThe role of FSH and TGF-β superfamily in follicle atresia
Chu, Y., Xu, Y., Yang, W.-X., & Sun, Y. (2018) · Aging · doi:10.18632/aging.101391 · Cited by 107
Metadata
- Authors
- Shen, M., Liu, Z., Li, B., Teng, Y., Zhang, J., Tang, Y., Sun, S.-C., & Liu, H.
- Affiliations
- Nanjing Agricultural University (CN)
- Chinese Academy of Agricultural Sciences (CN)
- Corresponding author
- Sun, S-C
- Liu, H
- Venue
- Cell Death & Disease
- Published
- 2014-10-16
- Volume
- 5
- Issue
- 10
- Pages
- e1475-e1475
- ISSN
- 2041-4889 (ISSN-L)
- PMC
- PMC4237239
- OpenAlex
- W2071278611
- Cited by
- 123
- References
- 66
- Citations by year
- 2026: 7 · 2025: 16 · 2024: 17 · 2023: 11 · 2022: 12 · 2021: 13 · 2020: 14 · 2019: 4 · 2018: 9 · 2017: 10 · 2016: 6 · 2015: 4
- FWCI
- 6.60
- Type
- journal article
- Language
- en
- Open access
- gold
- doi.org
- Locations
- Cell Death and Disease (publishedVersion, cc-by)
- PubMed Central (publishedVersion, cc-by)
- PubMed (publishedVersion)
- Funders
- National Key Research and Development Program of China (2014CB138502)
- Topics
- Health Sciences › Medicine › Reproductive Medicine › Reproductive Biology and Fertility
- Life Sciences › Biochemistry, Genetics and Molecular Biology › Molecular Biology › FOXO transcription factor regulation
- Health Sciences › Medicine › Reproductive Medicine › Ovarian function and disorders
- Keywords
- FOXO1, follicle-stimulating hormone, granulosa cells, apoptosis, follicular atresia, positive feedback loop
- MeSH terms
- Forkhead Box Protein O1, Animals, Base Sequence, Cell Survival, Cells, Cultured, Female, Follicle Stimulating Hormone, Granulosa Cells, Mice, Inbred ICR, Molecular Sequence Data, Protein Binding, Signal Transduction, Down-Regulation, Apoptosis, Cyclic AMP-Dependent Protein Kinases, Cytoprotection, Phosphatidylinositol 3-Kinases, Proto-Oncogene Proteins c-akt, Forkhead Transcription Factors
About these checks
Registry, retraction, Cites and statistics results are computed, not judged, with one exception: a printed reference that no index lists is read once by a model before it counts as a citation error. Claims are extracted by a model and kept only when their quote appears verbatim in the text; each cited source is then checked, with a model’s help, for whether it says what the claim relies on. Those verdicts can be wrong — read the claim’s quote and the cited source before relying on one.
Statistics and arithmetic are recomputed, not judged.
Confidence bands are shown only for fields calibrated on our annotated test set. None is calibrated yet, so no band is shown.
What counts as a claim ›How we measure confidence ›How we check this ›
Are you an author, or do you see a problem with this page? Request a review
