Cited by 137

The DOI matches its Crossref record.

MiR-485-3p and miR-485-5p suppress breast cancer cell metastasis by inhibiting PGC-1α expression

Lou, C, Xiao, M, Cheng, S, Lu, X, Jia, S, Ren, Y, Li, Z·2016·Cell Death & Disease

Abstract

Breast cancer is the worldwide leading cause of cancer mortality in women. The majority of deaths from breast cancer arise from metastasis of local tumors. Cancer cells support their rapid proliferation by diverting metabolites into anabolic pathways, but during cancer metastasis, the proliferative program of invasive cancer cells is suspended for a migratory phenotype. In this study, we demonstrated that both mature forms of miRNA-485, miR-485-3p and miR-485-5p were involved in regulating mitochondrial respiration, cell migration and cell invasion in breast cancer cells by directly targeting and inhibiting the expression of PGC-1 α. Specifically, the expression levels of both miR-485-3p and miR-485-5p were decreased in breast cancer tissues. Overexpression of miR-485-3p and miR-485-5p suppressed mitochondrial respiration and potential for cell migration and invasion in vitro, and also inhibited spontaneous metastasis of breast cancer cells in vivo. The suppression of mitochondrial respiration and cell invasion could be partially relieved by restoration of PGC-1 α expression.

Overview

The claims and statistics of this paper haven’t been checked yet.

Run the check — free, no account needed. It reads the open-access text and checks the sources it cites.

A few free checks a day · papers already verified open instantly · results are public

Integrity signals

Registry

Crossref · 10.1038/cddis.2016.27

Cites

Statistics

Figures

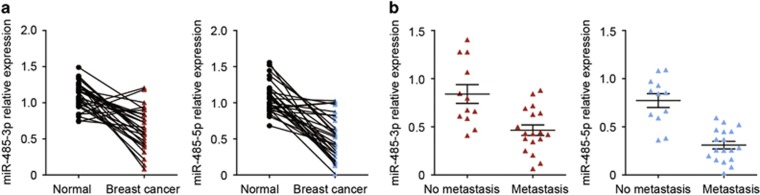
Figure 1 The expression of miR-485-3p and miR-485-5p is downregulated in breast cancer tissues. (a) The expression levels of miR-485-3p and miR-485-5p in cancer tissues compared with adjacent normal tissues in 30 breast cancer patients, P<0.001 by paired t-test. (b) The expression levels of miR-485-3p and miR-485-5p in breast cancer tissues with and without lymph node metastasis, P<0.001 by t-test
Figure 1 The expression of miR-485-3p and miR-485-5p is downregulated in breast cancer tissues. (a) The expression levels of miR-485-3p and miR-485-5p in cancer tissues compared with adjacent normal tissues in 30 breast cancer patients, P<0.001 by paired t-test. (b) The expression levels of miR-485-3p and miR-485-5p in breast cancer tissues with and without lymph node metastasis, P<0.001 by t-testCC BY · PubMed Central
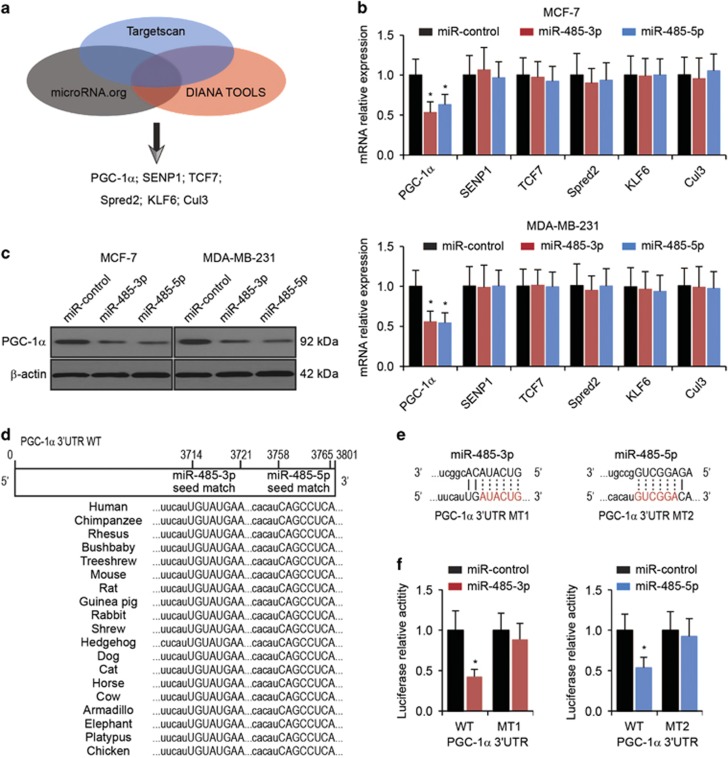
Figure 2 PGC-1α is a direct target of miR-485-3p and miR-485-5p. (a) Six predicted target genes (PGC-1α, SENP1, TCF7, Spred2, KLF6 and Cul3) of miR-485-3p and miR-485-5p by Targetscan, microRNA.org and DIANA TOOLS. (b) The expression levels of predicted target genes in MCF-7 and MDA-MB-231 cells with transfection of miR-control, miR-485-3p or miR-485-5p. β-Actin was used as an internal control. *P<0.05 by one-way ANOVA compared with miR-control-transfected cells. (c) Western blot analysis of PGC-1α in MCF-7 and MDA-MB-231 cells transfected with miR-control, miR-485-3p or miR-485-5p. β-Actin was used as loading control. *P<0.05 by one-way ANOVA compared with miR-control-transfected cells. (d) Schematic representation of the wild-type PGC-1α 3′-UTR (WT) showing putative miR-485-3p and miR-485-5p target sites. (e) Mutations of predicted binding sites of miR-485-3p (MT1) or miR-485-5p (MT2) in the PGC-1α 3′-UTR. (f) Relative luciferase activity in HEK293T cells co-transfected with WT or MT reporter plasmid and miR-control, miR-485-3p or miR-485-5p. *P<0.05 by t-test compared with miR-control-transfected cells
Figure 2 PGC-1α is a direct target of miR-485-3p and miR-485-5p. (a) Six predicted target genes (PGC-1α, SENP1, TCF7, Spred2, KLF6 and Cul3) of miR-485-3p and miR-485-5p by Targetscan, microRNA.org and DIANA TOOLS. (b) The expression levels of predicted target genes in MCF-7 and MDA-MB-231 cells with transfection of miR-control, miR-485-3p or miR-485-5p. β-Actin was used as an internal control. *P<0.05 by one-way ANOVA compared with miR-control-transfected cells. (c) Western blot analysis of PGC-1α in MCF-7 and MDA-MB-231 cells transfected with miR-control, miR-485-3p or miR-485-5p. β-Actin was used as loading control. *P<0.05 by one-way ANOVA compared with miR-control-transfected cells. (d) Schematic representation of the wild-type PGC-1α 3′-UTR (WT) showing putative miR-485-3p and miR-485-5p target sites. (e) Mutations of predicted binding sites of miR-485-3p (MT1) or miR-485-5p (MT2) in the PGC-1α 3′-UTR. (f) Relative luciferase activity in HEK293T cells co-transfected with WT or MT reporter plasmid and miR-control, miR-485-3p or miR-485-5p. *P<0.05 by t-test compared with miR-control-transfected cellsCC BY · PubMed Central
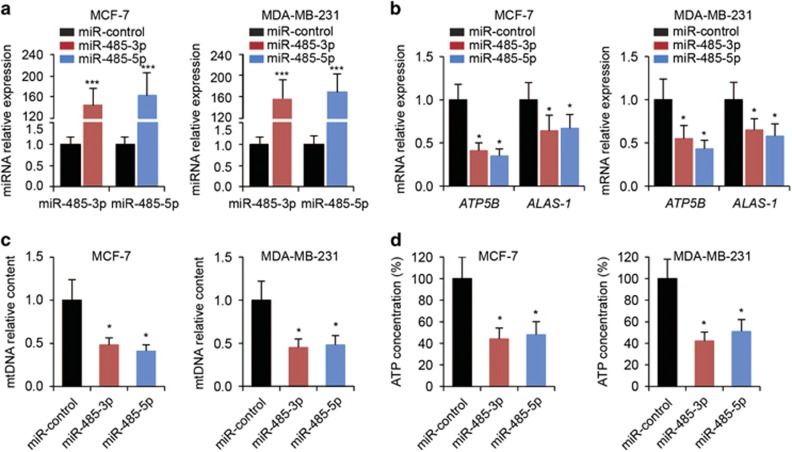
Figure 3 Reduction of mitochondrial respiration in breast cancer cells by miR-485-3p and miR-485-5p. (a) The expression levels of miR-485-3p or miR-485-5p in MCF-7 and MDA-MB-231 cells transfected with miR-control, miR-485-3p or miR-485-5p. ***P<0.001 by t-test compared with miR-control-transfected cells. (b) The expression levels of ATP5B and ALAS-1 in MCF-7 and MDA-MB-231 cells transfected with miR-control, miR-485-3p or miR-485-5p. (c) Relative mtDNA content and (d) ATP concentrations in MCF-7 and MDA-MB-231 cells transfected with miR-control, miR-485-3p or miR-485-5p. *P<0.05 by one-way ANOVA compared with miR-control-transfected cells
Figure 3 Reduction of mitochondrial respiration in breast cancer cells by miR-485-3p and miR-485-5p. (a) The expression levels of miR-485-3p or miR-485-5p in MCF-7 and MDA-MB-231 cells transfected with miR-control, miR-485-3p or miR-485-5p. ***P<0.001 by t-test compared with miR-control-transfected cells. (b) The expression levels of ATP5B and ALAS-1 in MCF-7 and MDA-MB-231 cells transfected with miR-control, miR-485-3p or miR-485-5p. (c) Relative mtDNA content and (d) ATP concentrations in MCF-7 and MDA-MB-231 cells transfected with miR-control, miR-485-3p or miR-485-5p. *P<0.05 by one-way ANOVA compared with miR-control-transfected cellsCC BY · PubMed Central
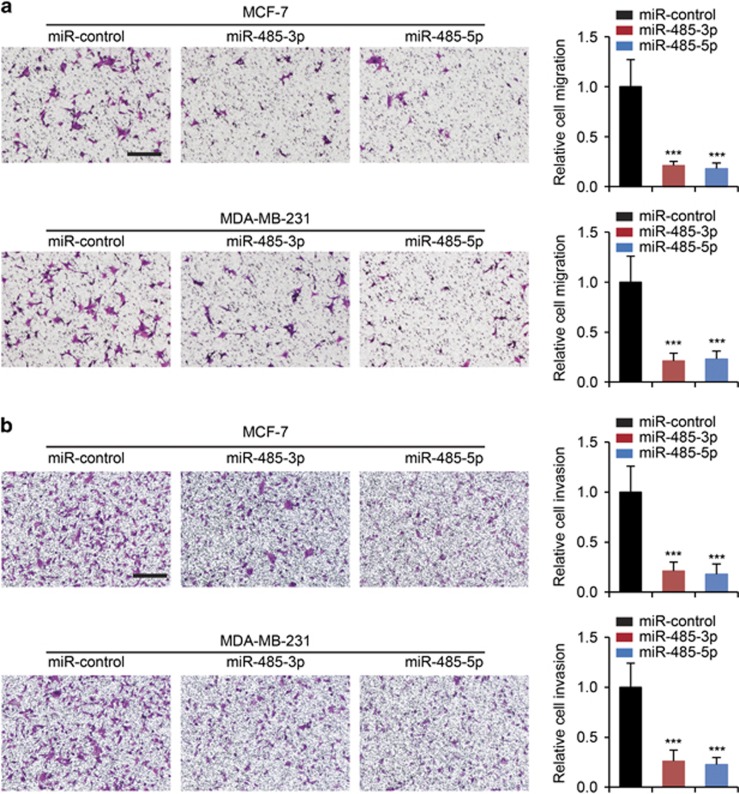
Figure 4 Inhibition of breast cancer cell migration and invasion by miR-485-3p and miR-485-5p. (a) Migration and (b) invasion assays in MCF-7 and MDA-MB-231 cells transfected with miR-control, miR-485-3p or miR-485-5p. Scale bars: 100 μm. Cell migration and invasion results were normalized by cell proliferation results under the same treatment conditions. ***P<0.01 by one-way ANOVA compared with miR-control-transfected cells
Figure 4 Inhibition of breast cancer cell migration and invasion by miR-485-3p and miR-485-5p. (a) Migration and (b) invasion assays in MCF-7 and MDA-MB-231 cells transfected with miR-control, miR-485-3p or miR-485-5p. Scale bars: 100 μm. Cell migration and invasion results were normalized by cell proliferation results under the same treatment conditions. ***P<0.01 by one-way ANOVA compared with miR-control-transfected cellsCC BY · PubMed Central
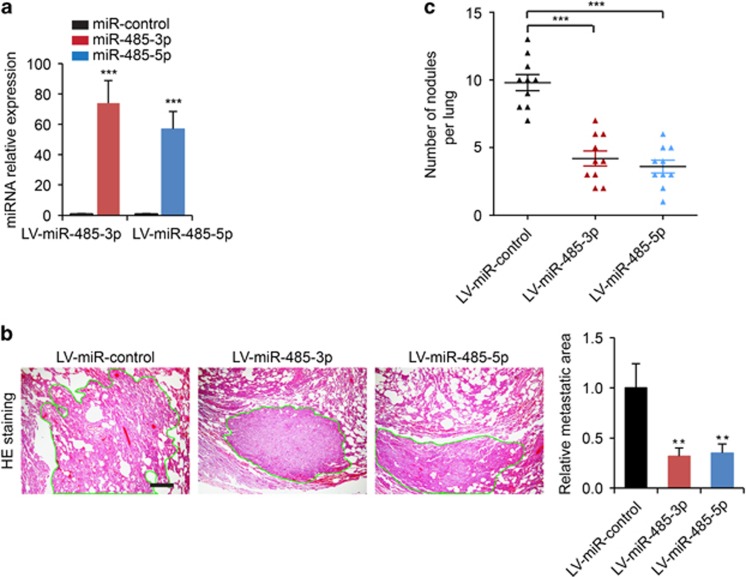
Figure 5 Inhibition of spontaneous lung metastatic capabilities of breast cancer cells by miR-485-3p and miR-485-5p. (a) The expression levels of miR-485-3p or miR-485-5p in MDA-MB-231 cells transduced with LV-miR-control, LV-miR-485-3p or LV-miR-485-5p. (b) Representative photos of H&E staining of lung tissue sections from mice subjected to tail vein injection of MDA-MB-231 cells stably expressing miR-control (LV-miR-control), miR-485-3p (LV-miR-485-3p) or miR-485-5p (LV-miR-485-5p), and quantification of relative metastatic lung surface area. (c) The quantification of metastatic nodules in lungs from mice subjected to tail vein injection of MDA-MB-231 cells stably expressing miR-control (LV-miR-control), miR-485-3p (LV-miR-485-3p) or miR-485-5p (LV-miR-485-5p). Scale bars: 200 μm. **P<0.05, ***P<0.001 by one-way ANOVA compared with the LV-miR control group
Figure 5 Inhibition of spontaneous lung metastatic capabilities of breast cancer cells by miR-485-3p and miR-485-5p. (a) The expression levels of miR-485-3p or miR-485-5p in MDA-MB-231 cells transduced with LV-miR-control, LV-miR-485-3p or LV-miR-485-5p. (b) Representative photos of H&E staining of lung tissue sections from mice subjected to tail vein injection of MDA-MB-231 cells stably expressing miR-control (LV-miR-control), miR-485-3p (LV-miR-485-3p) or miR-485-5p (LV-miR-485-5p), and quantification of relative metastatic lung surface area. (c) The quantification of metastatic nodules in lungs from mice subjected to tail vein injection of MDA-MB-231 cells stably expressing miR-control (LV-miR-control), miR-485-3p (LV-miR-485-3p) or miR-485-5p (LV-miR-485-5p). Scale bars: 200 μm. **P<0.05, ***P<0.001 by one-way ANOVA compared with the LV-miR control groupCC BY · PubMed Central
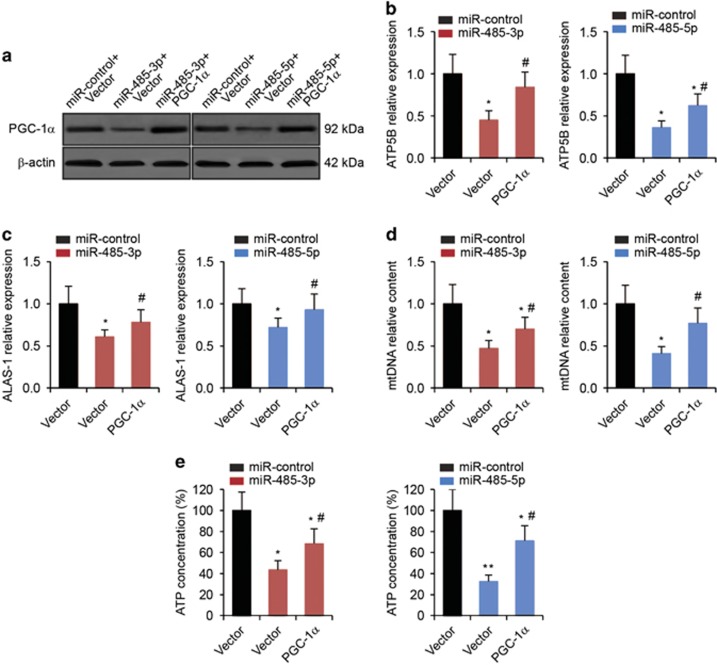
Figure 6 Restoration of PGC-1α reverses the suppression of mitochondrial respiration induced by miR-485-3p and miR-485-5p. (a) Western blot analysis in MCF-7 cells co-transfected miR-485-3p or miR-485-5p with either empty vector or PGC-1α plasmid. (b) The expression levels of ATP5B and (c) ALAS-1 in MCF-7 cells as determined by qRT-PCR analysis. (d) Relative mtDNA content and (e) ATP concentrations in MCF-7 cells. *P<0.05, **P<0.01 compared with miR-control-transfected and empty vector-transfected cells by one-way ANOVA. #P<0.05 compared with miRNA-transfected and empty vector-transfected cells by one-way ANOVA
Figure 6 Restoration of PGC-1α reverses the suppression of mitochondrial respiration induced by miR-485-3p and miR-485-5p. (a) Western blot analysis in MCF-7 cells co-transfected miR-485-3p or miR-485-5p with either empty vector or PGC-1α plasmid. (b) The expression levels of ATP5B and (c) ALAS-1 in MCF-7 cells as determined by qRT-PCR analysis. (d) Relative mtDNA content and (e) ATP concentrations in MCF-7 cells. *P<0.05, **P<0.01 compared with miR-control-transfected and empty vector-transfected cells by one-way ANOVA. #P<0.05 compared with miRNA-transfected and empty vector-transfected cells by one-way ANOVACC BY · PubMed Central
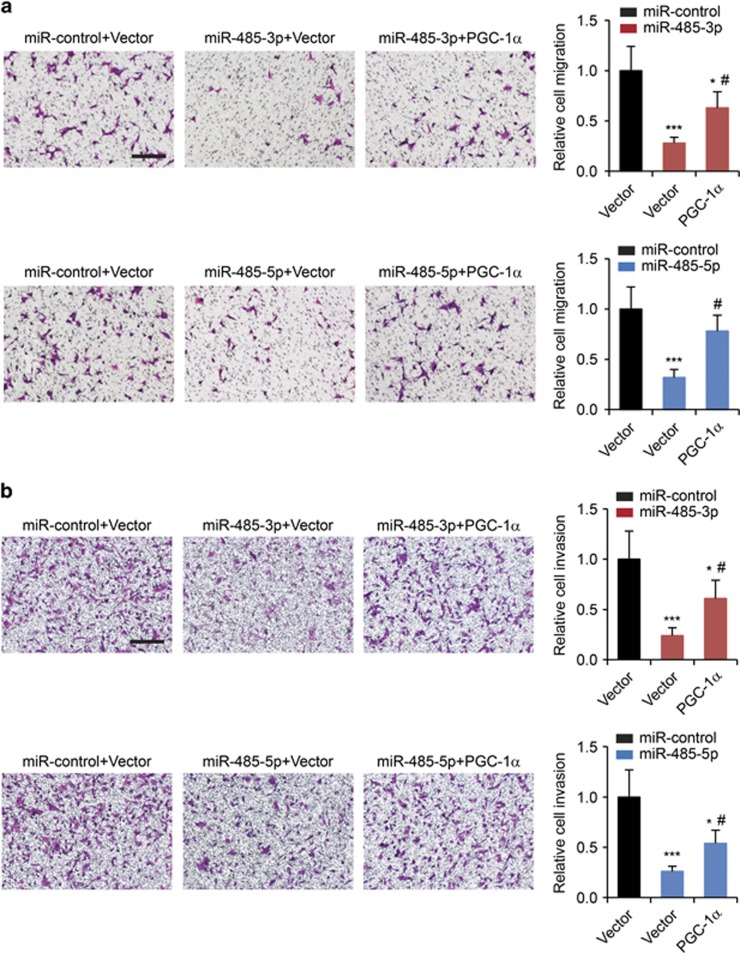
Figure 7 Restoration of PGC-1α relieves the inhibition of breast cancer cell migration and invasion induced by miR-485-3p and miR-485-5. (a) Migration and (b) invasion assays in MCF-7 cells co-transfected miR-485-3p or miR-485-5p with either empty vector or PGC-1α plasmid. Scale bars: 100 μm. Cell migration and invasion results were normalized by cell proliferation results under the same treatment conditions. *P<0.05, ***P<0.001 compared with miR-control-transfected and empty vector-transfected cells by one-way ANOVA. #P<0.05 compared with miRNA-transfected and empty vector-transfected cells by one-way ANOVA
Figure 7 Restoration of PGC-1α relieves the inhibition of breast cancer cell migration and invasion induced by miR-485-3p and miR-485-5. (a) Migration and (b) invasion assays in MCF-7 cells co-transfected miR-485-3p or miR-485-5p with either empty vector or PGC-1α plasmid. Scale bars: 100 μm. Cell migration and invasion results were normalized by cell proliferation results under the same treatment conditions. *P<0.05, ***P<0.001 compared with miR-control-transfected and empty vector-transfected cells by one-way ANOVA. #P<0.05 compared with miRNA-transfected and empty vector-transfected cells by one-way ANOVACC BY · PubMed Central

Verification

Claims the paper makes

The claims and statistics of this paper haven’t been checked yet.

Run the check — free, no account needed. It reads the open-access text and checks the sources it cites.

A few free checks a day · papers already verified open instantly · results are public

Claims other papers make about this one

Each is checked against this paper’s own text: does it say what the citing paper says it does?

Self-check

Percentages, sums and reported differences re-computed from the paper’s own numbers.

The self-check needs the paper’s full text.

Citations

Cites

No references could be resolved yet.

Research works printed but not linked: 23

  1. Jemal A, Bray F, Center MM, Ferlay J, Ward E, Forman D . Global cancer statistics. CA Cancer J Clin 2011; 61: 69–90. · DOI
  2. Scully OJ, Bay BH, Yip G, Yu Y . Breast cancer metastasis. Cancer Genomics Proteomics 2012; 9: 311–320.
  3. Vander Heiden MG, Cantley LC, Thompson CB . Understanding the Warburg effect: the metabolic requirements of cell proliferation. Science 2009; 324: 1029–1033. · DOI · Paper page
  4. Warburg O . On the origin of cancer cells. Science 1956; 123: 309–314. · DOI · Paper page
  5. Locasale JW, Cantley LC . Metabolic flux and the regulation of mammalian cell growth. Cell Metab 2011; 14: 443–451. · DOI · Paper page
  6. LeBleu VS, O'Connell JT, Gonzalez Herrera KN, Wikman H, Pantel K, Haigis MC et al. PGC-1alpha mediates mitochondrial biogenesis and oxidative phosphorylation in cancer cells to promote metastasis. Nat Cell Biol 2014; 16: 1001–1015.
  7. Bertoli G, Cava C, Castiglioni I . MicroRNAs: new biomarkers for diagnosis, prognosis, therapy prediction and therapeutic tools for breast cancer. Theranostics 2015; 5: 1122–1143. · DOI
  8. Winter J, Jung S, Keller S, Gregory RI, Diederichs S . Many roads to maturity: microRNA biogenesis pathways and their regulation. Nat Cell Biol 2009; 11: 228–234. · DOI
  9. Calin GA, Croce CM . MicroRNA signatures in human cancers. Nat Rev Cancer 2006; 6: 857–866. · DOI
  10. Liu YN, Yin J, Barrett B, Sheppard-Tillman H, Li D, Casey OM et al. Loss of androgen-regulated microRNA 1 activates SRC and promotes prostate cancer bone metastasis. Mol Cell Biol 2015; 35: 1940–1951. · DOI
  11. Zhang Q, Tang Q, Qin D, Yu L, Huang R, Lv G et al. Role of microRNA 30a targeting insulin receptor substrate 2 in colorectal tumorigenesis. Mol Cell Biol 2015; 35: 988–1000. · DOI
  12. Li X, Gong X, Chen J, Zhang J, Sun J, Guo M . miR-340 inhibits glioblastoma cell proliferation by suppressing CDK6, cyclin-D1 and cyclin-D2. Biochem Biophys Res Commun 2015; 460: 670–677. · DOI
  13. Labbaye C, Testa U . The emerging role of MIR-146 A in the control of hematopoiesis, immune function and cancer. J Hematol Oncol 2012; 5: 13. · DOI · Paper page
  14. Anaya-Ruiz M, Bandala C, Perez-Santos JL . miR-485 acts as a tumor suppressor by inhibiting cell growth and migration in breast carcinoma T47D cells. Asian Pac J Cancer Prev 2013; 14: 3757–3760. · DOI
  15. Ambros V . microRNAs: tiny regulators with great potential. Cell 2001; 107: 823–826. · DOI
  16. Shao D, Liu Y, Liu X, Zhu L, Cui Y, Cui A et al. PGC-1 beta-regulated mitochondrial biogenesis and function in myotubes is mediated by NRF-1 and ERR alpha. Mitochondrion 2010; 10: 516–527. · DOI
  17. Zhou J, Tian Y, Li J, Lu B, Sun M, Zou Y et al. miR-206 is down-regulated in breast cancer and inhibits cell proliferation through the up-regulation of cyclinD2. Biochem Biophys Res Commun 2013; 433: 207–212. · DOI
  18. Li LZ, Zhang CZ, Liu LL, Yi C, Lu SX, Zhou X et al. miR-720 inhibits tumor invasion and migration in breast cancer by targeting TWIST1. Carcinogenesis 2014; 35: 469–478. · DOI
  19. Costa FF, Bischof JM, Vanin EF, Lulla RR, Wang M, Sredni ST et al. Identification of microRNAs as potential prognostic markers in ependymoma. PloS One 2011; 6: e25114. · DOI
  20. Kim TH, Kim YK, Kwon Y, Heo JH, Kang H, Kim G et al. Deregulation of miR-519a, 153, and 485-5p and its clinicopathological relevance in ovarian epithelial tumours. Histopathology 2010; 57: 734–743. · DOI
  21. Chen CF, He X, Arslan AD, Mo YY, Reinhold WC, Pommier Y et al. Novel regulation of nuclear factor-YB by miR-485-3p affects the expression of DNA topoisomerase IIalpha and drug responsiveness. Mol Pharmacol 2011; 79: 735–741. · DOI
  22. He N, Zheng H, Li P, Zhao Y, Zhang W, Song F et al. miR-485-5p binding site SNP rs8752 in HPGD gene is associated with breast cancer risk. PloS One 2014; 9: e102093. · DOI
  23. Lieber D . Generation of a stable cell line for constitutive miRNA expression. Methods Mol Biol 2013; 1064: 183–200. · DOI

Cited by

Sorted by citations

Metadata

Authors
Lou, C., Xiao, M., Cheng, S., Lu, X., Jia, S., Ren, Y., & Li, Z.
Venue
Cell Death & Disease
Published
2016-03-24
Volume
7
Issue
3
Pages
e2159-e2159
ISSN
2041-4889
Cited by
137
References
0
Language
en

About these checks

Registry, retraction, Cites and statistics results are computed, not judged, with one exception: a printed reference that no index lists is read once by a model before it counts as a citation error. Claims are extracted by a model and kept only when their quote appears verbatim in the text; each cited source is then checked, with a model’s help, for whether it says what the claim relies on. Those verdicts can be wrong — read the claim’s quote and the cited source before relying on one.

Statistics and arithmetic are recomputed, not judged.

Confidence bands are shown only for fields calibrated on our annotated test set. None is calibrated yet, so no band is shown.

What counts as a claim ›How we measure confidence ›How we check this ›

Are you an author, or do you see a problem with this page? Request a review