

The DOI matches its Crossref record; 41 of the 41 references it cites were found in a registry or an index.
Enteric dysbiosis-linked gut barrier disruption triggers early renal injury induced by chronic high salt feeding in mice
Open accessAbstract
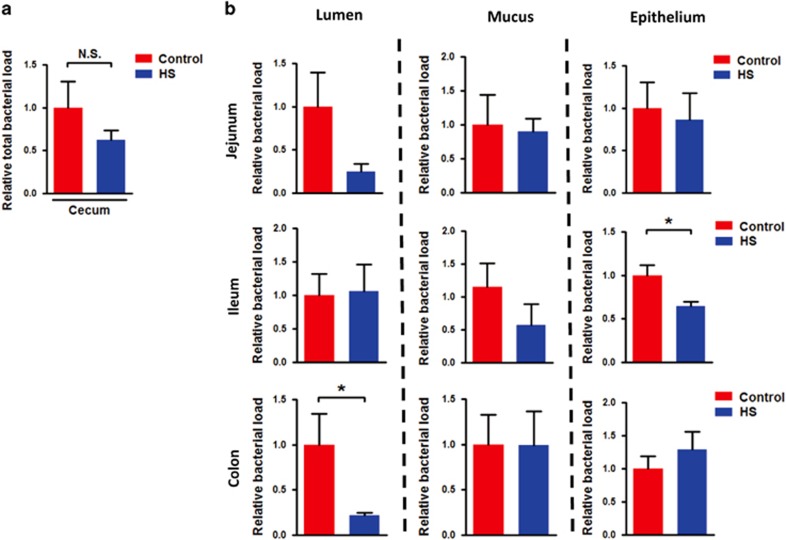
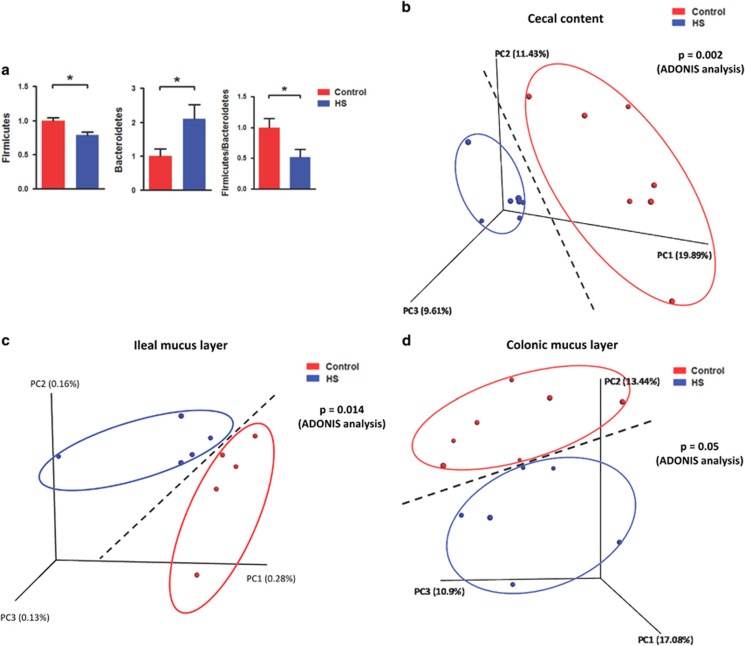
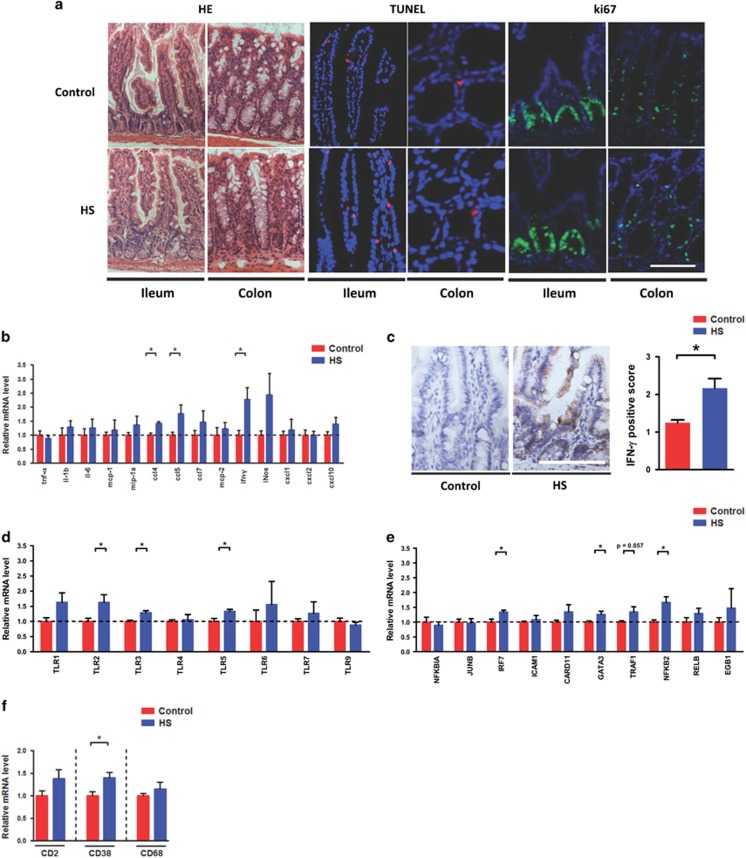
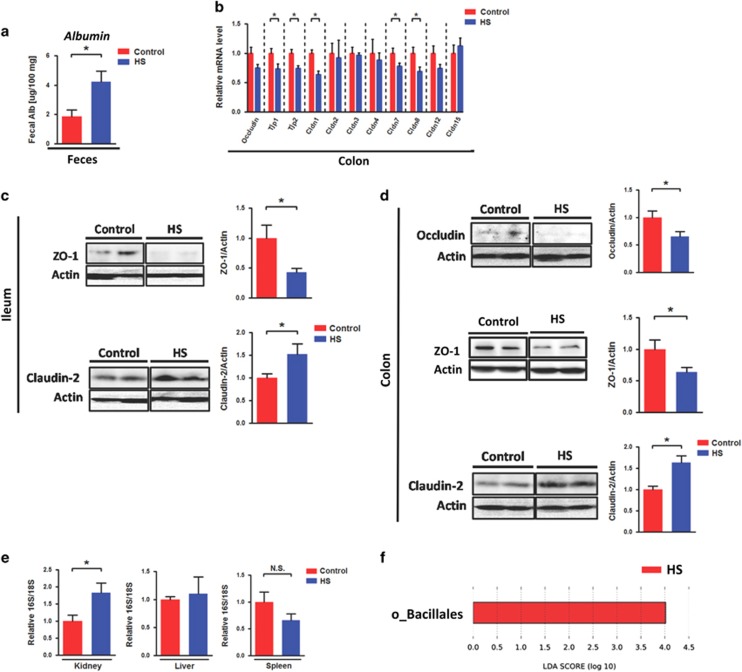
Chronic high-salt diet-associated renal injury is a key risk factor for the development of hypertension. However, the mechanism by which salt triggers kidney damage is poorly understood. Our study investigated how high salt (HS) intake triggers early renal injury by considering the ‘gut-kidney axis’. We fed mice 2% NaCl in drinking water continuously for 8 weeks to induce early renal injury. We found that the ‘quantitative’ and ‘qualitative’ levels of the intestinal microflora were significantly altered after chronic HS feeding, which indicated the occurrence of enteric dysbiosis. In addition, intestinal immunological gene expression was impaired in mice with HS intake. Gut permeability elevation and enteric bacterial translocation into the kidney were detected after chronic HS feeding. Gut bacteria depletion by non-absorbable antibiotic administration restored HS loading-induced gut leakiness, renal injury and systolic blood pressure elevation. The fecal microbiota from mice fed chronic HS could independently cause gut leakiness and renal injury. Our current work provides a novel insight into the mechanism of HS-induced renal injury by investigating the role of the intestine with enteric bacteria and gut permeability and clearly illustrates that chronic HS loading elicited renal injury and dysfunction that was dependent on the intestine. Kidney damage caused by high salt intake is triggered by microbial imbalances and impaired inflammatory responses in the gut. Peng Chen at the Southern Medical University in Guangzhou, China, and co-workers investigated how high salt intake triggers early-stage kidney damage, a key factor in the development of high blood pressure. Chen's team fed mice with high salt levels for eight weeks and found that the diversity and amount of microbial flora in the intestines changed considerably as a result. This imbalance led to the break-down of the gut barrier, the cell layer lining the gut that prevents material passing into other organs, meaning that bacteria entered the kidneys. High salt also impaired inflammatory responses and disrupted immune system gene expression. The findings may inform future treatments for high blood pressure and kidney dysfunction.
Overview
The claims and statistics of this paper haven’t been checked yet.
Run the check — free, no account needed. It reads the open-access text and checks the sources it cites.
Integrity signals
Registry
Cites
Statistics
Figures
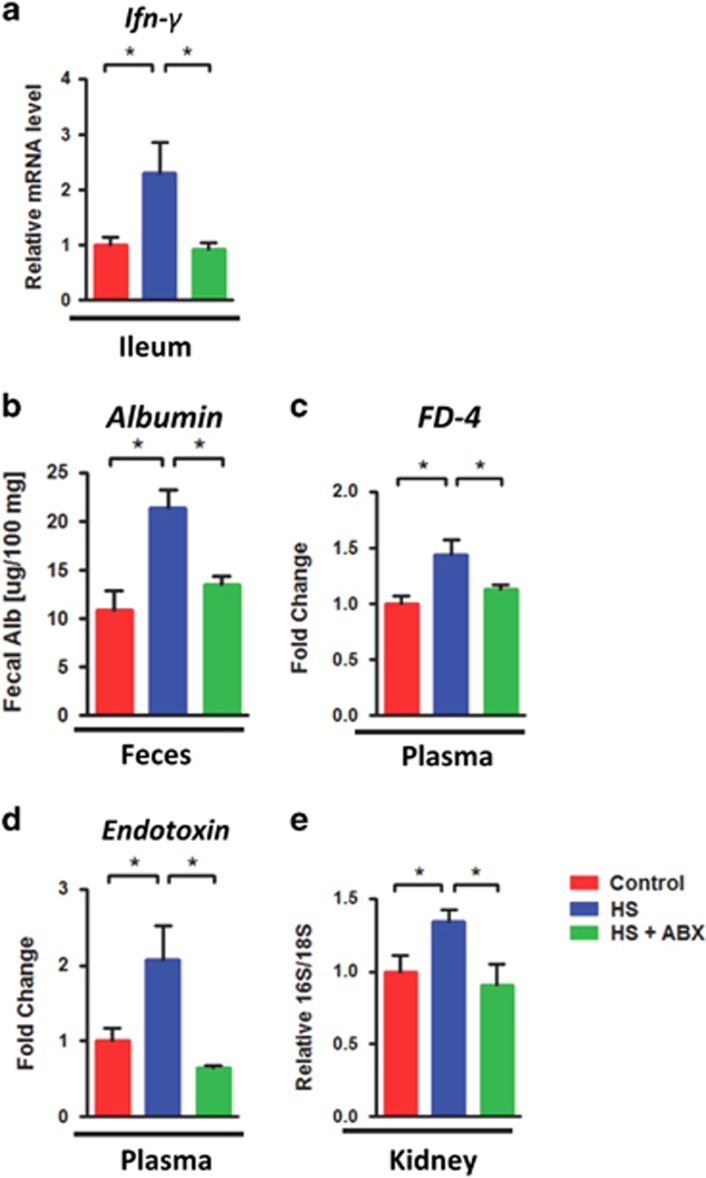
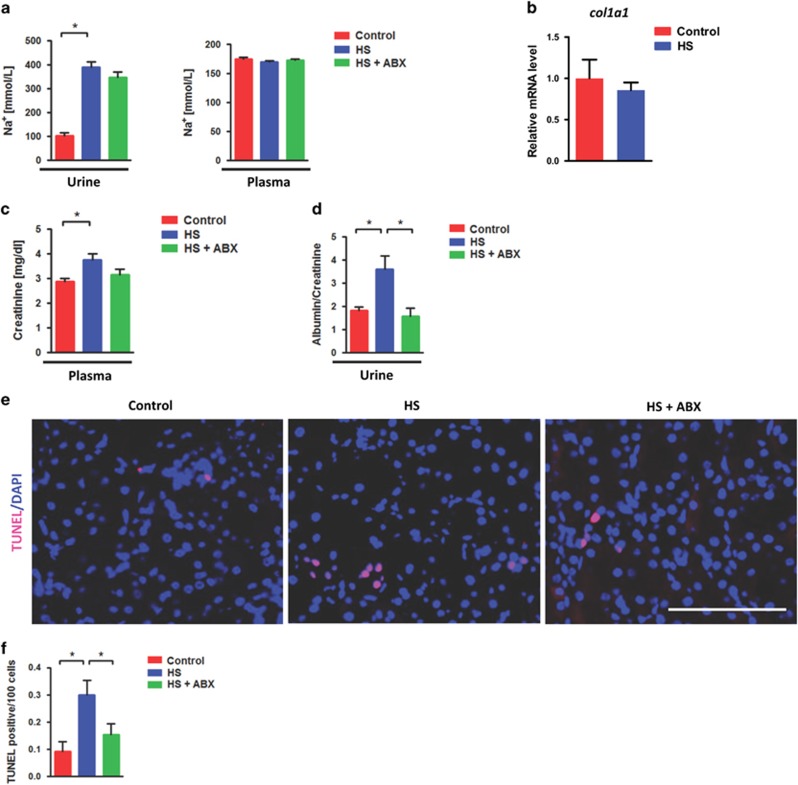
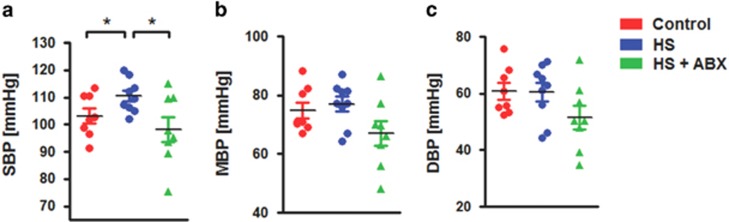
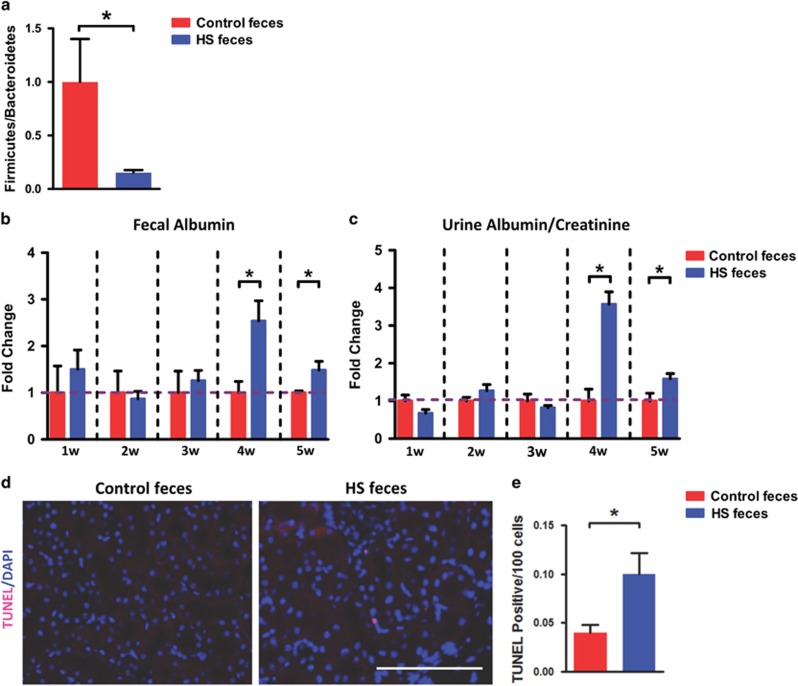
Verification
Claims the paper makes
The claims and statistics of this paper haven’t been checked yet.
Run the check — free, no account needed. It reads the open-access text and checks the sources it cites.
Claims other papers make about this one
Each is checked against this paper’s own text: does it say what the citing paper says it does?
In the citing paper
“Previous studies have indicated that susceptibility to organ injury, especially in the brain, could be modulated by the intestinal microbiota (9–11).”
From Sepsis-Induced Gut Dysbiosis Mediates the Susceptibility to Sepsis-Associated Encephalopathy in Mice (2022) · cites this paper as [10]
Self-check
Percentages, sums and reported differences re-computed from the paper’s own numbers.
The self-check needs the paper’s full text.
Citations
Cites
Mapping and quantifying mammalian transcriptomes by RNA-Seq
Mortazavi, A., Williams, B. A., McCue, K., Schaeffer, L., & Wold, B. (2008) · Nature Methods · doi:10.1038/nmeth.1226 · Cited by 13,696
Global burden of hypertension: analysis of worldwide data
Kearney, P. M., Whelton, M., Reynolds, K., Muntner, P., Whelton, P. K., & He, J. (2005) · The Lancet · doi:10.1016/s0140-6736(05)17741-1 · Cited by 8,698
A core gut microbiome in obese and lean twins
Turnbaugh, P. J., Hamady, M., Yatsunenko, T., Cantarel, B. L., Duncan, A., Ley, R. E., Sogin, M. L., Jones, W. J., Roe, B. A., Affourtit, J. P., et al. (2009) · Nature · doi:10.1038/nature07540 · Cited by 7,823
Hsiao, E. Y., McBride, S. W., Hsien, S., Sharon, G., Hyde, E. R., McCue, T., Codelli, J. A., Chow, J., Reisman, S. E., Petrosino, J. F., et al. (2013) · Cell · doi:10.1016/j.cell.2013.11.024 · Cited by 3,283
Symbiotic bacteria direct expression of an intestinal bactericidal lectin
Cash, H. L., Whitham, C. V., Behrendt, C. L., & Hooper, L. V. (2006) · Science · doi:10.1126/science.1127119 · Cited by 1,432
Comparative Analysis of Human Gut Microbiota by Barcoded Pyrosequencing
Andersson, A. F., Lindberg, M., Jakobsson, H. E., Bäckhed, F., Nyrén, P., & Engstrand, L. G. (2008) · PLoS ONE · doi:10.1371/journal.pone.0002836 · Cited by 1,079
Interactions Between the Intestinal Microbiome and Liver Diseases
Schnabl, B., & Brenner, D. A. (2014) · Gastroenterology · doi:10.1053/j.gastro.2014.01.020 · Cited by 971
Connecting dysbiosis, bile-acid dysmetabolism and gut inflammation in inflammatory bowel diseases
Duboc, H., Rajca, S., Rainteau, D., Benarous, D., Maubert, M.-A., Quervain, E., Thomas, G., Barbu, V., Humbert, L., Despras, G., et al. (2013) · Gut · doi:10.1136/gutjnl-2012-302578 · Cited by 930
Enteric dysbiosis associated with a mouse model of alcoholic liver disease
Yan, A. W., Fouts, D. E., Brandl, J., Stärkel, P., Torralba, M., Schott, E., Tsukamoto, H., Nelson, K. E., Brenner, D. A., & Schnabl, B. (2011) · Hepatology · doi:10.1002/hep.24018 · Cited by 791
Antibiotics prevent liver injury in rats following long-term exposure to ethanol
Adachi, Y., Moore, L. E., Bradford, B. U., Gao, W., & Thurman, R. G. (1995) · Gastroenterology · doi:10.1016/0016-5085(95)90027-6 · Cited by 692
Cited by
Sorted by citations
Items 101–126 of 126
Harui, A., Maruyama, S., Segawa, Y., & Kurihara, N. (2024) · Microorganisms · doi:10.3390/microorganisms12030556 · Cited by 4
Balan, Y., Sundaramurthy, R., Archana Gaur, T., Varatharajan, S., & Raj, G. M. (2024) · Journal of Family Medicine and Primary Care · doi:10.4103/jfmpc.jfmpc_1574_23 · Cited by 4
Zou, L., Yu, X., Cai, K., Xu, B., Chen, C., & Xiao, G. (2023) · International Journal of Biological Macromolecules · doi:10.1016/j.ijbiomac.2023.128265 · Cited by 4
Hu, Z., Jia, J., Su, Y., Gu, Y., Cheng, B., & Jiang, N.-H. (2025) · Frontiers in Pharmacology · doi:10.3389/fphar.2025.1578815 · Cited by 3
Gut microbiota alteration was related to subclinical hypothyroidism and dyslipidemia in mice
Wang, R., Yu, X., Cai, H., Lu, G., Gao, D., Zhang, M.-Y., Chai, L., Yi, W., & Lv, Z. (2025) · The FASEB Journal · doi:10.1096/fj.202402289rr · Cited by 3
Effects of excess sodium consumption on arterial function in C57BL/6 mice
Sabouri, M., Zheng, X., Irwin, B. J., & Machin, D. R. (2024) · American Journal of Physiology-Heart and Circulatory Physiology · doi:10.1152/ajpheart.00242.2024 · Cited by 3
Biomedical Treatment Nanomotors Based on the Intestinal Axis: Current Challenges
Zhang, L., Du, Y., Wang, W., Gao, R., Dong, Y., Wang, Q., & Tong, F. (2025) · ACS Applied Bio Materials · doi:10.1021/acsabm.5c00433 · Cited by 2
Chen, P. (2020) · Advances in experimental medicine and biology · doi:10.1007/978-981-15-2385-4_1 · Cited by 2
Self-citationJin, S., Cenier, A., Wetzel, D., Arefaine, B., Moreno‐Gonzalez, M., Stamouli, M., Mohamad, M., Lupatsii, M., Ríos, E. G., Lee, S., et al. (2025) · bioRxiv (Cold Spring Harbor Laboratory) · doi:10.1101/2025.09.23.677032 · Cited by 2
Liu, T., Xie, T., Yu, Y., Wang, T.-T., Bai, Z.-Y., Zhu, S.-Y., Niu, Y.-H., Chen, L., Xiao, Y., Wei, H., et al. (2025) · BMC Microbiology · doi:10.1186/s12866-025-04389-3 · Cited by 1
Zhao, Q., Cao, Y., Zhang, Z., Yang, Y., Wang, L., Xu, M., Mao, Y., zhang, X., Zeng, M., Yang, P., et al. (2026) · Journal of Ethnopharmacology · doi:10.1016/j.jep.2026.121380 · Cited by 1
Self-citationZhang, L., Du, Y., Dong, X., Gao, R., Wang, W., Li, X., Xiao, G., Liu, S., Xue, Y., Tassanbiyeva, A., et al. (2026) · Advanced Healthcare Materials · doi:10.1002/adhm.71639 · Cited by 1
Role of intestinal flora imbalance in formation of abdominal aortic aneurysms
Wang, X., Yu, J., Tian, C.-H., & Liang, T. (2024) · World Chinese Journal of Digestology · doi:10.11569/wcjd.v32.i12.859 · Cited by 1
Wu, P. S., Xue, J., Zhu, Z., Yu, Y., Sun, Q., Xie, M., Wang, B., Huang, P., Feng, Z., & Zhao, J. (2024) · Preprints.org · doi:10.20944/preprints202401.0241.v1 · Cited by 1
Mafra, D., & Borges, N. A. (2020) · Springer eBooks · doi:10.1007/978-3-030-44858-5_27
Secondary stone formation 8 weeks after percutaneous nephrolithotomy treatment
Deng, Q., Wang, H., Lai, Y., & Liang, H. (2021) · Medicine · doi:10.1097/md.0000000000026091
Liu, X., Yang, K., Jia, Y., Yeertai, Y., Wu, C., Wang, X., Jia, Q., Gu, Z., Cong, J., & Ling, J. (2024) · SSRN Electronic Journal · doi:10.2139/ssrn.4866928
Wang, B., Qiu, Y., Xie, M., Huang, P., Yu, Y., Sun, Q., Shangguan, W., Li, W., Zhu, Z., Xue, J., et al. (2024) · Figshare · doi:10.6084/m9.figshare.26170561
Qu, Q., Gao, H., Gao, X., Li, P., Mou, Y., Kong, X., & Tan, X. (2026) · The Journal of Nutritional Biochemistry · doi:10.1016/j.jnutbio.2026.110269
Ota, S., Yamaguchi, H., Yokoyama, S., Kusano, S., Kawase, Y., Kozai, H., & Tanaka, M. (2026) · International Archives of Allergy and Immunology · doi:10.1159/000552247
Gut Microbiota as a Mediator of Dietary Salt Effects on Blood Pressure
Verhaar, B. J. H. (2026) · International Journal of Molecular Sciences · doi:10.3390/ijms27104515
High-salt diet in macrophage-associated metabolic disorders: Mechanisms and therapeutic implications
Xiao, K., Gu, L., Ma, J. X., Rong, S.-J., 岳汹涛, Liu, Y., Liu, S., Sun, F., Zhang, S., & Wang, C. (2026) · Chinese Medical Journal · doi:10.1097/cm9.0000000000004098
Non-absorbable antibiotics worsen alcohol-associated liver disease in gastric acid-suppressed mice
Tonetti, F. R., Han, H., Fondevila, M. F., Wei, W., Özdirik, B., Bajaj, J. S., Schubert, M. L., Sikaroodi, M., Gillevet, P. M., Lang, S., et al. (2026) · Gut Microbes · doi:10.1080/19490976.2026.2694797
High‐Salt Diet Links Gut Microbiota, Intestinal Barrier Function, and Macrophage Responses
Abdulkadyrov, A., Diefenbach-Wilke, M.-L., Mass, E., & Viola, M. F. (2026) · European Journal of Immunology · doi:10.1002/eji.70234
Li, X., Liu, Z., Chen, Y., Luo, J., Xie, Z., Yang, Y., Zhou, Z., Fu, L., Yang, X., & Wu, C. (2026) · Molecular Nutrition & Food Research · doi:10.1002/mnfr.70582
Zhang, R., Chen, X., Zhang, B., Ma, M., & Shao, X. (2026) · International Journal of Biological Macromolecules · doi:10.1016/j.ijbiomac.2026.155017
Metadata
- Authors
- Hu, J., Luo, H., Wang, J., Tang, W., Lu, J., Wu, S., Xiong, Z., Yang, G., Chen, Z., Lan, T., Zhou, H., Nie, J., Jiang, Y., & Chen, P.
- Affiliations
- Southern Medical University (CN)
- Guangdong Pharmaceutical University (CN)
- Corresponding author
- Chen, Peng
- ORCID
- Venue
- Experimental & Molecular Medicine
- Published
- 2017-08
- Volume
- 49
- Issue
- 8
- Pages
- e370-e370
- ISSN
- 1226-3613 (ISSN-L)
- 2092-6413
- PMC
- PMC5579512
- OpenAlex
- W2749268425
- Cited by
- 126
- References
- 41
- Citations by year
- 2026: 11 · 2025: 16 · 2024: 24 · 2023: 15 · 2022: 18 · 2021: 16 · 2020: 12 · 2019: 9 · 2018: 5
- FWCI
- 2.90
- Type
- journal article
- Language
- en
- Open access
- gold
- doi.org
- Licence
- Locations
- Experimental & Molecular Medicine (publishedVersion, cc-by-nc-nd)
- PubMed Central (publishedVersion, cc-by-nc-nd)
- PubMed (publishedVersion)
- Funders
- Brigham and Women's Hospital
- National Natural Science Foundation of China (31500952)
- Southern Medical University
- Topics
- Life Sciences › Biochemistry, Genetics and Molecular Biology › Molecular Biology › Gut microbiota and health
- Health Sciences › Nursing › Nutrition and Dietetics › Sodium Intake and Health
- Health Sciences › Medicine › Gastroenterology › Gastrointestinal motility and disorders
- Keywords
- kidney injury, gut dysbiosis, gut-kidney axis, intestinal permeability, bacterial translocation, gut barrier disruption, fecal microbiota, hypertension, non-absorbable antibiotics, intestinal inflammation, immune gene expression
- MeSH terms
- Bacillota, Gastrointestinal Microbiome, Animals, Blood Pressure, Feces, Male, Mice, Inbred C57BL, Permeability, RNA, Time Factors, Sodium Chloride, Dietary, Gene Expression Profiling, Bacteroidetes, Gastrointestinal Tract, Mice, Acute Kidney Injury, Dysbiosis
About these checks
Registry, retraction, Cites and statistics results are computed, not judged, with one exception: a printed reference that no index lists is read once by a model before it counts as a citation error. Claims are extracted by a model and kept only when their quote appears verbatim in the text; each cited source is then checked, with a model’s help, for whether it says what the claim relies on. Those verdicts can be wrong — read the claim’s quote and the cited source before relying on one.
Statistics and arithmetic are recomputed, not judged.
Confidence bands are shown only for fields calibrated on our annotated test set. None is calibrated yet, so no band is shown.
What counts as a claim ›How we measure confidence ›How we check this ›
Are you an author, or do you see a problem with this page? Request a review
