

The DOI matches its Crossref record; 32 of the 32 references it cites were found in a registry or an index.
Landscape of genetic lesions in 944 patients with myelodysplastic syndromes
Open accessAbstract
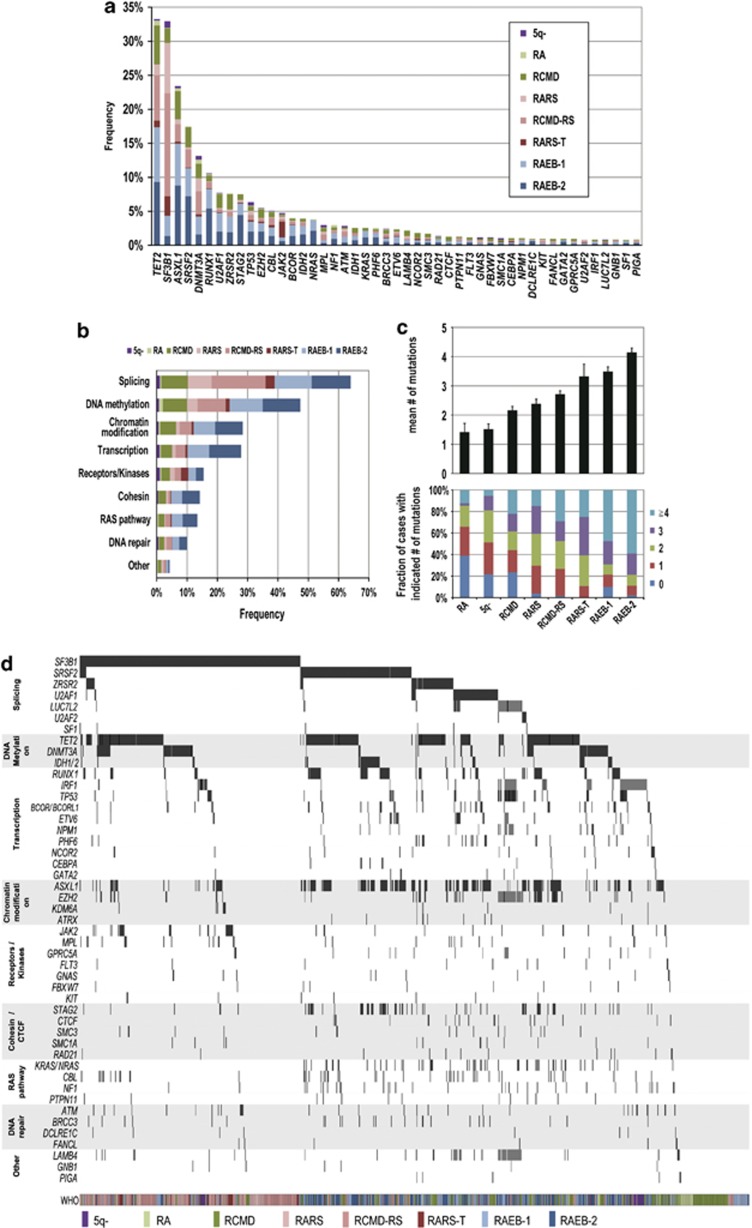
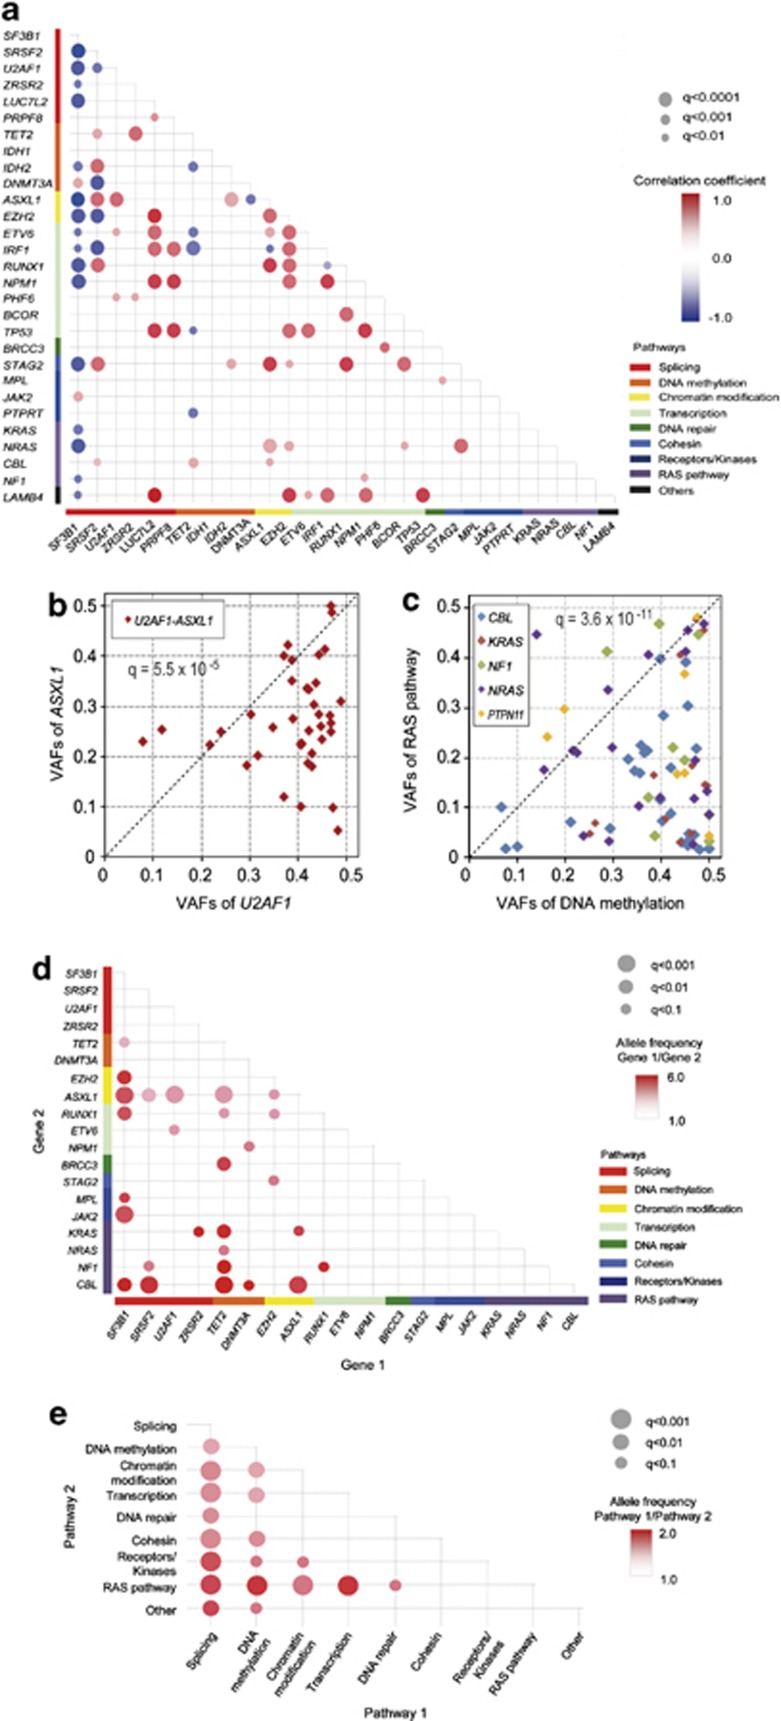
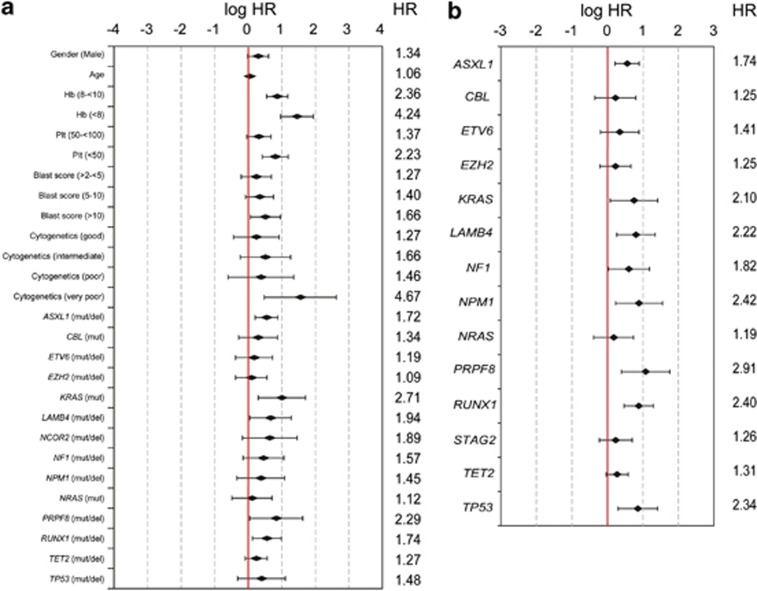
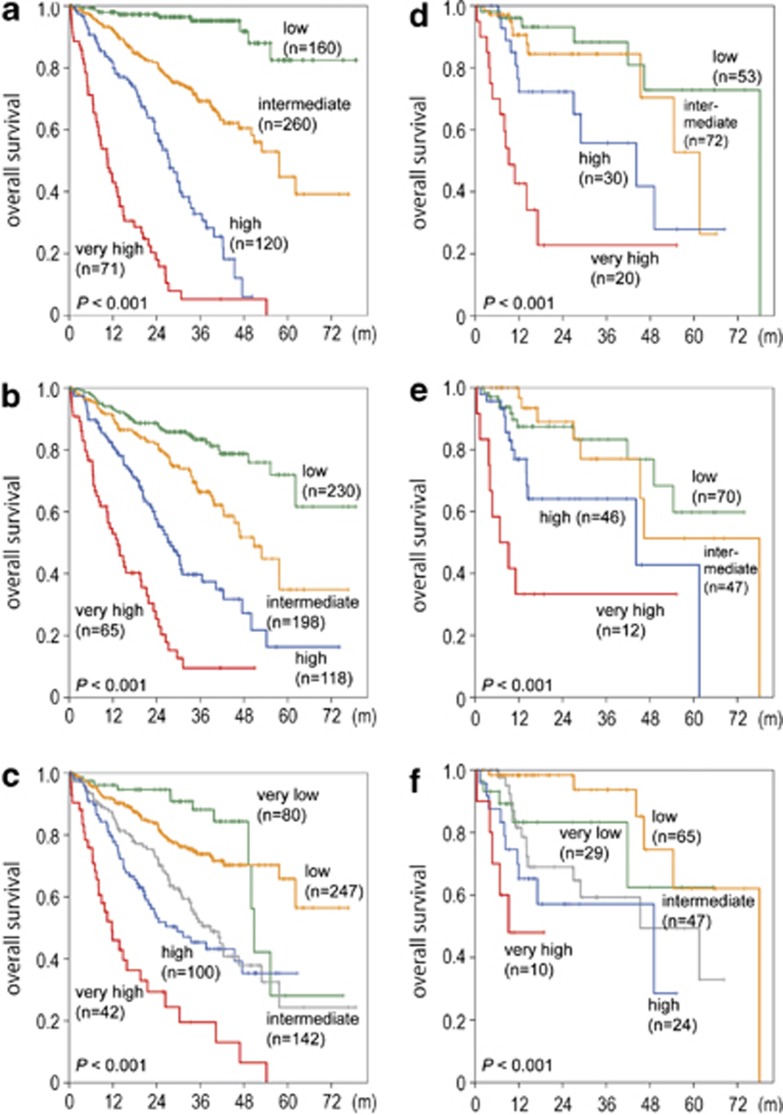
High-throughput DNA sequencing significantly contributed to diagnosis and prognostication in patients with myelodysplastic syndromes (MDS). We determined the biological and prognostic significance of genetic aberrations in MDS. In total, 944 patients with various MDS subtypes were screened for known/putative mutations/deletions in 104 genes using targeted deep sequencing and array-based genomic hybridization. In total, 845/944 patients (89.5%) harbored at least one mutation (median, 3 per patient; range, 0-12). Forty-seven genes were significantly mutated with TET2, SF3B1, ASXL1, SRSF2, DNMT3A, and RUNX1 mutated in >10% of cases. Many mutations were associated with higher risk groups and/or blast elevation. Survival was investigated in 875 patients. By univariate analysis, 25/48 genes (resulting from 47 genes tested significantly plus PRPF8) affected survival (P<0.05). The status of 14 genes combined with conventional factors revealed a novel prognostic model ('Model-1') separating patients into four risk groups ('low', 'intermediate', 'high', 'very high risk') with 3-year survival of 95.2, 69.3, 32.8, and 5.3% (P<0.001). Subsequently, a 'gene-only model' ('Model-2') was constructed based on 14 genes also yielding four significant risk groups (P<0.001). Both models were reproducible in the validation cohort (n=175 patients; P<0.001 each). Thus, large-scale genetic and molecular profiling of multiple target genes is invaluable for subclassification and prognostication in MDS patients.
Overview
The claims and statistics of this paper haven’t been checked yet.
Run the check — free, no account needed. It reads the open-access text and checks the sources it cites.
Integrity signals
Registry
Cites
Statistics
Figures
Verification
Claims the paper makes
The claims and statistics of this paper haven’t been checked yet.
Run the check — free, no account needed. It reads the open-access text and checks the sources it cites.
Claims other papers make about this one
Each is checked against this paper’s own text: does it say what the citing paper says it does?
The source backs part of the claim, not all of it — or backs it for a different population, condition or comparison.
In the citing paper
“dysregulated iron metabolism is a hallmark of a large subset of MDS with ringed sideroblasts (MDS-RS), characterized by aberrant iron accumulation in erythroblast mitochondria and accounting for ~30% of all MDS cases (42).”
From Eprenetapopt triggers ferroptosis, inhibits NFS1 cysteine desulfurase, and synergizes with serine and glycine dietary restriction (2022) · cites this paper as [42]
Experimental — accuracy not yet measuredThe source backs part of the claim, not all of it — or backs it for a different population, condition or comparison.
In the citing paper
“TP53 gene mutations are detected in approximately 10%-20% of patients with de novo myelodysplastic syndromes (MDS)1-4 or acute myeloid leukemia (AML)5,6 and 30%-40% of patients with therapy-related disease.7”
From Eprenetapopt (APR-246) and Azacitidine in TP53 -Mutant Myelodysplastic Syndromes (2021) · cites this paper as [2]
Experimental — accuracy not yet measuredThe source backs part of the claim, not all of it — or backs it for a different population, condition or comparison.
In the citing paper
“In the context of MDS, eprenetapopt is currently only indicated in ~7% of all MDS cases (42).”
From Eprenetapopt triggers ferroptosis, inhibits NFS1 cysteine desulfurase, and synergizes with serine and glycine dietary restriction (2022) · cites this paper as [42]
Experimental — accuracy not yet measuredThe source backs part of the claim, not all of it — or backs it for a different population, condition or comparison.
In the citing paper
“Splicing factor mutations are common in AMl and other blood malignancies and are often mutually exclusive (Haferlach et al. 2014;Papaemmanuil et al. 2016), indicating that cancers harboring such mutations may rely on an intact splicing machinery for survival (lee et al. 2018).”
From From serendipity to strategy: molecular glue degraders in cancer therapeutics (2025) · cites this paper as Haferlach et al. 2014
Experimental — accuracy not yet measured
Self-check
Percentages, sums and reported differences re-computed from the paper’s own numbers.
The self-check needs the paper’s full text.
Citations
Cites
Controlling the False Discovery Rate: A Practical and Powerful Approach to Multiple Testing
Benjamini, Y., & Hochberg, Y. (1995) · Journal of the Royal Statistical Society Series B: Statistical Methodology · doi:10.1111/j.2517-6161.1995.tb02031.x · Cited by 109,482
Regression shrinkage and selection via the lasso
Tibshirani, R. (1996) · Journal of the Royal Statistical Society Series B: Statistical Methodology · doi:10.1111/j.2517-6161.1996.tb02080.x · Cited by 51,482
Sequencing technologies – the next generation
Metzker, M. L. (2010) · Nature Reviews Genetics · doi:10.1038/nrg2626 · Cited by 7,066
International scoring system for evaluating prognosis in myelodysplastic syndromes
Greenberg, P., Cox, C., LeBeau, M. M., Fenaux, P., Morel, P., Sanz, G., Sanz, M., Vallespi, T., Hamblin, T., Oscier, D., et al. (1997) · Blood · doi:10.1182/blood.v89.6.2079 · Cited by 4,427
Revised International Prognostic Scoring System for Myelodysplastic Syndromes
Greenberg, P. L., Tuechler, H., Schanz, J., Sanz, G. F., Garcia‐Manero, G., Solé, F. G., Bennett, J. M., Bowen, D., Fenaux, P., Dreyfus, F., et al. (2012) · Blood · doi:10.1182/blood-2012-03-420489 · Cited by 3,224
Frequent pathway mutations of splicing machinery in myelodysplasia
Yoshida, K., Sanada, M., Shiraishi, Y., Nowak, D., Nagata, Y., Yamamoto, R., Sato, Y., Sato-Otsubo, A., Kon, A., Nagasaki, M., et al. (2011) · Nature · doi:10.1038/nature10496 · Cited by 2,029
Self-citationDNMT3A Mutations in Acute Myeloid Leukemia
Ley, T. J., Ding, L., Walter, M. J., McLellan, M. D., Lamprecht, T., Larson, D. E., Kandoth, C., Payton, J. E., Baty, J., Welch, J., et al. (2010) · New England Journal of Medicine · doi:10.1056/nejmoa1005143 · Cited by 1,983
Clinical and biological implications of driver mutations in myelodysplastic syndromes
Papaemmanuil, E., Gerstung, M., Malcovati, L., Tauro, S., Gundem, G., Van Loo, P., Yoon, C. J., Ellis, P., Wedge, D. C., Pellagatti, A., et al. (2013) · Blood · doi:10.1182/blood-2013-08-518886 · Cited by 1,832
Mutation in TET2 in Myeloid Cancers
Delhommeau, F., Dupont, S., Valle, V. D., James, C., Trannoy, S., Massé, A., Kosmider, O., Le Couedic, J.-P., Robert, F., Alberdi, A., et al. (2009) · New England Journal of Medicine · doi:10.1056/nejmoa0810069 · Cited by 1,776
Several Tests for Model Specification in the Presence of Alternative Hypotheses
Davidson, R., & MacKinnon, J. G. (1981) · Econometrica · doi:10.2307/1911522 · Cited by 1,747
Research works printed but not linked: 1
- Brunning RD, Bennett JM, Flandrin G, Matutes E, Head D, Vardiman J et al. Myelodysplastic syndromes. In: Jaffe ES, Harris N, Stein H, Vardiman J, eds World Health Organization of Tumors, Pathology & Genetics, Tumors of haematopoietic and lymphoid tissues. IARC Press: Lyon, France, 2001; pp 61–73.
Cited by
Sorted by citations
Arber, D. A., Orazi, A., Hasserjian, R., Thiele, J., Borowitz, M. J., Le Beau, M. M., Bloomfield, C. D., Cazzola, M., & Vardiman, J. W. (2016) · Blood · doi:10.1182/blood-2016-03-643544 · Cited by 10,119
Döhner, H., Estey, E. H., Grimwade, D. J., Amadori, S., Appelbaum, F. R., Büchner, T., Dombret, H., Ebert, B. L., Fenaux, P., Larson, R. A., et al. (2016) · Blood · doi:10.1182/blood-2016-08-733196 · Cited by 5,900
Genomic classification and prognosis in acute myeloid leukemia
Papaemmanuil, E., Gerstung, M., Bullinger, L., Gaidzik, V. I., Paschka, P., Roberts, N. D., Potter, N. E., Heuser, M., Thol, F., Bolli, N., et al. (2016) · New England Journal of Medicine · doi:10.1056/nejmoa1516192 · Cited by 4,350
Khoury, J. D., Solary, E., Abla, O., Akkari, Y., Alaggio, R., Apperley, J. F., Bejar, R., Berti, E., Busque, L., Chan, J. K. C., et al. (2022) · Leukemia · doi:10.1038/s41375-022-01613-1 · Cited by 4,274
Self-citationClonal hematopoiesis of indeterminate potential and its distinction from myelodysplastic syndromes
Steensma, D. P., Bejar, R., Jaiswal, S., Lindsley, R. C., Sekeres, M. A., Hasserjian, R. P., & Ebert, B. L. (2015) · Blood · doi:10.1182/blood-2015-03-631747 · Cited by 1,971
Metadata
- Authors
- Haferlach, T., Nagata, Y., Grossmann, V, Okuno, Y., Bacher, U., Nagae, G., Schnittger, S., Sanada, M., Kon, A., Alpermann, T., Yoshida, K., Roller, A., Nadarajah, N., Shiraishi, Y., Shiozawa, Y., Chiba, K., Tanaka, H., Koeffler, H. P., Klein, H.-U., Dugas, M., Aburatani, H., Kohlmann, A., Miyano, S., Haferlach, C., Kern, W., & Ogawa, S.
- Affiliations
- Munich Leukemia Laboratory (Germany) (DE)
- Kyoto University (JP)
- The University of Tokyo (JP)
- Research Center for Advanced Science and Technology, The University of Tokyo (JP)
- Institute of Medical Science, The University of Tokyo (JP)
- Cedars-Sinai Medical Center (US)
- University of Münster (DE)
- Corresponding author
- Haferlach, T
- Ogawa, S
- ORCID
- Venue
- Leukemia
- Published
- 2013-11-13
- Volume
- 28
- Issue
- 2
- Pages
- 241-247
- ISSN
- 0887-6924 (ISSN-L)
- 1476-5551
- PMC
- PMC3918868
- OpenAlex
- W2026134786
- Cited by
- 1,532
- References
- 32
- Citations by year
- 2026: 56 · 2025: 85 · 2024: 102 · 2023: 132 · 2022: 133 · 2021: 177 · 2020: 167 · 2019: 134 · 2018: 117 · 2017: 136 · 2016: 126 · 2015: 105 · 2014: 56 · 2013: 3
- FWCI
- 69.37
- Type
- journal article
- Language
- en
- Open access
- hybrid
- doi.org
- Licence
- cc-by-nc-sa
- www.springer.com/tdm (unspecified)
- Locations
- Leukemia (publishedVersion, cc-by-nc-sa)
- Europe PMC (PubMed Central) (publishedVersion, cc-by-nc-sa)
- PubMed Central (publishedVersion, cc-by-nc-sa)
- PubMed (publishedVersion)
- National University of Singapore (submittedVersion)
- eScholarship (California Digital Library) (submittedVersion)
- eScholarship (California Digital Library) (submittedVersion, cc-by-nc-sa)
- Funders
- U.S. Public Health Service (08C46598A)
- Japan Society for the Promotion of Science (24390242, 24659458, 21790907, 25670446, 24221011, 23249052)
- Topics
- Health Sciences › Medicine › Hematology › Acute Myeloid Leukemia Research
- Life Sciences › Biochemistry, Genetics and Molecular Biology › Cancer Research › Cancer Genomics and Diagnostics
- Life Sciences › Biochemistry, Genetics and Molecular Biology › Molecular Biology › Chromatin Remodeling and Cancer
- Keywords
- myelodysplastic syndrome, somatic mutations, prognostic model, risk stratification, TET2, SF3B1, ASXL1, SRSF2, DNMT3A, RUNX1, PRPF8, survival
- MeSH terms
- Adult, Aged, Aged, 80 and over, Female, Gene Frequency, Genetic Markers, Humans, Male, Middle Aged, Mutation, Myelodysplastic Syndromes, Prognosis, Proportional Hazards Models, Polymorphism, Single Nucleotide, Young Adult, Genetic Association Studies, High-Throughput Nucleotide Sequencing, Mutation Rate
About these checks
Registry, retraction, Cites and statistics results are computed, not judged, with one exception: a printed reference that no index lists is read once by a model before it counts as a citation error. Claims are extracted by a model and kept only when their quote appears verbatim in the text; each cited source is then checked, with a model’s help, for whether it says what the claim relies on. Those verdicts can be wrong — read the claim’s quote and the cited source before relying on one.
Statistics and arithmetic are recomputed, not judged.
Confidence bands are shown only for fields calibrated on our annotated test set. None is calibrated yet, so no band is shown.
What counts as a claim ›How we measure confidence ›How we check this ›
Are you an author, or do you see a problem with this page? Request a review
