

The DOI matches its Crossref record; 62 of the 62 references it cites were found in a registry or an index; none of the 35 sources its claims cite is checked for support yet.
End-Cretaceous extinction in Antarctica linked to both Deccan volcanism and meteorite impact via climate change
Open accessAbstract
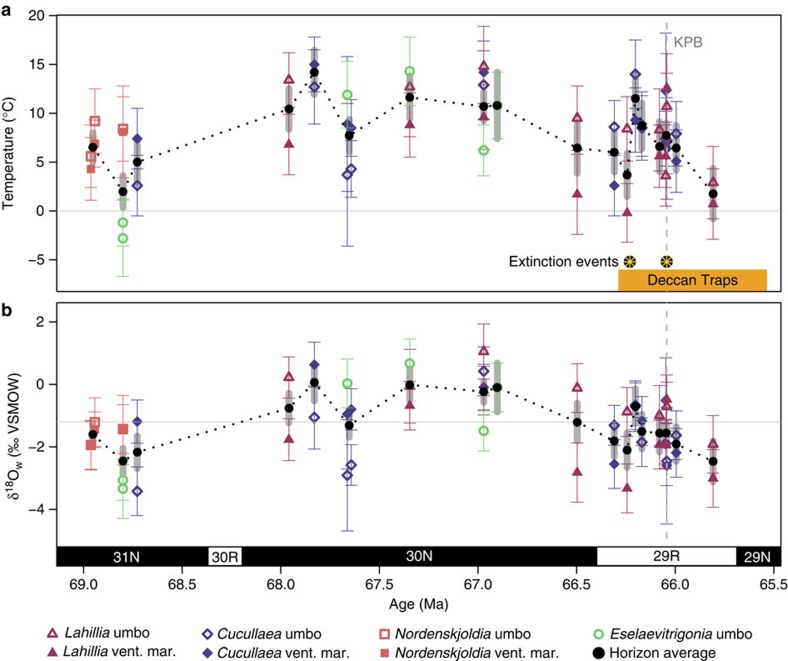
The cause of the end-Cretaceous (KPg) mass extinction is still debated due to difficulty separating the influences of two closely timed potential causal events: eruption of the Deccan Traps volcanic province and impact of the Chicxulub meteorite. Here we combine published extinction patterns with a new clumped isotope temperature record from a hiatus-free, expanded KPg boundary section from Seymour Island, Antarctica. We document a 7.8±3.3 °C warming synchronous with the onset of Deccan Traps volcanism and a second, smaller warming at the time of meteorite impact. Local warming may have been amplified due to simultaneous disappearance of continental or sea ice. Intra-shell variability indicates a possible reduction in seasonality after Deccan eruptions began, continuing through the meteorite event. Species extinction at Seymour Island occurred in two pulses that coincide with the two observed warming events, directly linking the end-Cretaceous extinction at this site to both volcanic and meteorite events via climate change.
Overview
CoChat Summary
Written by AI from the paper’s full text.
TL;DR
A new clumped-isotope temperature record from Seymour Island, Antarctica, shows a 7.8±3.3 °C warming synchronous with Deccan Traps onset and a smaller 1.1±2.7 °C warming at the KPg boundary, each coinciding with a pulse of species extinction. The authors conclude that the end-Cretaceous extinction at this site was linked to both Deccan volcanism and the Chicxulub impact via climate change.
Key findings
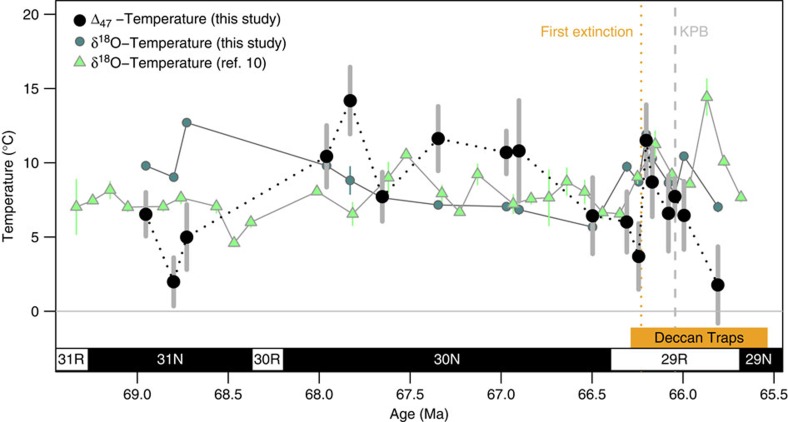
- Clumped isotope temperatures warm from ∼5 °C to ∼14 °C between 68.7 and 67.8 Ma, remain ∼9–12 °C for ∼1 Myr, cool to ∼4 °C from 66.9 to 66.25 Ma, then show a 7.8±3.3 °C warming ∼150 kyr before the KPg boundary and a second 1.1±2.7 °C warming at the boundary; temperatures return to pre-event levels ∼200–400 kyr after the initial spike.
- Extinction at Seymour Island occurred in two pulses: 10 of 24 species were eliminated before Chicxulub, coinciding with the large warming and Deccan onset, and 14 of 24 species were eliminated at the KPg boundary; the earlier pulse had 9 of 10 benthic species, whereas the later pulse had only 6 of 14 benthic species, and one ammonite species went extinct in the first event versus all remaining six at the KPg boundary.
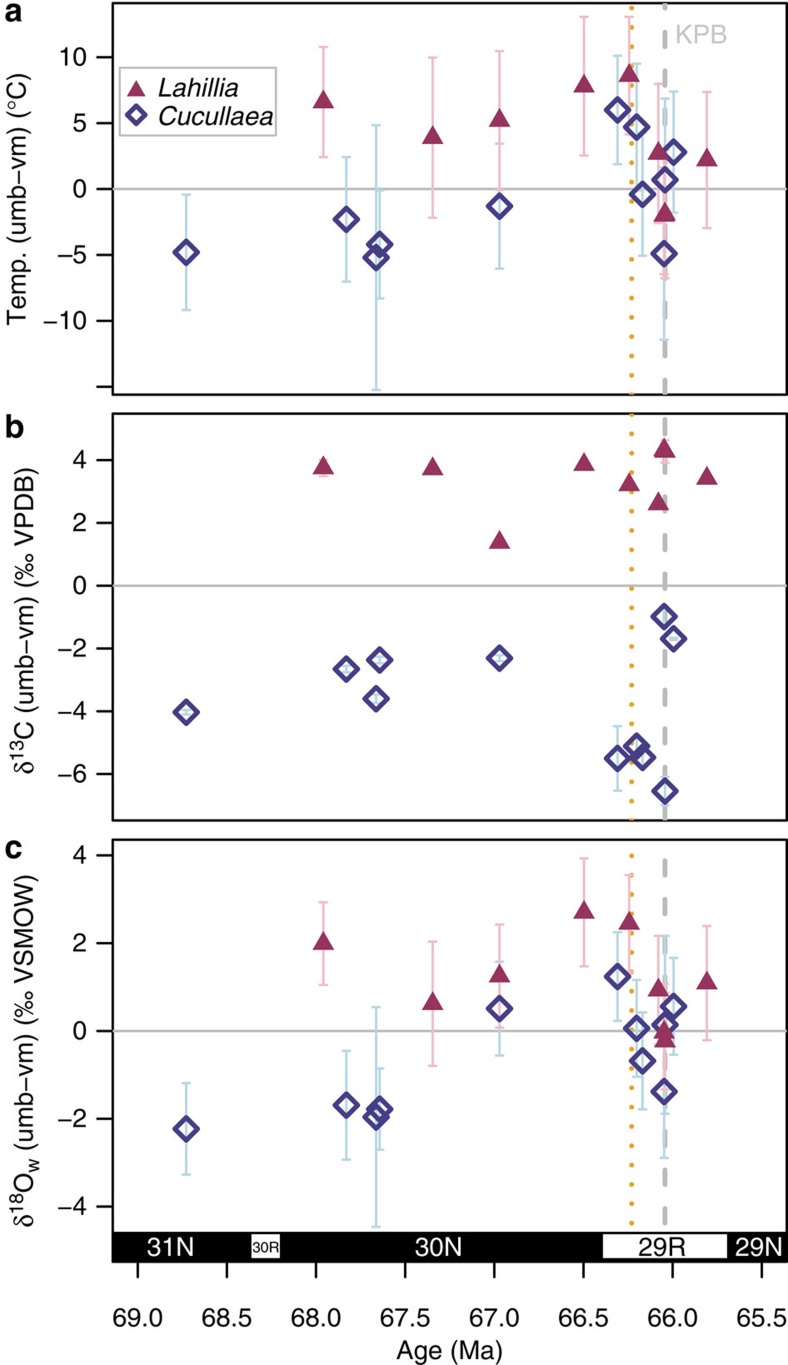
- δ18Ow varied from −3.4 to +1.0‰ (mean −1.3±0.8‰) and was highly correlated with temperature; assuming a fixed δ18Ow gives only about half the variability of the clumped isotope record (7 °C versus 12.5 °C range for shells in this study).
- Deccan CO2 emissions between Chron 29R onset and the KPg boundary are estimated at 270–900 p.p.m. added to a background of ∼360–380 p.p.m.; post-KPB volcanism potentially added another 830–900 p.p.m., with modelling studies predicting 0.5–4 °C global warming and possible local amplification by ice-albedo feedback.
Methods
- Twenty-nine well-preserved bivalve shells representing five species were selected from the Zinsmeister collection, Units 9 and 10 of the López de Bertodano Formation, Seymour Island; most were sampled at the umbo and ventral margin for δ18O, δ13C, and clumped isotope composition (Δ47), with a larger set of 116 shells analyzed for δ18O and δ13C only.
- Shell preservation was screened by X-ray diffraction, cathodoluminescence, and trace element thresholds (Fe <500 p.p.m., Mn <200 p.p.m.); an age model was built from published magnetostratigraphy converted to the Zinsmeister stratigraphic framework and corroborated with new and published 87Sr/86Sr data.
- Temperatures were derived from Δ47 using the Defliese et al. calibration; δ18Ow was calculated from Δ47-derived temperature, shell δ18O, and aragonite-water fractionation; horizon means were inverse-variance weighted, and CO2 emissions were calculated from estimated lava volumes using 14 Tg CO2 km−3 lava.
Limitations
- The paper states that it is impossible at this point to separate the influences of the meteorite and the additional post-KPB Deccan volcanism in driving the second extinction pulse or the second warming event.
- The paper notes inherent uncertainty in the magnetostratigraphy-based age model from interpolation and the Geological Time Scale, which was not explicitly accounted for, and that the apparent rapid rate of Deccan warming may be an artifact of variable sampling resolution.
- The paper states that δ18O-derived temperatures assuming constant δ18Ow are biased and underestimate true variability; the clumped isotope sample set is limited to the best-preserved shells, and horizon averages combine species and shell positions without knowing which best represents mean annual temperature.
Model-written summary. Check it against the paper before relying on it.
Integrity signals
Registry
Cites
Statistics
Figures
Verification
Claims the paper makes
24 Own result · 16 Own interpretation · 12 Own method · 9 No full text of the sources · 7 Check pending · 6 Sources not found · 4 Not checked yet
In the paper
“The ∼8 °C pre-KPB warming observed in the Seymour Island record is larger than similar warming events seen at other marine sites222324.”
§ End-Cretaceous extinction in Antarctica linked to both Deccan volcanism and meteorite impact via climate change > Discussion
What the sources say
- Not checked — no full text of the sourcecites [22] Li, L. & Keller, G. Maastrichtian climate, productivity and faunal turnovers in planktic foraminifera in South Atlantic DSDP sites 525A and 21. Geology 26, 995–998 (1998). source
- Not checked — no full text of the sourcecites [23] MacLeod, K. G., Huber, B. T. & Isaza-Londoño, C. North Atlantic warming during global cooling at the end of the Cretaceous. Geology 33, 437–440 (2005). source
- Check pendingcites [24] Westerhold, T., Rohl, U., Donner, B., McCarren, H. K. & Zachos, J. C. A complete high-resolution Paleocene benthic stable isotope record for the central Pacific (ODP Site 1209). Paleoceanography 26, PA2216 (2011). source
plain- Asserted: passes — The authors put it forward as true.
- Checkable: passes — It can be checked against evidence.
- Load-bearing: unclear — It is unclear whether the paper’s conclusions depend on it.
- Based: passes — The paper gives a reason why it holds.
A result the paper reports from its own data — it cites no other source for it, so there is none to check. The quote shows it is in the paper.
In the paper
“Approximately 150 kyr before the KPg boundary, a marked warming of ∼7.8±3.3 °C occurs.”
§ End-Cretaceous extinction in Antarctica linked to both Deccan volcanism and meteorite impact via climate change > Results > Cretaceous–Paleogene temperature at Seymour Island
plain- Asserted: passes — The authors put it forward as true.
- Checkable: passes — It can be checked against evidence.
- Load-bearing: passes — The paper’s conclusions depend on it.
- Based: passes — The paper gives a reason why it holds.
A result the paper reports from its own data — it cites no other source for it, so there is none to check. The quote shows it is in the paper.
In the paper
“The coldest temperatures recorded in the Seymour Island section (at 68.8, 66.4 and 65.7 Ma) are near the freezing point, implying the possibility of sea ice formation near Seymour Island.”
§ End-Cretaceous extinction in Antarctica linked to both Deccan volcanism and meteorite impact via climate change > Discussion
plain- Asserted: passes — The authors put it forward as true.
- Checkable: passes — It can be checked against evidence.
- Load-bearing: passes — The paper’s conclusions depend on it.
- Based: passes — The paper gives a reason why it holds.
A result the paper reports from its own data — it cites no other source for it, so there is none to check. The quote shows it is in the paper.
In the paper
“We document a 7.8±3.3 °C warming synchronous with the onset of Deccan Traps volcanism and a second, smaller warming at the time of meteorite impact.”
§ End-Cretaceous extinction in Antarctica linked to both Deccan volcanism and meteorite impact via climate change > Abstract
plainstates an association- Asserted: passes — The authors put it forward as true.
- Checkable: passes — It can be checked against evidence.
- Load-bearing: passes — The paper’s conclusions depend on it.
- Based: passes — The paper gives a reason why it holds.
A result the paper reports from its own data — it cites no other source for it, so there is none to check. The quote shows it is in the paper.
In the paper
“If a fixed value for δ18Ow is assumed, the resulting δ18O-derived temperature record has only around half the variability of the ‘true' clumped isotope temperature record, which allows for variations in δ18Ow (7 °C versus 12.5 °C temperature range for shells from this study).”
§ End-Cretaceous extinction in Antarctica linked to both Deccan volcanism and meteorite impact via climate change > Results > High variability in δ18Ow within and between shells
plainstates a cause- Asserted: passes — The authors put it forward as true.
- Checkable: passes — It can be checked against evidence.
- Load-bearing: passes — The paper’s conclusions depend on it.
- Based: passes — The paper gives a reason why it holds.
- It may state two separate claims as one. 25
- Probably not a substantial claim. 26
Create a free account to see these claims.
Create a free account to see these assumptions.
31 more claims
Create a free account to see all 78 claims and to verify the 10 references still open.
Self-check
Percentages, sums and reported differences re-computed from the paper’s own numbers.
Each contradiction between two passages listed here was confirmed by an independent check.
Rated minor: it would not touch a result — a value no result rests on, a p-value that stays on the same side of the significance level, or a conflict that is clerical, resolved elsewhere in the paper, or outside its own findings.
In the paper
§ End-Cretaceous extinction in Antarctica linked to both Deccan volcanism and meteorite impact via climate change > Methods > Sample preparation and extraction
“Broken and partial shells were not selected for the clumped isotope sample set.”
§ End-Cretaceous extinction in Antarctica linked to both Deccan volcanism and meteorite impact via climate change > Methods > Sample preparation and extraction
“Six shells of the genus Eselaevitrigonia were only sampled in the umbo position because invariant stable isotopic compositions between positions suggested that identical environmental conditions were being recorded at all points on the shell (see below), and some shells were broken such that the ventral margin was no longer present.”
Citations
Cites
Extraterrestrial Cause for the Cretaceous-Tertiary Extinction
Alvarez, L. W., Alvarez, W., Asaro, F., & Michel, H. V. (1980) · Science · doi:10.1126/science.208.4448.1095 · Cited by 3,198
The central role of diminishing sea ice in recent Arctic temperature amplification
Screen, J. A., & Simmonds, I. (2010) · Nature · doi:10.1038/nature09051 · Cited by 2,504
Shackleton, N. J., & Kennett, J. P. (1975) · U.S. Government Printing Office eBooks · doi:10.2973/dsdp.proc.29.117.1975 · Cited by 1,561
Haq, B. U. (2013) · Global and Planetary Change · doi:10.1016/j.gloplacha.2013.12.007 · Cited by 1,327
The Chicxulub Asteroid Impact and Mass Extinction at the Cretaceous-Paleogene Boundary
Schulte, P., Alegret, L., Arenillas, I., Arz, J. A., Barton, P. J., Bown, P. R., Bralower, T. J., Christeson, G. L., Claeys, P., Cockell, C. S., et al. (2010) · Science · doi:10.1126/science.1177265 · Cited by 1,323
Evolution of Early Cenozoic marine temperatures
Zachos, J. C., Stott, L., & Lohmann, K. C. (1994) · Paleoceanography · doi:10.1029/93pa03266 · Cited by 774
Self-citationDefining an absolute reference frame for ‘clumped’ isotope studies of CO2
Dennis, K. J., Affek, H. P., Passey, B. H., Schrag, D. P., & Eiler, J. M. (2011) · Geochimica et Cosmochimica Acta · doi:10.1016/j.gca.2011.09.025 · Cited by 627
Time Scales of Critical Events Around the Cretaceous-Paleogene Boundary
Renne, P. R., Deino, A. L., Hilgen, F. J., Kuiper, K. F., Mark, D. F., Mitchell, W. S., Morgan, L. E., Mundil, R., & Smit, J. (2013) · Science · doi:10.1126/science.1230492 · Cited by 545
Kim, S.-T., O’Neil, J. R., Hillaire-Marcel, C., & Mucci, A. (2007) · Geochimica et Cosmochimica Acta · doi:10.1016/j.gca.2007.04.019 · Cited by 532
Dessert, C., Dupré, B., François, L., Jacques Schott, A., Gaillardet, J., Chakrapani, G. J., & Bajpai, S. (2001) · Earth and Planetary Science Letters · doi:10.1016/s0012-821x(01)00317-x · Cited by 506
Research works printed but not linked: 3
- Palamarczuk, S. et al. Las Formaciones López de Bertodano y Sobral en la Isla Vicecomodoro Marambio, Antártida: IX Congreso Geológico Argentino. Actas 1, 399–419 (1984).
- Ogg, J. G. in The Geologic Time Scale eds Gradstein F. M., Ogg J. G., Schmitz M. D., Ogg G. M. vol. 1, chap. 5Elsevier: Oxford, (2012).
- McArthur, J. M., Howarth, R. J. & Shields, G. A. in The Geologic Time Scale eds Gradstein F. M., Ogg J. G., Schmitz M. D., Ogg G. M. vol. 1, chap. 7Elsevier: Oxford, (2012).
Cited by
Items 101–200 of 210
Seafood Salad: A diverse latest Cretaceous flora from eastern Montana
Wilson, P., Wilson, G. P., & Strömberg, C. A. E. (2021) · Cretaceous Research · doi:10.1016/j.cretres.2020.104734 · Cited by 8
Nauter‐Alves, A., Jones, T. D., Bruno, M. D. R., Mota, M. A. D. L., Cachão, M., Krahl, G., & Fauth, G. (2022) · Global and Planetary Change · doi:10.1016/j.gloplacha.2023.104046 · Cited by 8
Response of the lacustrine flora in East Asia to global climate changes across the K/Pg boundary
Li, S., Sanjuan, J., Wang, Q., Zhang, H., & Wan, X. (2020) · Global and Planetary Change · doi:10.1016/j.gloplacha.2020.103400 · Cited by 8
Literature, Climate, and Time: Between History and Story
Markley, R. (2019) · Cambridge University Press eBooks · doi:10.1017/9781108505321.002 · Cited by 7
Why Does It Matter That Many Biology Concepts Are Metaphors?
Kampourakis, K. (2020) · Cambridge University Press eBooks · doi:10.1017/9781108648981.007 · Cited by 7
Dipterocarps used India as a raft from Gondwana to Eurasia
Sanil, M. S., Balakrishnan, S., Sreekumar, V. B., & Dev, S. A. (2022) · Taxon · doi:10.1002/tax.12794 · Cited by 6
What Is the Nature of Scientific Controversies in the Biological Sciences?
Dietrich, M. R. (2020) · Cambridge University Press eBooks · doi:10.1017/9781108648981.013 · Cited by 6
Mesozoic atmospheric CO 2 concentrations reconstructed from dinosaur tooth enamel
Feng, D., Tütken, T., Griebeler, E. M., Herwartz, D., & Pack, A. (2025) · Proceedings of the National Academy of Sciences · doi:10.1073/pnas.2504324122 · Cited by 5
Tobin, T. S., Flannery, D. T., & Sousa, F. J. (2017) · Cretaceous Research · doi:10.1016/j.cretres.2017.12.006 · Cited by 5
“Winter Is Coming”: How did Polyploid Plants Survive?
Li, Z., & de Peer, Y. V. (2019) · Molecular Plant · doi:10.1016/j.molp.2019.12.003 · Cited by 5
What Is the Relation between Facts and Values in Biological Science? Biology in Society
Friese, C., & Prainsack, B. (2020) · Cambridge University Press eBooks · doi:10.1017/9781108648981.014 · Cited by 5
British Romanticism and the Global Climate
Higgins, D. (2019) · Cambridge University Press eBooks · doi:10.1017/9781108505321.009 · Cited by 5
Schneider, W., & Salameh, E. (2020) · Open Journal of Geology · doi:10.4236/ojg.2020.101002 · Cited by 5
Benigno, A. P. A., Sial, A. N., & de Lacerda, L. D. (2018) · Revista Virtual de Química · doi:10.21577/1984-6835.20180048 · Cited by 4
An Overview of Paleo-Climate Evidence in Egypt
Khozyem, H. M. (2020) · Springer water · doi:10.1007/978-3-030-41629-4_2 · Cited by 4
Atmosphere as Setting, or, ‘Wuthering’ the Anthropocene
Taylor, J. O. (2019) · Cambridge University Press eBooks · doi:10.1017/9781108505321.003 · Cited by 4
Planetary Climates: Terraforming in Science Fiction
Pak, C. (2019) · Cambridge University Press eBooks · doi:10.1017/9781108505321.013 · Cited by 4
Weather and Climate in the Age of Enlightenment
Goliński, J. (2019) · Cambridge University Press eBooks · doi:10.1017/9781108505321.008 · Cited by 4
Experimental Constraints on Clumped Isotope Fractionation During BaCO3 Precipitation
Guo, Y., Deng, W., & Wei, G. (2022) · Geochemistry Geophysics Geosystems · doi:10.1029/2021gc010249 · Cited by 4
Pal, S., Shrivastava, J. P., & Kalpana, M. S. (2023) · Geobiology · doi:10.1111/gbi.12567 · Cited by 4
Ghosh, D., Sen, J., & Mandal, N. (2024) · Journal of Geophysical Research Solid Earth · doi:10.1029/2024jb029020 · Cited by 3
Ethereal Women: Climate and Gender from Realism to the Modernist Novel
Pizzo, J. (2019) · Cambridge University Press eBooks · doi:10.1017/9781108505321.012 · Cited by 3
How Can Conceptual Analysis Contribute to Scientific Practice? The Case of Cultural Evolution
Lewens, T. (2020) · Cambridge University Press eBooks · doi:10.1017/9781108648981.009 · Cited by 3
Somervell, T. (2019) · Cambridge University Press eBooks · doi:10.1017/9781108505321.004 · Cited by 3
Daners, G., Amenábar, C. R., Guerstein, G. R., & Veroslavsky, G. (2022) · Marine and Petroleum Geology · doi:10.1016/j.marpetgeo.2022.105728 · Cited by 3
What Is the Nature of Theories and Models in Biology?
Parke, E. C., & Plutynski, A. (2020) · Cambridge University Press eBooks · doi:10.1017/9781108648981.005 · Cited by 3
McCain, K. (2020) · Cambridge University Press eBooks · doi:10.1017/9781108648981.004 · Cited by 3
Schneider, W., & Salameh, E. (2020) · Open Journal of Geology · doi:10.4236/ojg.2020.1011053 · Cited by 3
Pal, S., Jayananda, M., Shrivastava, J. P., & Meenakshi, M. (2022) · Geosystems and Geoenvironment · doi:10.1016/j.geogeo.2022.100050 · Cited by 3
Sen, R., Polacci, M., Hartley, M. E., Burton, M. R., & Gupta, S. (2025) · Journal of Volcanology and Geothermal Research · doi:10.1016/j.jvolgeores.2025.108493 · Cited by 2
What Is the Basis of Biological Classification? The Search for Natural Systems
Reydon, T. A. C. (2020) · Cambridge University Press eBooks · doi:10.1017/9781108648981.012 · Cited by 2
Schneider, W., & Salameh, E. (2023) · Open Journal of Geology · doi:10.4236/ojg.2023.132007 · Cited by 2
Tanner, L. H., & Lucas, S. G. (2023) · The Depositional Record · doi:10.1002/dep2.251 · Cited by 2
Schneider, W., & Salameh, E. (2024) · Open Journal of Geology · doi:10.4236/ojg.2024.146029 · Cited by 2
Hir, G. L., Fluteau, F., Suchéras-Marx, B., & Goddéris, Y. (2020) · Geological Society of America eBooks · doi:10.1130/2020.2544(09 · Cited by 2
Kapcsolt izotópok (clumped isotopes) a földtudományi kutatásokban
Kele, S., & Bajnai, D. (2017) · Földtani Közlöny · doi:10.23928/foldt.kozl.2017.147.2.177 · Cited by 2
Climate Criticism and Nuclear Criticism
Cordle, D. (2019) · Cambridge University Press eBooks · doi:10.1017/9781108505321.018 · Cited by 2
Climate and Race in the Age of Empire
Howell, J. (2019) · Cambridge University Press eBooks · doi:10.1017/9781108505321.011 · Cited by 2
How Do Concepts Contribute to Scientific Advancement? Evolutionary Biology As a Case Study
Depew, D. (2020) · Cambridge University Press eBooks · doi:10.1017/9781108648981.008 · Cited by 2
Ruse, M. (2020) · Cambridge University Press eBooks · doi:10.1017/9781108648981.015 · Cited by 2
Schneider, W., & Salameh, E. (2022) · Open Journal of Geology · doi:10.4236/ojg.2022.126023 · Cited by 2
Using impact exsolution to link the Chicxulub collision and Deccan volcanismPreprint
Harrison, K. G. (2017) · arXiv (Cornell University) · doi:10.48550/arxiv.1701.04704 · Cited by 2
Some record it hot: Clumped isotope temperatures from Middle Jurassic molluscan aragonite
Paxton, R. B., Andrews, J. E., Dennis, P. F., Marca, A. D., & Vonhof, H. (2025) · Sedimentology · doi:10.1111/sed.70059 · Cited by 1
Climatic Agency in the Classical Age
Lehoux, D. (2019) · Cambridge University Press eBooks · doi:10.1017/9781108505321.005 · Cited by 1
Phanerozoic Mass Extinctions and Indian Stratigraphic Records
Prasad, G. V. R., & Parmar, V. (2020) · Springer geology · doi:10.1007/978-3-030-15989-4_9 · Cited by 1
Why Should Biologists Care about the Philosophy of Science?
Uller, T., & Kampourakis, K. (2020) · Cambridge University Press eBooks · doi:10.1017/9781108648981.002 · Cited by 1
Kumari, V., Tandon, S. K., Ghatak, A., Srivastava, P., Bera, M. K., & Chakrabarti, R. (2024) · Sedimentology · doi:10.1111/sed.13255 · Cited by 1
What Methods Do Life Scientists Use? A Brief History with Philosophical Implications
Peterson, E. L. (2020) · Cambridge University Press eBooks · doi:10.1017/9781108648981.010 · Cited by 1
Resolving the timing of events around the Cretaceous-Paleogene Boundary
Sprain, C. J. (2017) · eScholarship (California Digital Library)
Mountains, Atmosphere and Long-Term Habitability
Stevenson, D. S. (2018) · Springer eBooks · doi:10.1007/978-3-319-91503-6_6
The Mountains and Death: Revelations of Climate and Land in Nordic Noir
Nestingen, A. (2019) · Cambridge University Press eBooks · doi:10.1017/9781108505321.014
The Climate of Shakespeare: Four (or More) Forecasts
Duckert, L. (2019) · Cambridge University Press eBooks · doi:10.1017/9781108505321.007
Weathering the Storm: Adverse Climates in Medieval Literature
Langeslag, P. S. (2019) · Cambridge University Press eBooks · doi:10.1017/9781108505321.006
The Literary Politics of Transatlantic Climates
Vanek, M. (2019) · Cambridge University Press eBooks · doi:10.1017/9781108505321.010
Survey, B. A., Whittle, R. J., Witts, J. D., Bowman, V. C., Crame, J. A., Francis, J. E., & Ineson, J. R. (2019) · Abstracts with programs - Geological Society of America · doi:10.1130/abs/2019am-333664
How Can We Teach Philosophy of Science to Biologists?
Kampourakis, K., & Uller, T. (2020) · Cambridge University Press eBooks · doi:10.1017/9781108648981.016
Letulle, T. (2021) · Climate of the past · doi:10.5194/cp-2021-79-ac2
Letulle, T., Suan, G., Daëron, M., et al. (2021) · Climate of the past · doi:10.5194/cp-2021-79-rc1
Letulle, T. (2021) · Climate of the past · doi:10.5194/cp-2021-79-ac1
O'Hora, H. E., Petersen, S. V., Vellekoop, J., et al. (2021) · Climate of the past · doi:10.5194/cp-2021-104-rc1
Kampourakis, K., & Uller, T. (2020) · Cambridge University Press eBooks · doi:10.1017/9781108648981.001
Kampourakis, K., & Uller, T. (2020) · Cambridge University Press eBooks · doi:10.1017/9781108648981.018
Kampourakis, K., & Uller, T. (2020) · Cambridge University Press eBooks · doi:10.1017/9781108648981.017
O'Hora, H. E., Petersen, S. V., Vellekoop, J., et al. (2022) · Climate of the past · doi:10.5194/cp-2021-104-rc2
Johns‐Putra, A. (2019) · Cambridge University Press eBooks · doi:10.1017/9781108505321.019
McMenamin, M. A. S. (2018) · Springer geology · doi:10.1007/978-3-319-74256-4_2
Johns‐Putra, A. (2019) · Cambridge University Press eBooks · doi:10.1017/9781108505321.001
Petersen, S. (2022) · Climate of the past · doi:10.5194/cp-2021-104-ac1
Self-citationAttachement #2 relating to Reply on Comment 1
Petersen, S. (2022) · Climate of the past · doi:10.5194/cp-2021-104-ac3
Self-citationStevenson, D. S. (2017) · Astronomers' universe · doi:10.1007/978-3-319-52911-0_6
Double disaster killed dinosaurs
(2016) · Nature · doi:10.1038/535202c
Johns‐Putra, A. (2019) · Cambridge University Press eBooks · doi:10.1017/9781108505321.020
Letulle, T., Suan, G., Daëron, M., et al. (2021) · Climate of the past · doi:10.5194/cp-2021-79-rc2
Fundamental Physics and the Special Vulnerability to Underdetermination
Vickers, P. (2022) · Oxford University Press eBooks · doi:10.1093/oso/9780192862730.003.0006
The Tiktaalik ‘Missing Link’ Novel Predictive Success and the Evidence for Evolution
Vickers, P. (2022) · Oxford University Press eBooks · doi:10.1093/oso/9780192862730.003.0004
The Historical Challenge to Future-Proof Science: The Debate So Far
Vickers, P. (2022) · Oxford University Press eBooks · doi:10.1093/oso/9780192862730.003.0002
Vickers, P. (2022) · Oxford University Press eBooks · doi:10.1093/oso/9780192862730.002.0004
Vickers, P. (2022) · Oxford University Press eBooks · doi:10.1093/oso/9780192862730.002.0007
Scientific Knowledge in a Pandemic
Vickers, P. (2022) · Oxford University Press eBooks · doi:10.1093/oso/9780192862730.003.0008
Do We Know How the Dinosaurs Died?
Vickers, P. (2022) · Oxford University Press eBooks · doi:10.1093/oso/9780192862730.003.0007
Core Argument, Objections, Replies, and Outlook
Vickers, P. (2022) · Oxford University Press eBooks · doi:10.1093/oso/9780192862730.003.0009
Vickers, P. (2022) · Oxford University Press eBooks · doi:10.1093/oso/9780192862730.002.0006
The Judgement of the Scientific Community: Lessons from Continental Drift
Vickers, P. (2022) · Oxford University Press eBooks · doi:10.1093/oso/9780192862730.003.0005
Meckel’s Successful Prediction of Gill Slits: A Case of Misleading Evidence?
Vickers, P. (2022) · Oxford University Press eBooks · doi:10.1093/oso/9780192862730.003.0003
Vickers, P. (2022) · Oxford University Press eBooks · doi:10.1093/oso/9780192862730.002.0003
The Highs and Lows of the Reef Phenomenon
Martin‐Garin, B., & Montaggioni, L. F. (2023) · Coral reefs of the world · doi:10.1007/978-3-031-16887-1_5
Егоров, П., Nesterov, E. M., Викторович, Д. С., Shmoylov, K., & Markova, M. A. (2023) · IOP Conference Series Earth and Environmental Science · doi:10.1088/1755-1315/1229/1/012034
Geochemistry of environmental stress during mass extinctions
Clapham, M. E. (2024) · Elsevier eBooks · doi:10.1016/b978-0-323-99762-1.00072-3
Gao, Y., Gao, Y., & Ibarra, D. E. (2024) · Springer eBooks · doi:10.1007/978-981-99-6936-4_2
Imbalances: Sources of All Change
Knoflacher, M. (2024) · Springer eBooks · doi:10.1007/978-3-662-69423-7_8
CLUMPED ISOTOPE THERMOMETRY AND ITS APPLICATION IN GEOSCIENCE RESEARCH
Ghosh, P., & Fosu, B. R. (2019) · Mineralogical Association of Canada eBooks · doi:10.3749/9780921294702.ch08
Lesko, A., Dworkin, S., & Atchley, S. C. (2025) · Geosciences · doi:10.3390/geosciences15040119
Die Äonen in zeitlicher Reihenfolge
Sicius, H. (2025) · Springer eBooks · doi:10.1007/978-3-662-69976-8_4
Müller, I. A., Rijkes, D., Judd, E. J., Hamers, M., Plümper, O., Jagt, J. W. M., & Ziegler, M. (2025) · Cretaceous Research · doi:10.1016/j.cretres.2025.106258
Yu, J., Sun, Y., Bugdaeva, E. V., & Markevich, V. S. (2025) · Cretaceous Research · doi:10.1016/j.cretres.2025.106270
Unstable climate for 50,000 years after Chicxulub impact: evidence from AntarcticaPreprint
Li, S., Wignall, P. B., Witts, J. D., Wang, M., He, Z., Wang, N., Zhang, D., Jiang, T., Gao, L., Wang, Q., et al. (2025) · Research Square · doi:10.21203/rs.3.rs-8071084/v1
Metacommunity structural changes of Antarctic benthic invertebrates over the late Maastrichtian
Khan, T. M., Whittle, R. J., Witts, J. D., Griffiths, H. J., Manica, A., & Mitchell, E. G. (2025) · Palaeogeography Palaeoclimatology Palaeoecology · doi:10.1016/j.palaeo.2025.113495
Al-Hamed, S., & Al-khafaji, S. J. (2025) · Iraqi National Journal of Earth Science (INJES) · doi:10.33899/injes.v26i1.60186
Avian Responses to Rapid Climate Change: Examples from the Putah Creek Christmas Bird Count
Hampton, S. (2020) · Central Valley Birds · doi:10.64555/ygfy6s42
Metadata
- Authors
- Petersen, S. V., Dutton, A., & Lohmann, K. C.
- Affiliations
- University of Michigan (US)
- University of Florida (US)
- Corresponding author
- Petersen, Sierra V.
- Venue
- Nature Communications
- Published
- 2016-07-05
- Volume
- 7
- Issue
- 1
- Pages
- 12079-12079
- ISSN
- 2041-1723 (ISSN-L)
- PMC
- PMC4935969
- OpenAlex
- W2465856649
- Semantic Scholar
- a1054903a89b442a80bc22c5fea2b541f983c2e1
- Cited by
- 210
- References
- 62
- Citations by year
- 2026: 7 · 2025: 11 · 2024: 11 · 2023: 13 · 2022: 31 · 2021: 22 · 2020: 41 · 2019: 36 · 2018: 21 · 2017: 15 · 2016: 2
- FWCI
- 13.26
- Type
- journal article
- Language
- en
- Open access
- gold
- doi.org
- Locations
- Nature Communications (publishedVersion, cc-by)
- Europe PMC (PubMed Central) (publishedVersion, cc-by)
- PubMed (publishedVersion)
- PubMed Central (publishedVersion, cc-by)
- RePEc: Research Papers in Economics (submittedVersion)
- DOAJ (DOAJ: Directory of Open Access Journals) (submittedVersion, cc-by-sa)
- Funders
- National Science Foundation (1123733, 9980538, 9318212, 1420902)
- Topics
- Physical Sciences › Earth and Planetary Sciences › Paleontology › Paleontology and Stratigraphy of Fossils
- Physical Sciences › Earth and Planetary Sciences › Atmospheric Science › Geology and Paleoclimatology Research
- Physical Sciences › Earth and Planetary Sciences › Paleontology › Evolution and Paleontology Studies
- Keywords
- end-Cretaceous mass extinction, Chicxulub impact, Cretaceous-Paleogene boundary, global warming, clumped isotopes, sea ice decline, seasonal variation, extinction pulses, Seymour Island, Antarctica, paleoclimate
About these checks
Registry, retraction, Cites and statistics results are computed, not judged, with one exception: a printed reference that no index lists is read once by a model before it counts as a citation error. Claims are extracted by a model and kept only when their quote appears verbatim in the text; each cited source is then checked, with a model’s help, for whether it says what the claim relies on. Those verdicts can be wrong — read the claim’s quote and the cited source before relying on one.
A language model drew the claims from the paper on 2026-11-12, under version 3 of the claim definition (model deepseek-v4.1-flash, prompt extract-v3).
A second model labelled each claim on 2026-11-12 (model jev-1.13-20260917, definition revision gold-guideline-v0.2).
Statistics and arithmetic are recomputed, not judged.
Confidence bands are shown only for fields calibrated on our annotated test set. None is calibrated yet, so no band is shown.
What counts as a claim ›How we measure confidence ›How we check this ›
Are you an author, or do you see a problem with this page? Request a review
