Cited by 320TGF-β signaling in diseasesWnt/β-catenin signaling in development and cancerDevelopmental Biology and Gene Regulation

The DOI matches its Crossref record; 70 of the 70 references it cites were found in a registry or an index.

BMP restricts stemness of intestinal Lgr5(+) stem cells by directly suppressing their signature genes

Open access

Abstract

The intestinal epithelium possesses a remarkable self-renewal ability, which is mediated by actively proliferating Lgr5 + stem cells. Bone morphogenetic protein (BMP) signalling represents one major counterforce that limits the hyperproliferation of intestinal epithelium, but the exact mechanism remains elusive. Here we demonstrate that epithelial BMP signalling plays an indispensable role in restricting Lgr5 + stem cell expansion to maintain intestinal homeostasis and prevent premalignant hyperproliferation on damage. Mechanistically, BMP inhibits stemness of Lgr5 + stem cells through Smad-mediated transcriptional repression of a large number of stem cell signature genes, including Lgr5 , and this effect is independent of Wnt/β-catenin signalling. Smad1/Smad4 recruits histone deacetylase HDAC1 to the promoters to repress transcription, and knockout of Smad4 abolishes the negative effects of BMP on stem cells. Our findings therefore demonstrate that epithelial BMP constrains the Lgr5 + stem cell self-renewal via Smad-mediated repression of stem cell signature genes to ensure proper homeostatic renewal of intestinal epithelium.

Overview

The claims and statistics of this paper haven’t been checked yet.

Run the check — free, no account needed. It reads the open-access text and checks the sources it cites.

A few free checks a day · papers already verified open instantly · results are public

Integrity signals

Registry

Crossref · 10.1038/ncomms13824

Cites

70 of 70 references verified0 citation errors · 0 not checkable

Statistics

Figures

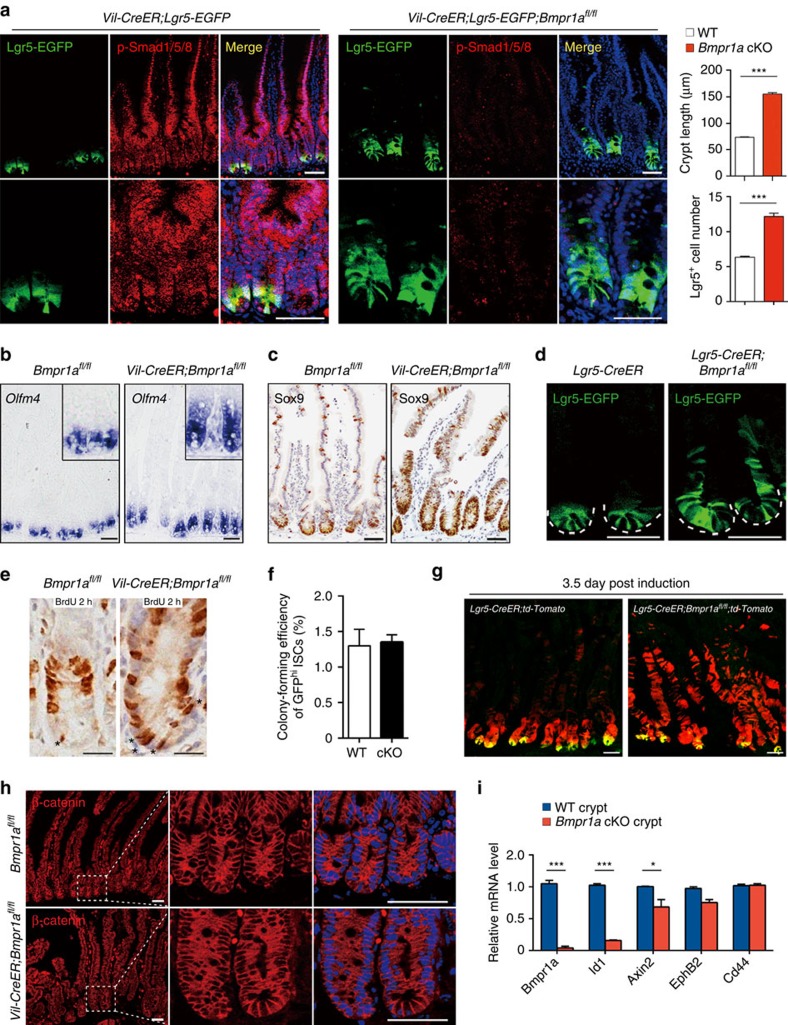
Figure 1 BMP restricts Lgr5+ stem cell expansion independently of Wnt/β-catenin during intestinal homeostasis. (a) Vil-CreER;Lgr5-EGFP and Vil-CreER;Lgr5-EGFP;Bmpr1afl/fl mice were analysed 1 week after 5-day tamoxifen administration. Proximal jejunum sections were stained for p-Smad1/5/8 (for BMP signalling activity) and EGFP (for stem cells). Nuclei were counter-stained with 4′,6-diamidino-2-phenylindole (DAPI). The lower panels show enlargements of the upper panels. Images are representative of n=6 mice per genotype. Quantifications of crypt length and Lgr5+ cell number is shown aside, and the data represent mean±s.e.m. of n=6 mice per genotype. ***P<0.001 by Student's t-tests. (b,c) In situ hybridization of Olfm4 and immunohistochemical staining of Sox9 in Bmpr1afl/fl and Vil-CreER;Bmpr1afl/fl mice at day 12. Images are representative of n=6 mice per genotype. (d) Immunofluorescence images showing Lgr5+ stem cells 12 days after the first injection in Lgr5-CreERT2;Bmpr1afl/fl mice (n=5 mice per genotype). Dotted lines delineate the normal Lgr5+ stem cell pool. Images are representative of three independent experiments. (e) BrdU incorporation in ISCs and transient amplifying cells after a 2 h pulse in Vil-CreER;Bmpr1afl/fl and Bmpr1afl/fl mice at day 12. Images are representative of n=6 mice per genotype. The asterisks indicate the replicating CBC cells at the base of crypt. (f) In vitro colony formation assay of GFPhigh cells sorted from Vil-CreER;Bmpr1afl/fl and Bmpr1afl/fl mice at day 12. Data represent mean±s.e.m. of n=3 experiments. (g) Lineage tracing in the jejunum of Lgr5-CreERT2;td-Tomato mice and Lgr5-CreERT2;td-Tomato;Bmpr1afl/fl mice. Representative images of td-Tomato immunofluorescence at day 3.5 after induction were shown (n=4 mice per genotype). (h) β-catenin immunofluorescence staining of proximal jejunum sections from Bmpr1afl/fl and Vil-CreER;Bmpr1afl/fl mice at day 12. The right panels show enlargements of boxed areas. Nuclei were counter-stained with DAPI. Images are representative of n=6 mice per genotype. (i) Quantitative RT–PCR analysis of Bmpr1a, Id1, Axin2, EphB2 and Cd44 expression in intestinal crypts from Vil-CreER;Bmpr1afl/fl and control mice at day 12 after induction. Data represent mean±s.e.m. of n=5 mice per genotype. *P<0.05, ***P<0.001 by Student's t-tests. Scale bars, 50 μm. CBC, crypt columnar cell; EGFP, enhanced green fluorescent protein.
Figure 1 BMP restricts Lgr5+ stem cell expansion independently of Wnt/β-catenin during intestinal homeostasis. (a) Vil-CreER;Lgr5-EGFP and Vil-CreER;Lgr5-EGFP;Bmpr1afl/fl mice were analysed 1 week after 5-day tamoxifen administration. Proximal jejunum sections were stained for p-Smad1/5/8 (for BMP signalling activity) and EGFP (for stem cells). Nuclei were counter-stained with 4′,6-diamidino-2-phenylindole (DAPI). The lower panels show enlargements of the upper panels. Images are representative of n=6 mice per genotype. Quantifications of crypt length and Lgr5+ cell number is shown aside, and the data represent mean±s.e.m. of n=6 mice per genotype. ***P<0.001 by Student's t-tests. (b,c) In situ hybridization of Olfm4 and immunohistochemical staining of Sox9 in Bmpr1afl/fl and Vil-CreER;Bmpr1afl/fl mice at day 12. Images are representative of n=6 mice per genotype. (d) Immunofluorescence images showing Lgr5+ stem cells 12 days after the first injection in Lgr5-CreERT2;Bmpr1afl/fl mice (n=5 mice per genotype). Dotted lines delineate the normal Lgr5+ stem cell pool. Images are representative of three independent experiments. (e) BrdU incorporation in ISCs and transient amplifying cells after a 2 h pulse in Vil-CreER;Bmpr1afl/fl and Bmpr1afl/fl mice at day 12. Images are representative of n=6 mice per genotype. The asterisks indicate the replicating CBC cells at the base of crypt. (f) In vitro colony formation assay of GFPhigh cells sorted from Vil-CreER;Bmpr1afl/fl and Bmpr1afl/fl mice at day 12. Data represent mean±s.e.m. of n=3 experiments. (g) Lineage tracing in the jejunum of Lgr5-CreERT2;td-Tomato mice and Lgr5-CreERT2;td-Tomato;Bmpr1afl/fl mice. Representative images of td-Tomato immunofluorescence at day 3.5 after induction were shown (n=4 mice per genotype). (h) β-catenin immunofluorescence staining of proximal jejunum sections from Bmpr1afl/fl and Vil-CreER;Bmpr1afl/fl mice at day 12. The right panels show enlargements of boxed areas. Nuclei were counter-stained with DAPI. Images are representative of n=6 mice per genotype. (i) Quantitative RT–PCR analysis of Bmpr1a, Id1, Axin2, EphB2 and Cd44 expression in intestinal crypts from Vil-CreER;Bmpr1afl/fl and control mice at day 12 after induction. Data represent mean±s.e.m. of n=5 mice per genotype. *P<0.05, ***P<0.001 by Student's t-tests. Scale bars, 50 μm. CBC, crypt columnar cell; EGFP, enhanced green fluorescent protein.CC BY · PubMed Central
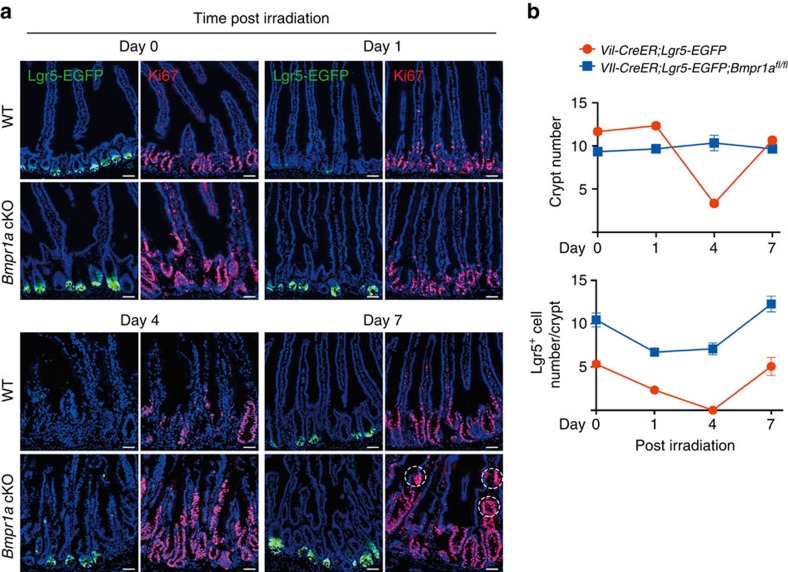
Figure 2 Loss of BMP accelerates crypt regeneration and drives premalignant hyperproliferation after exposure to ionizing radiation. (a) Representative images of Lgr5-EGFP immunofluorescence and Ki67 staining in jejunum sections from Lgr5-EGFP and Vil-CreER;Lgr5-EGFP;Bmpr1afl/fl mice at different time points after 10 Gy abdominal X-ray radiation (n=5 mice per genotype). The mice were irradiated 2 weeks following 5-day tamoxifen induction. Dotted lines delineate the proliferating epithelial invaginations on villus. (b) Quantification of crypt number and Lgr5+ stem cell number in Lgr5-EGFP and Vil-CreER;Lgr5-EGFP;Bmpr1afl/fl mice at different time points after 10 Gy abdominal X-ray radiation. Data represent mean±s.e.m. of n=5 mice per genotype. Scale bars, 50 μm.
Figure 2 Loss of BMP accelerates crypt regeneration and drives premalignant hyperproliferation after exposure to ionizing radiation. (a) Representative images of Lgr5-EGFP immunofluorescence and Ki67 staining in jejunum sections from Lgr5-EGFP and Vil-CreER;Lgr5-EGFP;Bmpr1afl/fl mice at different time points after 10 Gy abdominal X-ray radiation (n=5 mice per genotype). The mice were irradiated 2 weeks following 5-day tamoxifen induction. Dotted lines delineate the proliferating epithelial invaginations on villus. (b) Quantification of crypt number and Lgr5+ stem cell number in Lgr5-EGFP and Vil-CreER;Lgr5-EGFP;Bmpr1afl/fl mice at different time points after 10 Gy abdominal X-ray radiation. Data represent mean±s.e.m. of n=5 mice per genotype. Scale bars, 50 μm.CC BY · PubMed Central
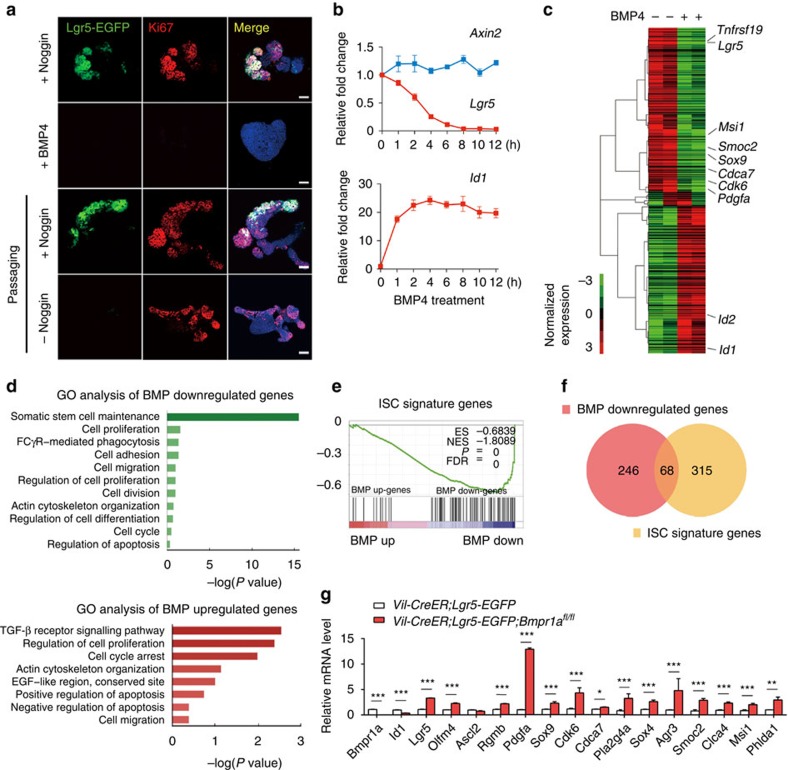
Figure 3 BMP directly suppresses the expression of Lgr5+ stem cell signature genes. (a) BMP signalling was activated for 36 h in intestinal organoids through direct BMP4 treatment or Noggin withdrawal from the normal culture medium containing EGF, Noggin and R-spondin after cell passaging. Lgr5+ stem cells (Lgr5-EGFP) and proliferating cells (Ki67+) were examined in the organoids. Nuclei were counter-stained with 4′,6-diamidino-2-phenylindole. Images are representative of three independent experiments. (b) Quantitative RT–PCR analysis of Lgr5, Axin2 and Id1 in intestinal organoids after BMP stimulation for indicated time. (c) The organoids derived from Lgr5-EGFP mice were treated with 10 ng ml−1 BMP4 for 4 h, and then Lgr5+ stem cells were isolated by FACS and subjected to RNA-seq. Heatmap of RNA-seq data shows the downregulation of known ISC marker genes by BMP. (d) GO analysis of BMP-downregulated genes and BMP-upregulated genes in Lgr5+ stem cells, respectively. (e) GSEA revealed significant enrichment of ISC signature gene set with BMP-downregulated genes. ES, enrichment score; NES, normalized enrichment score. (f) Venn diagram showing the overlap between ISC signature genes with BMP-downregulated genes. (g) Quantitative RT–PCR analysis of stem cell signature gene expression in Lgr5+ stem cells sorted from mice with indicated genotypes at day 12. Data represent mean±s.e.m of n=5 mice. *P<0.05, **P<0.01, ***P<0.001 by Student's t-tests. Scale bars, 50 μm.
Figure 3 BMP directly suppresses the expression of Lgr5+ stem cell signature genes. (a) BMP signalling was activated for 36 h in intestinal organoids through direct BMP4 treatment or Noggin withdrawal from the normal culture medium containing EGF, Noggin and R-spondin after cell passaging. Lgr5+ stem cells (Lgr5-EGFP) and proliferating cells (Ki67+) were examined in the organoids. Nuclei were counter-stained with 4′,6-diamidino-2-phenylindole. Images are representative of three independent experiments. (b) Quantitative RT–PCR analysis of Lgr5, Axin2 and Id1 in intestinal organoids after BMP stimulation for indicated time. (c) The organoids derived from Lgr5-EGFP mice were treated with 10 ng ml−1 BMP4 for 4 h, and then Lgr5+ stem cells were isolated by FACS and subjected to RNA-seq. Heatmap of RNA-seq data shows the downregulation of known ISC marker genes by BMP. (d) GO analysis of BMP-downregulated genes and BMP-upregulated genes in Lgr5+ stem cells, respectively. (e) GSEA revealed significant enrichment of ISC signature gene set with BMP-downregulated genes. ES, enrichment score; NES, normalized enrichment score. (f) Venn diagram showing the overlap between ISC signature genes with BMP-downregulated genes. (g) Quantitative RT–PCR analysis of stem cell signature gene expression in Lgr5+ stem cells sorted from mice with indicated genotypes at day 12. Data represent mean±s.e.m of n=5 mice. *P<0.05, **P<0.01, ***P<0.001 by Student's t-tests. Scale bars, 50 μm.CC BY · PubMed Central
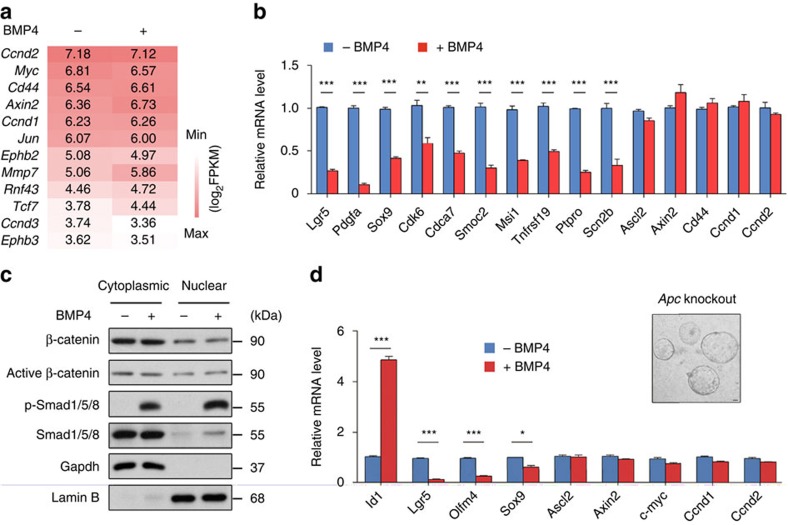
Figure 4 BMP activation has no direct inhibitory effects on Wnt signalling in Lgr5+ ISCs. (a) Heatmap showing the expression levels of several canonical Wnt target genes in Lgr5+ stem cells on BMP stimulation. (b) Quantitative RT–PCR verification of BMP-regulated genes and Wnt target genes in Lgr5+ stem cells. Data represent mean±s.e.m of n=3 independent experiments. ***P<0.001 by Student's t-tests. (c) Immunoblots of cytoplasmic and nuclear proteins from intestinal organoids treated with or without BMP4 for 4 h. Data are representative of three independent experiments. (d) Quantitative RT–PCR analysis of gene expression in Apc mutant organoids derived from intestinal tumours in Vil-cre;Apcwt/fl mice that were treated with or without BMP for 4 h. Data represent mean±s.e.m of three independent experiments. *P<0.05, **P<0.01, ***P<0.001 by Student's t-tests. Scale bar, 50 μm.
Figure 4 BMP activation has no direct inhibitory effects on Wnt signalling in Lgr5+ ISCs. (a) Heatmap showing the expression levels of several canonical Wnt target genes in Lgr5+ stem cells on BMP stimulation. (b) Quantitative RT–PCR verification of BMP-regulated genes and Wnt target genes in Lgr5+ stem cells. Data represent mean±s.e.m of n=3 independent experiments. ***P<0.001 by Student's t-tests. (c) Immunoblots of cytoplasmic and nuclear proteins from intestinal organoids treated with or without BMP4 for 4 h. Data are representative of three independent experiments. (d) Quantitative RT–PCR analysis of gene expression in Apc mutant organoids derived from intestinal tumours in Vil-cre;Apcwt/fl mice that were treated with or without BMP for 4 h. Data represent mean±s.e.m of three independent experiments. *P<0.05, **P<0.01, ***P<0.001 by Student's t-tests. Scale bar, 50 μm.CC BY · PubMed Central
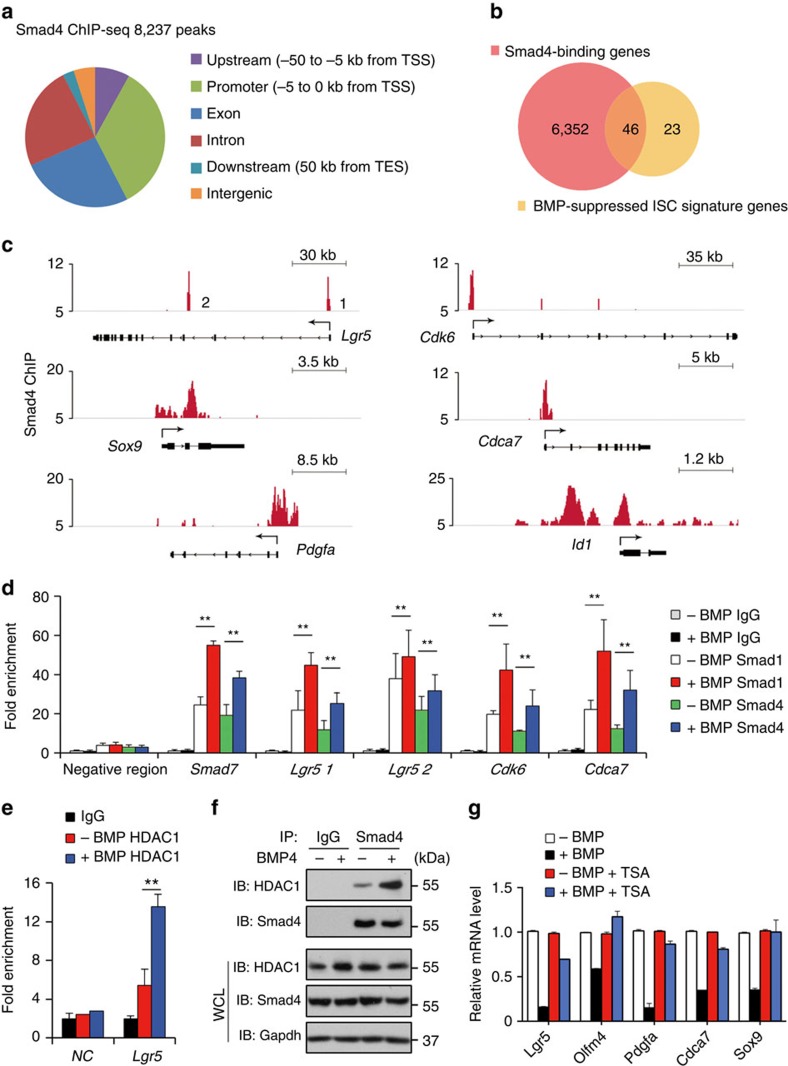
Figure 5 Smad proteins bind to the promoter regions of stem cell signature genes and recruit HDAC1 to repress transcription. (a) Genome-wide distribution of Smad4-binding sites in Lgr5+ stem cells. TES, transcription end site; TSS, transcription start site. (b) Venn diagram showing the overlap between BMP-downregulated signature genes with Smad4 bound genes. P=6.00E-12. (c) ChIP-seq signals for Smad4 binding at the representative genomic loci. Id1 served as a positive control. (d) Lgr5+ stem cells were stimulated with or without BMP4 for 4 h and subjected to ChIP assays with anti-Smad1, anti-Smad4 antibodies or control IgG. Quantitative RT–PCR followed ChIP shows the enrichment of Smad1 or Smad4 in the promoter or enhancer regions of indicated genes. Smad7 served as positive control. Data represent mean±s.e.m of three independent experiments. **P<0.01 by Student's t-test. (e) HDAC1 ChIP assays in Lgr5+ stem cells with or without 4 h BMP4 treatment. Data represent mean±s.e.m of three independent experiments. **P<0.01 by Student's t-test. (f) Intestinal organoids were treated with 10 ng ml−1 BMP4 for 4 h before being collected for immunoprecipitation (IP) with control IgG or anti-Smad4 antibody followed by western blotting. Protein expression was determined with whole-cell lysates (WCL). (g) Quantitative RT–PCR analysis of Lgr5, Olfm4, Pdgfa, Cdca7 and Sox9 in intestinal organoids after BMP stimulation in the presence or absence of 300 nM trichostatin A (TSA) for indicated time. For TSA treatment, the organoids were first pretreated with 300 nM TSA for 2.5 h. Data represent mean±s.e.m of three independent experiments.
Figure 5 Smad proteins bind to the promoter regions of stem cell signature genes and recruit HDAC1 to repress transcription. (a) Genome-wide distribution of Smad4-binding sites in Lgr5+ stem cells. TES, transcription end site; TSS, transcription start site. (b) Venn diagram showing the overlap between BMP-downregulated signature genes with Smad4 bound genes. P=6.00E-12. (c) ChIP-seq signals for Smad4 binding at the representative genomic loci. Id1 served as a positive control. (d) Lgr5+ stem cells were stimulated with or without BMP4 for 4 h and subjected to ChIP assays with anti-Smad1, anti-Smad4 antibodies or control IgG. Quantitative RT–PCR followed ChIP shows the enrichment of Smad1 or Smad4 in the promoter or enhancer regions of indicated genes. Smad7 served as positive control. Data represent mean±s.e.m of three independent experiments. **P<0.01 by Student's t-test. (e) HDAC1 ChIP assays in Lgr5+ stem cells with or without 4 h BMP4 treatment. Data represent mean±s.e.m of three independent experiments. **P<0.01 by Student's t-test. (f) Intestinal organoids were treated with 10 ng ml−1 BMP4 for 4 h before being collected for immunoprecipitation (IP) with control IgG or anti-Smad4 antibody followed by western blotting. Protein expression was determined with whole-cell lysates (WCL). (g) Quantitative RT–PCR analysis of Lgr5, Olfm4, Pdgfa, Cdca7 and Sox9 in intestinal organoids after BMP stimulation in the presence or absence of 300 nM trichostatin A (TSA) for indicated time. For TSA treatment, the organoids were first pretreated with 300 nM TSA for 2.5 h. Data represent mean±s.e.m of three independent experiments.CC BY · PubMed Central
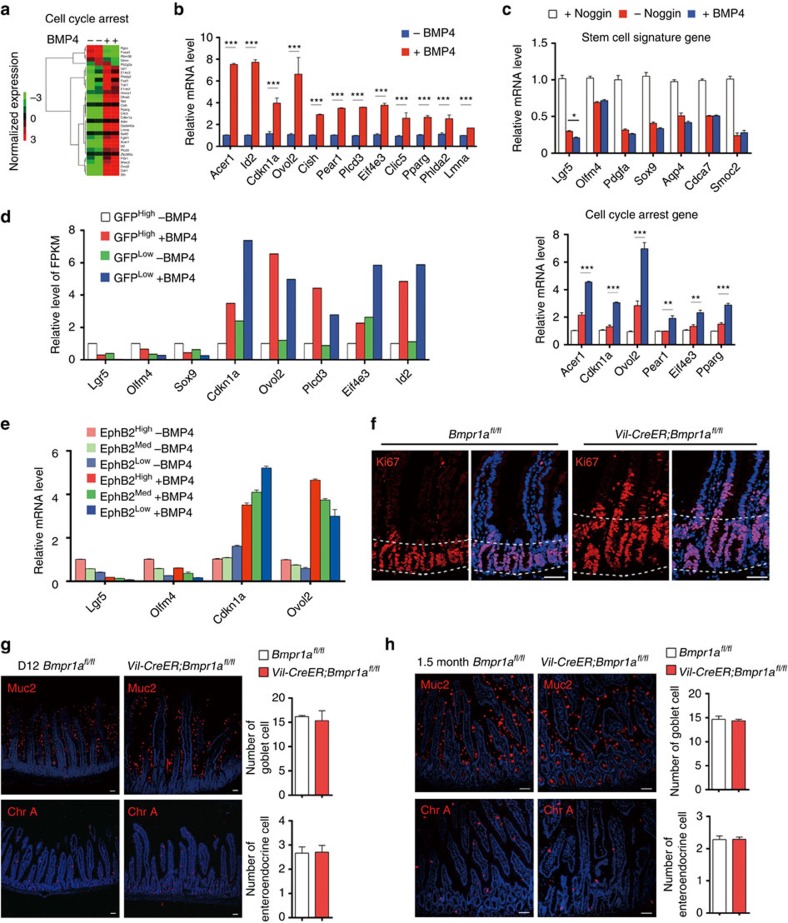
Figure 6 Low BMP activity restricts the self-renewal of Lgr5+ stem cells through modulating stem cell signature genes but not cell cycle arrest genes. (a) BMP-regulated genes in Lgr5+ stem cells after 4 h BMP stimulation were grouped into cell cycle arrest cluster. (b) The expression of the selected genes in the cell cycle arrest cluster were validated by quantitative RT–PCR in Lgr5+ stem cells sorted from intestinal organoids. Data represent mean±s.e.m of three independent experiments. **P<0.01, ***P<0.001 by Student's t-test. (c) The expression of the stem cell signature genes and cell cycle arrest genes were measured by quantitative RT–PCR in intestinal organoids from indicated groups after passaging. Data represent mean±s.e.m of three independent experiments. *P<0.05, **P<0.01, ***P<0.001 by Student's t-test. (d) Relative level of FPKM of indicated genes from Lgr5-GFPhigh and Lgr5-GFPlow cells with or without BMP treatment for 4 h. (e) The expression of the stem cell signature genes and cell cycle arrest genes were measured by quantitative RT–PCR in EphB2high, EphB2medium and EphB2low cells sorted from intestinal organoids treated with or without BMP4 for 4 h. Data represent mean±s.e.m of three independent experiments. (f) Immunofluorescence staining of Ki67 in Bmpr1afl/fl and Vil-CreER;Bmpr1afl/fl mice at day 12. Dotted lines delineate the region of crypts. Nuclei were counter-stained with 4′,6-diamidino-2-phenylindole (DAPI). Images are representative of n=6 mice per genotype. (g,h) Muc2 immunofluorescence staining and chromogranin A immunofluorescence staining in intestine from Vil-creER;Bmpr1afl/fl and Bmpr1afl/fl mice at day 12 (g) and 1.5 month after induction (h). Nuclei were counter-stained with DAPI. Images are representative of n=6 mice per genotype. Quantifications of goblet cell and enteroendocrine cell number are shown aside. Data represent mean±s.e.m of n=5 mice per genotype. Scale bars, 50 μm.
Figure 6 Low BMP activity restricts the self-renewal of Lgr5+ stem cells through modulating stem cell signature genes but not cell cycle arrest genes. (a) BMP-regulated genes in Lgr5+ stem cells after 4 h BMP stimulation were grouped into cell cycle arrest cluster. (b) The expression of the selected genes in the cell cycle arrest cluster were validated by quantitative RT–PCR in Lgr5+ stem cells sorted from intestinal organoids. Data represent mean±s.e.m of three independent experiments. **P<0.01, ***P<0.001 by Student's t-test. (c) The expression of the stem cell signature genes and cell cycle arrest genes were measured by quantitative RT–PCR in intestinal organoids from indicated groups after passaging. Data represent mean±s.e.m of three independent experiments. *P<0.05, **P<0.01, ***P<0.001 by Student's t-test. (d) Relative level of FPKM of indicated genes from Lgr5-GFPhigh and Lgr5-GFPlow cells with or without BMP treatment for 4 h. (e) The expression of the stem cell signature genes and cell cycle arrest genes were measured by quantitative RT–PCR in EphB2high, EphB2medium and EphB2low cells sorted from intestinal organoids treated with or without BMP4 for 4 h. Data represent mean±s.e.m of three independent experiments. (f) Immunofluorescence staining of Ki67 in Bmpr1afl/fl and Vil-CreER;Bmpr1afl/fl mice at day 12. Dotted lines delineate the region of crypts. Nuclei were counter-stained with 4′,6-diamidino-2-phenylindole (DAPI). Images are representative of n=6 mice per genotype. (g,h) Muc2 immunofluorescence staining and chromogranin A immunofluorescence staining in intestine from Vil-creER;Bmpr1afl/fl and Bmpr1afl/fl mice at day 12 (g) and 1.5 month after induction (h). Nuclei were counter-stained with DAPI. Images are representative of n=6 mice per genotype. Quantifications of goblet cell and enteroendocrine cell number are shown aside. Data represent mean±s.e.m of n=5 mice per genotype. Scale bars, 50 μm.CC BY · PubMed Central
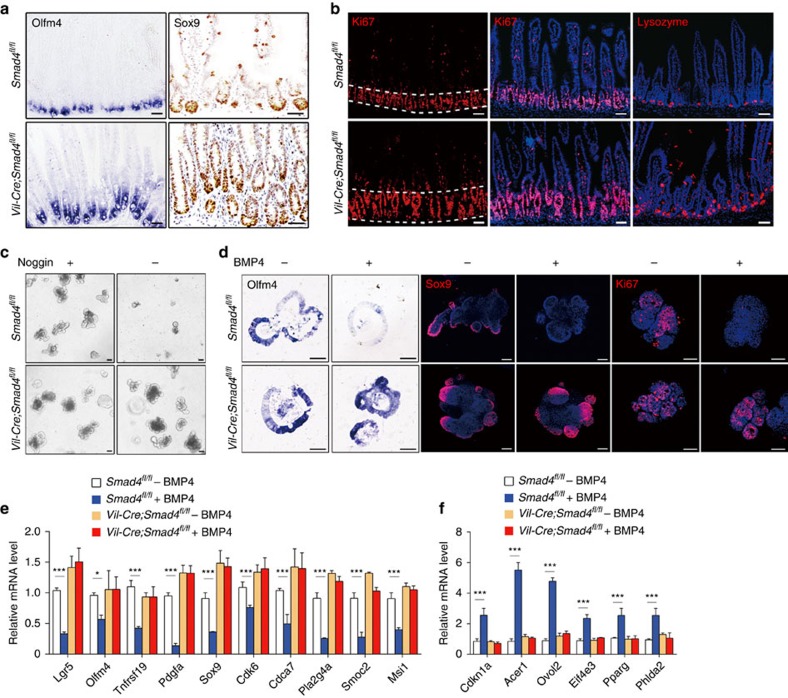
Figure 7 Smad4 mediates the negative regulation of BMP on Lgr5+ stem cell self-renewal. (a) Olfm4 in situ hybridization and Sox9 staining in intestines from 1-month-old Smad4fl/fl and Vil-Cre;Smad4fl/fl mice. Images are representative of n=5 mice per genotype. (b) Ki67 and lysozyme staining in intestines from 1-month-old Smad4fl/fl and Vil-Cre;Smad4fl/fl mice. Dotted lines delineate the region of crypts. Nuclei were counter-stained with 4′,6-diamidino-2-phenylindole (DAPI). Images are representative of n=5 mice per genotype. (c) Intestinal organoids derived from Smad4fl/fl and Smad4KO (Vil-Cre;Smad4fl/fl) mice were cultured in ENR (EGF, Noggin and R-spondin) or ER medium for 5 days and photographed. Images are representative of three independent experiments. (d) Intestinal organoids derived from Smad4fl/fl and Smad4KO (Vil-Cre;Smad4fl/fl) mice were treated with BMP4 for 36 h followed by Olfm4 in situ hybridization, Sox9 staining and Ki67 immunofluorescence staining. Nuclei were counter-stained with DAPI. Images are representative of three independent experiments. (e,f) Smad4fl/fl and Smad4KO (Vil-Cre;Smad4fl/fl) organoids were treated with BMP4 for 4 h and the mRNA level of indicated genes were measured by quantitative RT–PCR. Data represent mean±s.e.m of three independent experiments. *P<0.05, ***P<0.001 by Student's t-tests. Scale bars, 50 μm.
Figure 7 Smad4 mediates the negative regulation of BMP on Lgr5+ stem cell self-renewal. (a) Olfm4 in situ hybridization and Sox9 staining in intestines from 1-month-old Smad4fl/fl and Vil-Cre;Smad4fl/fl mice. Images are representative of n=5 mice per genotype. (b) Ki67 and lysozyme staining in intestines from 1-month-old Smad4fl/fl and Vil-Cre;Smad4fl/fl mice. Dotted lines delineate the region of crypts. Nuclei were counter-stained with 4′,6-diamidino-2-phenylindole (DAPI). Images are representative of n=5 mice per genotype. (c) Intestinal organoids derived from Smad4fl/fl and Smad4KO (Vil-Cre;Smad4fl/fl) mice were cultured in ENR (EGF, Noggin and R-spondin) or ER medium for 5 days and photographed. Images are representative of three independent experiments. (d) Intestinal organoids derived from Smad4fl/fl and Smad4KO (Vil-Cre;Smad4fl/fl) mice were treated with BMP4 for 36 h followed by Olfm4 in situ hybridization, Sox9 staining and Ki67 immunofluorescence staining. Nuclei were counter-stained with DAPI. Images are representative of three independent experiments. (e,f) Smad4fl/fl and Smad4KO (Vil-Cre;Smad4fl/fl) organoids were treated with BMP4 for 4 h and the mRNA level of indicated genes were measured by quantitative RT–PCR. Data represent mean±s.e.m of three independent experiments. *P<0.05, ***P<0.001 by Student's t-tests. Scale bars, 50 μm.CC BY · PubMed Central

Verification

Claims the paper makes

The claims and statistics of this paper haven’t been checked yet.

Run the check — free, no account needed. It reads the open-access text and checks the sources it cites.

A few free checks a day · papers already verified open instantly · results are public

Claims other papers make about this one

Each is checked against this paper’s own text: does it say what the citing paper says it does?

Self-check

Percentages, sums and reported differences re-computed from the paper’s own numbers.

The self-check needs the paper’s full text.

Citations

Cites

Show all 70 references

Cited by

Sorted by citations

See all 320

Metadata

Authors
Qi, Z., Li, Y., Zhao, B., Xu, C., Liu, Y., Li, H., Zhang, B., Wang, X., Yang, X., Xie, W., Li, B., Han, J.-D. J., & Chen, Y.-G.
Affiliations
  • Center for Life Sciences (CN)
  • Chinese Academy of Sciences (CN)
  • Tsinghua University (CN)
  • State Key Laboratory of Proteomics (CN)
  • Shanghai Jiao Tong University (CN)
Corresponding author
Chen, Ye-Guang
Venue
Nature Communications
Published
2017-01-06
Volume
8
Issue
1
Pages
13824-13824
ISSN
2041-1723 (ISSN-L)
OpenAlex
W2567946031
Cited by
320
References
70
Citations by year
2026: 18 · 2025: 35 · 2024: 41 · 2023: 39 · 2022: 41 · 2021: 46 · 2020: 42 · 2019: 24 · 2018: 26 · 2017: 8
FWCI
11.17
Type
journal article
Language
en
Open access
Locations
  • Nature Communications (publishedVersion, cc-by)
  • PubMed Central (publishedVersion, cc-by)
  • PubMed (publishedVersion)
  • RePEc: Research Papers in Economics (submittedVersion)
  • DOAJ (DOAJ: Directory of Open Access Journals) (submittedVersion, cc-by-sa)
Funders
  • National Natural Science Foundation of China (973 Program, 31330049, 91519310)
  • National Key Research and Development Program of China (31330049, 2013CB933700)
Topics
  • Life Sciences › Biochemistry, Genetics and Molecular Biology › Molecular Biology › TGF-β signaling in diseases
  • Life Sciences › Biochemistry, Genetics and Molecular Biology › Molecular Biology › Wnt/β-catenin signaling in development and cancer
  • Life Sciences › Biochemistry, Genetics and Molecular Biology › Molecular Biology › Developmental Biology and Gene Regulation
Keywords
BMP signaling, Lgr5+ stem cells, intestinal stem cells, stem cell self-renewal, HDAC1, transcriptional repression, intestinal homeostasis, epithelial hyperproliferation, intestinal epithelium
MeSH terms
Cell Self Renewal, Animals, Female, Gene Expression Regulation, Histone Deacetylases, Homeostasis, Intestines, Male, Mice, Inbred C57BL, Precancerous Conditions, Promoter Regions, Genetic, Protein Binding, Radiation, Ionizing, Regeneration, Stem Cells, Transcription, Genetic, Bone Morphogenetic Proteins, Gene Expression Profiling, Receptors, G-Protein-Coupled, Cell Proliferation, Wnt Proteins, beta Catenin, Smad Proteins, Cell Cycle Checkpoints, Wnt Signaling Pathway

About these checks

Registry, retraction, Cites and statistics results are computed, not judged, with one exception: a printed reference that no index lists is read once by a model before it counts as a citation error. Claims are extracted by a model and kept only when their quote appears verbatim in the text; each cited source is then checked, with a model’s help, for whether it says what the claim relies on. Those verdicts can be wrong — read the claim’s quote and the cited source before relying on one.

Statistics and arithmetic are recomputed, not judged.

Confidence bands are shown only for fields calibrated on our annotated test set. None is calibrated yet, so no band is shown.

What counts as a claim ›How we measure confidence ›How we check this ›

Are you an author, or do you see a problem with this page? Request a review