Student or educator? Sign up with your school email and get 6 months of Pro free.
Cited by 108

The DOI matches its Crossref record; 55 of the 55 references it cites were found in a registry or an index.

MicroRNA cluster miR-17-92 regulates multiple functionally related voltage-gated potassium channels in chronic neuropathic pain

Sakai, Atsushi, Saitow, Fumihito, Maruyama, Motoyo, Miyake, Noriko, Miyake, Koichi, Shimada, Takashi, Okada, Takashi, Suzuki, Hidenori·2017·Nature Communications

Abstract

miR-17-92 is a microRNA cluster with six distinct members. Here, we show that the miR-17-92 cluster and its individual members modulate chronic neuropathic pain. All cluster members are persistently upregulated in primary sensory neurons after nerve injury. Overexpression of miR-18a, miR-19a, miR-19b and miR-92a cluster members elicits mechanical allodynia in rats, while their blockade alleviates mechanical allodynia in a rat model of neuropathic pain. Plausible targets for the miR-17-92 cluster include genes encoding numerous voltage-gated potassium channels and their modulatory subunits. Single-cell analysis reveals extensive co-expression of miR-17-92 cluster and its predicted targets in primary sensory neurons. miR-17-92 downregulates the expression of potassium channels, and reduced outward potassium currents, in particular A-type currents. Combined application of potassium channel modulators synergistically alleviates mechanical allodynia induced by nerve injury or miR-17-92 overexpression. miR-17-92 cluster appears to cooperatively regulate the function of multiple voltage-gated potassium channel subunits, perpetuating mechanical allodynia.

Overview

The claims and statistics of this paper haven’t been checked yet.

Run the check — free, no account needed. It reads the open-access text and checks the sources it cites.

A few free checks a day · papers already verified open instantly · results are public

Integrity signals

Registry

Crossref · 10.1038/ncomms16079

Cites

55 of 55 references verified0 citation errors · 0 not checkable

Statistics

Figures

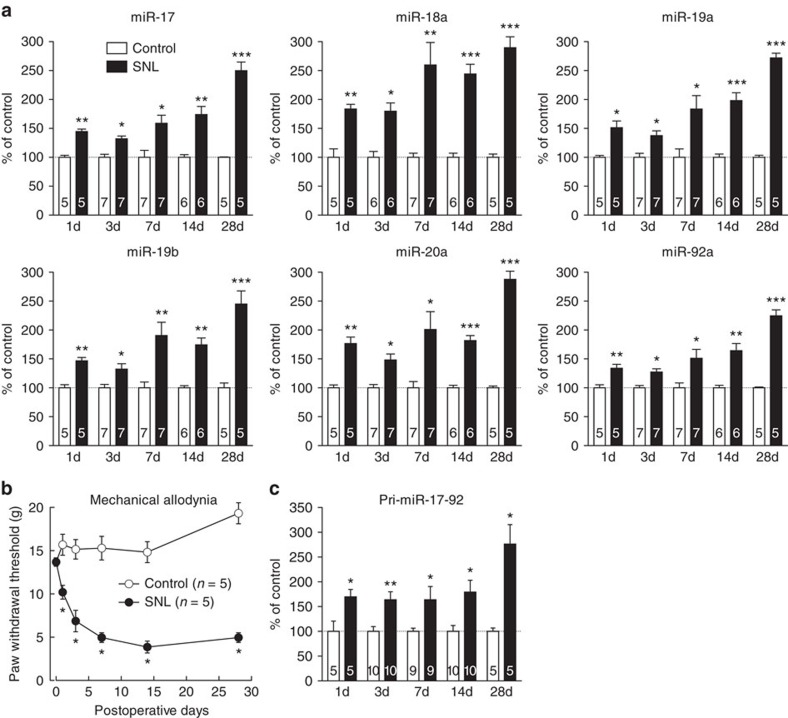
Figure 1 miR-17-92 cluster upregulation in L5 DRG neurons after nerve injury. (a,c) Change in expression of mature miRNAs of the miR-17-92 cluster (a) and primary transcripts of miR-17-92 (c) in the L5 DRG over time after SNL. Numbers of samples are indicated at the base of each bar. *P<0.05, **P<0.01 and ***P<0.001 (miR-17, P=0.002 for 1d, P=0.010 for 3d, P=0.017 for 7d, P=0.004 for 14d and P<0.001 for 28d; miR-18a, P=0.006 for 1d, P=0.011 for 3d, P=0.005 for 7d, P<0.001 for 14d and P<0.001 for 28d; miR-19a, P=0.017 for 1d, P=0.033 for 3d, P=0.022 for 7d, P<0.001 for 14d and P<0.001 for 28d; miR-19b, P=0.002 for 1d, P=0.049 for 3d, P=0.005 for 7d, P=0.002 for 14d and P<0.001 for 28d; miR-20a, P=0.008 for 1d, P=0.015 for 3d, P=0.020 for 7d, P<0.001 for 14d and P<0.001 for 28d; miR-92a, P=0.006 for 1d, P=0.016 for 3d, P=0.011 for 7d, P=0.002 for 14d and P<0.001 for 28d; pri-miR-17-92, P=0.043 for 1d, P=0.005 for 3d, P=0.048 for 7d, P=0.022 for 14d and P=0.011 for 28d) compared with the contralateral intact side, paired t-test. (b) Paw withdrawal responses to mechanical stimuli evaluated on the SNL and contralateral sides. Error bars are s.e.m. *P<0.05 (P=0.043 for 3d, P=0.042 for 7d, P=0.041 for 14d and P=0.039 for 28d) compared with the contralateral side, Mann–Whitney U test.
Figure 1 miR-17-92 cluster upregulation in L5 DRG neurons after nerve injury. (a,c) Change in expression of mature miRNAs of the miR-17-92 cluster (a) and primary transcripts of miR-17-92 (c) in the L5 DRG over time after SNL. Numbers of samples are indicated at the base of each bar. *P<0.05, **P<0.01 and ***P<0.001 (miR-17, P=0.002 for 1d, P=0.010 for 3d, P=0.017 for 7d, P=0.004 for 14d and P<0.001 for 28d; miR-18a, P=0.006 for 1d, P=0.011 for 3d, P=0.005 for 7d, P<0.001 for 14d and P<0.001 for 28d; miR-19a, P=0.017 for 1d, P=0.033 for 3d, P=0.022 for 7d, P<0.001 for 14d and P<0.001 for 28d; miR-19b, P=0.002 for 1d, P=0.049 for 3d, P=0.005 for 7d, P=0.002 for 14d and P<0.001 for 28d; miR-20a, P=0.008 for 1d, P=0.015 for 3d, P=0.020 for 7d, P<0.001 for 14d and P<0.001 for 28d; miR-92a, P=0.006 for 1d, P=0.016 for 3d, P=0.011 for 7d, P=0.002 for 14d and P<0.001 for 28d; pri-miR-17-92, P=0.043 for 1d, P=0.005 for 3d, P=0.048 for 7d, P=0.022 for 14d and P=0.011 for 28d) compared with the contralateral intact side, paired t-test. (b) Paw withdrawal responses to mechanical stimuli evaluated on the SNL and contralateral sides. Error bars are s.e.m. *P<0.05 (P=0.043 for 3d, P=0.042 for 7d, P=0.041 for 14d and P=0.039 for 28d) compared with the contralateral side, Mann–Whitney U test.CC BY · PubMed Central
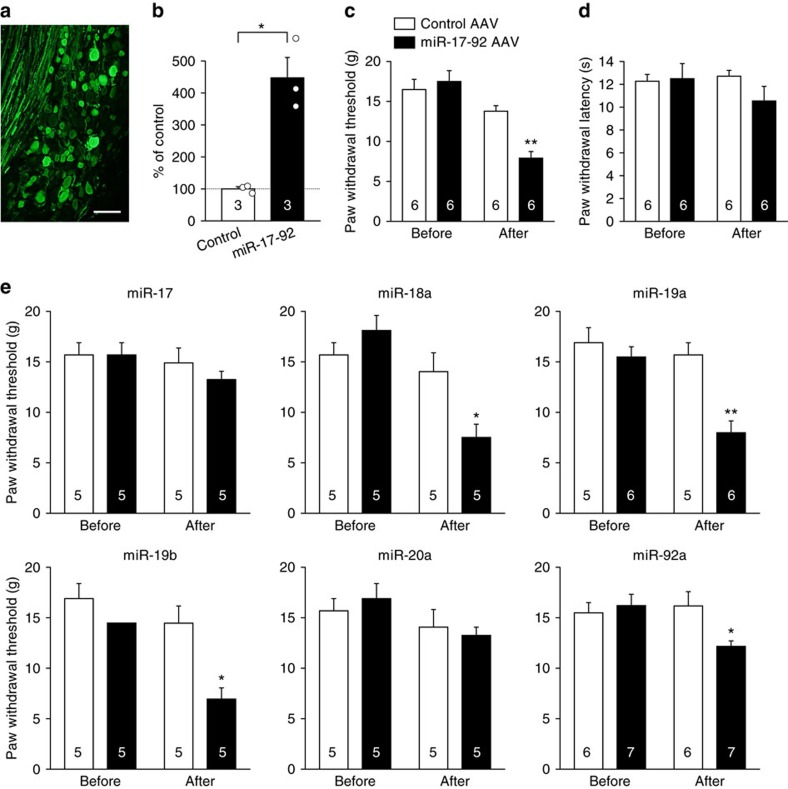
Figure 2 miR-17-92 cluster overexpression in DRG neurons causes mechanical allodynia. (a) Representative image of EGFP immunofluorescence in the L5 DRG 7 days after injection of the AAV vector encoding miR-17-92 and EGFP. Scale bar, 100 μm. (b) Expression levels of miR-17-92 primary transcript in L5 DRGs 7 days after control or miR-17-92 AAV vector injection. Numbers of samples are indicated at the base of each bar. *P=0.031 by Welch’s test. (c–e) Paw withdrawal threshold (c,e) and latencies (d) to mechanical and thermal stimuli, respectively, were evaluated on the injected sides before and 7 days after the injection of AAV vector encoding the whole miR-17-92 cluster (c,d) or individual miR-17-92 cluster members (e). Error bars are s.e.m. *P<0.05 and **P<0.01 (P=0.004 for miR-17-92; P=0.023 for miR-18a; P=0.004 for miR-19a; P=0.008 for miR-19b; P=0.014 for miR-92) compared with the control injection, Mann–Whitney U test.
Figure 2 miR-17-92 cluster overexpression in DRG neurons causes mechanical allodynia. (a) Representative image of EGFP immunofluorescence in the L5 DRG 7 days after injection of the AAV vector encoding miR-17-92 and EGFP. Scale bar, 100 μm. (b) Expression levels of miR-17-92 primary transcript in L5 DRGs 7 days after control or miR-17-92 AAV vector injection. Numbers of samples are indicated at the base of each bar. *P=0.031 by Welch’s test. (c–e) Paw withdrawal threshold (c,e) and latencies (d) to mechanical and thermal stimuli, respectively, were evaluated on the injected sides before and 7 days after the injection of AAV vector encoding the whole miR-17-92 cluster (c,d) or individual miR-17-92 cluster members (e). Error bars are s.e.m. *P<0.05 and **P<0.01 (P=0.004 for miR-17-92; P=0.023 for miR-18a; P=0.004 for miR-19a; P=0.008 for miR-19b; P=0.014 for miR-92) compared with the control injection, Mann–Whitney U test.CC BY · PubMed Central
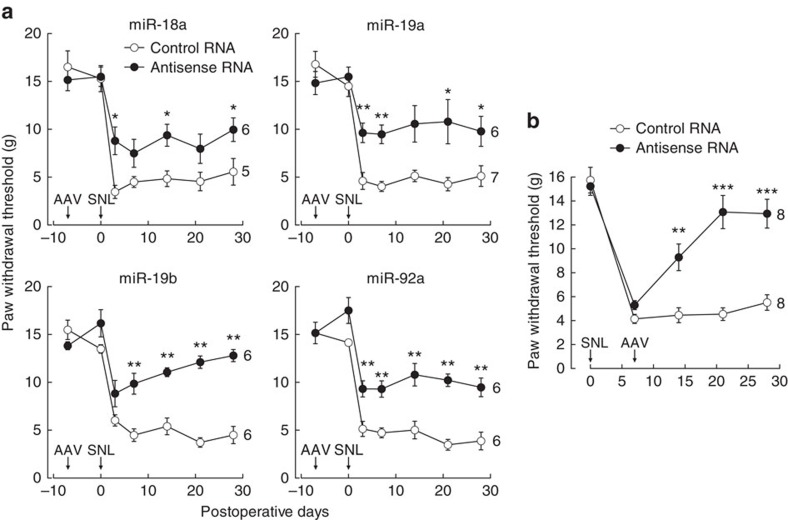
Figure 3 Blockade of miR-17-92 cluster members suppresses mechanical allodynia in SNL. Paw withdrawal responses to mechanical stimuli were evaluated on the AAV-injected/SNL side. Numbers of animals are indicated to the right of the plots. (a) AAV vector encoding control TuD antisense RNA or TuD antisense RNA against each miR-17-92 cluster member was administered to the L5 DRG 7 days before SNL (indicated by arrows). (b) Mixture of AAV vectors encoding TuD antisense RNAs against miR-18a, miR-19a, miR-19b and miR-92a was administered to the L5 DRG 7 days after SNL (indicated by arrows). Error bars are s.e.m. *P<0.05, **P<0.01 and ***P<0.001 (miR-18a, P=0.011 for 3d, P=0.030 for 14d and P=0.030 for 28d; miR-19a, P=0.008 for 3d, P=0.002 for 7d; P=0.014 for 21d and P=0.035 for 28d; miR-19b, P=0.004 for 7d, P=0.002 for 14d, P=0.002 for 21d and P=0.002 for 28d; miR-92a, P=0.002 for 3d, P=0.002 for 7d, P=0.009 for 14d, P=0.002 for 21d and P=0.004 for 28d; antisense RNA mixture, P=0.003 for 14d, P<0.001 for 21d and P<0.001 for 28d) compared with the control injection, Mann–Whitney U test.
Figure 3 Blockade of miR-17-92 cluster members suppresses mechanical allodynia in SNL. Paw withdrawal responses to mechanical stimuli were evaluated on the AAV-injected/SNL side. Numbers of animals are indicated to the right of the plots. (a) AAV vector encoding control TuD antisense RNA or TuD antisense RNA against each miR-17-92 cluster member was administered to the L5 DRG 7 days before SNL (indicated by arrows). (b) Mixture of AAV vectors encoding TuD antisense RNAs against miR-18a, miR-19a, miR-19b and miR-92a was administered to the L5 DRG 7 days after SNL (indicated by arrows). Error bars are s.e.m. *P<0.05, **P<0.01 and ***P<0.001 (miR-18a, P=0.011 for 3d, P=0.030 for 14d and P=0.030 for 28d; miR-19a, P=0.008 for 3d, P=0.002 for 7d; P=0.014 for 21d and P=0.035 for 28d; miR-19b, P=0.004 for 7d, P=0.002 for 14d, P=0.002 for 21d and P=0.002 for 28d; miR-92a, P=0.002 for 3d, P=0.002 for 7d, P=0.009 for 14d, P=0.002 for 21d and P=0.004 for 28d; antisense RNA mixture, P=0.003 for 14d, P<0.001 for 21d and P<0.001 for 28d) compared with the control injection, Mann–Whitney U test.CC BY · PubMed Central
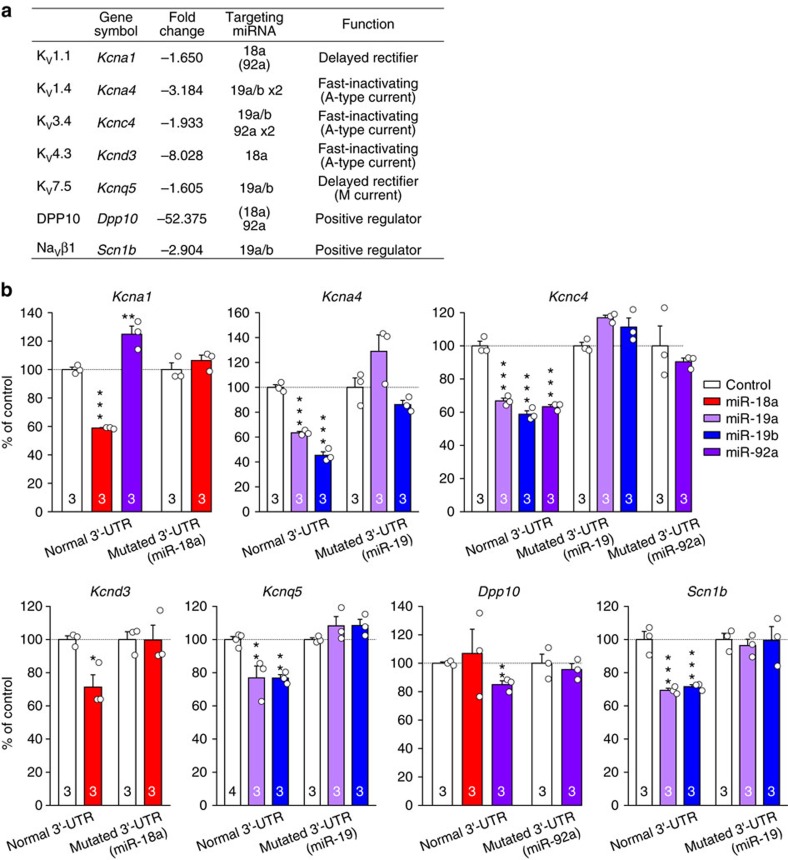
Figure 4 miR-17-92 cluster members differentially target the 3′-UTR sequences of voltage-gated potassium channels and modulatory subunits. (a) List of voltage-gated potassium channel subunits predicted as miR-17-92 target genes; these subunits were reportedly downregulated in a previous microarray study of SNL20. Parenthesized targeting miRNAs represent predicted miRNAs not validated by a luciferase assay. (b) Activities of luciferase with voltage-gated potassium channel subunit 3′-UTRs or mutated 3′-UTRs in HEK293 cells co-transfected with control or miR-17-92 cluster member-expressing plasmid vector. Numbers of cell cultures are indicated at the base of each bar. Error bars are s.e.m. *P<0.05, **P<0.01 and ***P<0.001 (Kcna1, P<0.001 for miR-18a and P=0.004 for miR-92a; Kcna4, P<0.001 for miR-19a and P<0.001 for miR-19b; Kcnc4, P<0.001 for miR-19a, P<0.001 for miR-19b and P<0.001 for miR-92a; Kcnd3, P=0.021 for miR-18a; Kcnq5, P=0.008 for miR-19a and P=0.008 for miR-19b; Dpp10, P=0.006 for miR-92a; Scn1b, P<0.001 for miR-19a and P<0.001 for miR-19b) compared with control plasmid, unpaired t-test or Dunnett’s test.
Figure 4 miR-17-92 cluster members differentially target the 3′-UTR sequences of voltage-gated potassium channels and modulatory subunits. (a) List of voltage-gated potassium channel subunits predicted as miR-17-92 target genes; these subunits were reportedly downregulated in a previous microarray study of SNL20. Parenthesized targeting miRNAs represent predicted miRNAs not validated by a luciferase assay. (b) Activities of luciferase with voltage-gated potassium channel subunit 3′-UTRs or mutated 3′-UTRs in HEK293 cells co-transfected with control or miR-17-92 cluster member-expressing plasmid vector. Numbers of cell cultures are indicated at the base of each bar. Error bars are s.e.m. *P<0.05, **P<0.01 and ***P<0.001 (Kcna1, P<0.001 for miR-18a and P=0.004 for miR-92a; Kcna4, P<0.001 for miR-19a and P<0.001 for miR-19b; Kcnc4, P<0.001 for miR-19a, P<0.001 for miR-19b and P<0.001 for miR-92a; Kcnd3, P=0.021 for miR-18a; Kcnq5, P=0.008 for miR-19a and P=0.008 for miR-19b; Dpp10, P=0.006 for miR-92a; Scn1b, P<0.001 for miR-19a and P<0.001 for miR-19b) compared with control plasmid, unpaired t-test or Dunnett’s test.CC BY · PubMed Central
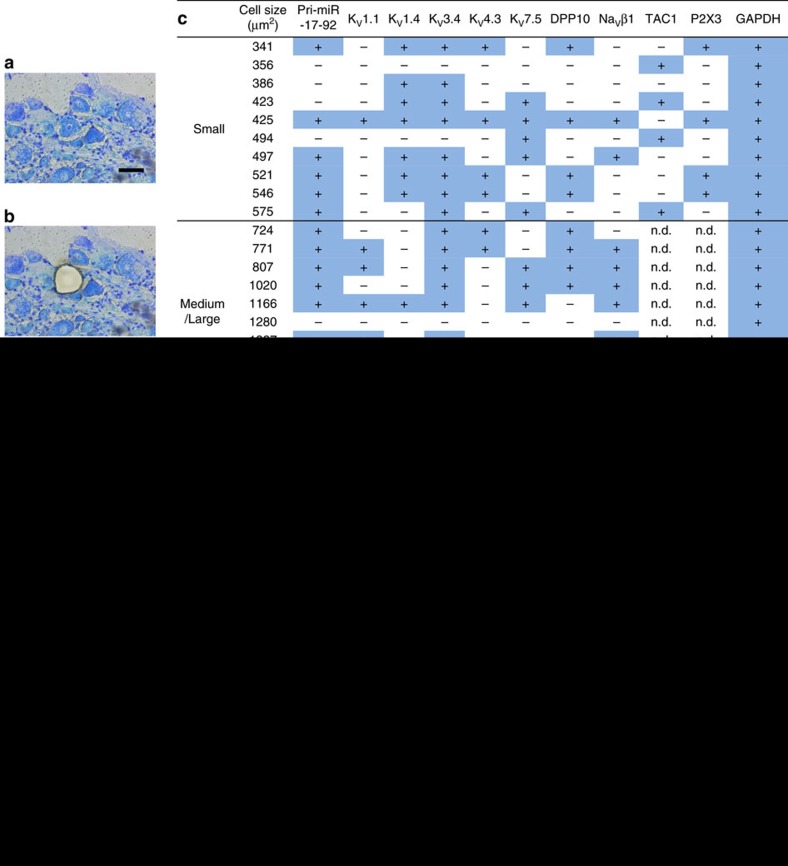
Figure 5 miR-17-92 cluster members differentially inhibit expression of voltage-gated potassium channel subunits in vivo. (a,b) Representative images of L5 DRG stained with toluidine blue before (a) and after (b) laser-captured microdissection. Scale bar, 50 μm. (c) Expression profile of pri-miR-17-92 and voltage-gated potassium channel subunits in a single DRG neuron of indicated cell size; DRG neurons<600 μm2 and >600 μm2 were considered to be small and medium/large neurons, respectively. n.d.; not determined. (d) Expression of voltage-gated potassium channel subunit mRNAs examined in the L5 DRG 7 days after control or miR-17-92 AAV vector administration. Numbers of samples are indicated at the base of each bar. Error bars are s.e.m. *P<0.05, **P<0.01 and ***P<0.001 (KV1.1, P=0.014 for miR-17-92 and P=0.034 for miR-18a; KV1.4, P<0.001 for miR-17-92; KV3.4, P<0.001 for miR-17-92, P=0.047 for miR-19b and P=0.009 for miR-92a; KV4.3, P=0.031 for miR-17-92; KV7.5, P=0.002 for miR-17-92, P=0.048 for miR-19a and P=0.013 for miR-19b; DPP10, P=0.003 for miR-17-92 and P=0.043 for miR-92a; NaVβ1, P=0.002 for miR-17-92 and P=0.030 for miR-19b), Dunnett’s test.
Figure 5 miR-17-92 cluster members differentially inhibit expression of voltage-gated potassium channel subunits in vivo. (a,b) Representative images of L5 DRG stained with toluidine blue before (a) and after (b) laser-captured microdissection. Scale bar, 50 μm. (c) Expression profile of pri-miR-17-92 and voltage-gated potassium channel subunits in a single DRG neuron of indicated cell size; DRG neurons<600 μm2 and >600 μm2 were considered to be small and medium/large neurons, respectively. n.d.; not determined. (d) Expression of voltage-gated potassium channel subunit mRNAs examined in the L5 DRG 7 days after control or miR-17-92 AAV vector administration. Numbers of samples are indicated at the base of each bar. Error bars are s.e.m. *P<0.05, **P<0.01 and ***P<0.001 (KV1.1, P=0.014 for miR-17-92 and P=0.034 for miR-18a; KV1.4, P<0.001 for miR-17-92; KV3.4, P<0.001 for miR-17-92, P=0.047 for miR-19b and P=0.009 for miR-92a; KV4.3, P=0.031 for miR-17-92; KV7.5, P=0.002 for miR-17-92, P=0.048 for miR-19a and P=0.013 for miR-19b; DPP10, P=0.003 for miR-17-92 and P=0.043 for miR-92a; NaVβ1, P=0.002 for miR-17-92 and P=0.030 for miR-19b), Dunnett’s test.CC BY · PubMed Central
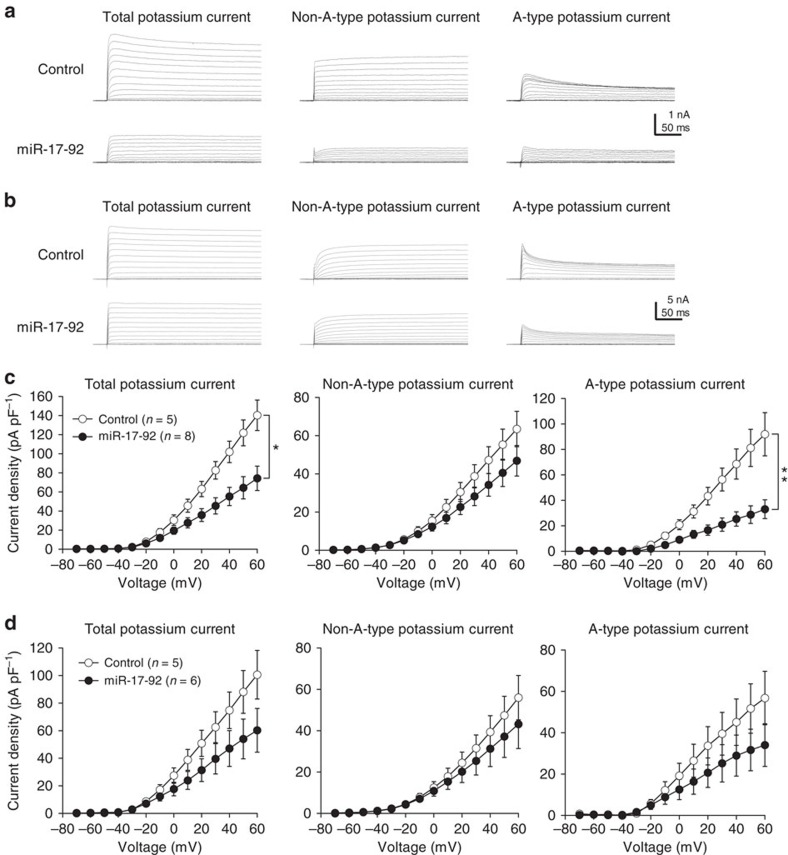
Figure 6 miR-17-92 reduces potassium currents in DRG neurons. Potassium currents were recorded in acutely-dissociated DRG neurons 7 days after control or miR-17-92 AAV vector injection. Only EGFP-fluorescent DRG neurons were recorded. (a,b) Representative traces of total, non-A-type and A-type potassium currents elicited by stepwise depolarization from −70 to 60 mV at holding potential of −80 mV in small (a) and medium/large (b) DRG neurons. (c,d) Current density of each potassium current component plotted against voltage in small (c) and medium/large (d) DRG neurons obtained from three rats. Error bars are s.e.m. *P=0.016 and **P=0.003, two-way repeated-measures ANOVA.
Figure 6 miR-17-92 reduces potassium currents in DRG neurons. Potassium currents were recorded in acutely-dissociated DRG neurons 7 days after control or miR-17-92 AAV vector injection. Only EGFP-fluorescent DRG neurons were recorded. (a,b) Representative traces of total, non-A-type and A-type potassium currents elicited by stepwise depolarization from −70 to 60 mV at holding potential of −80 mV in small (a) and medium/large (b) DRG neurons. (c,d) Current density of each potassium current component plotted against voltage in small (c) and medium/large (d) DRG neurons obtained from three rats. Error bars are s.e.m. *P=0.016 and **P=0.003, two-way repeated-measures ANOVA.CC BY · PubMed Central
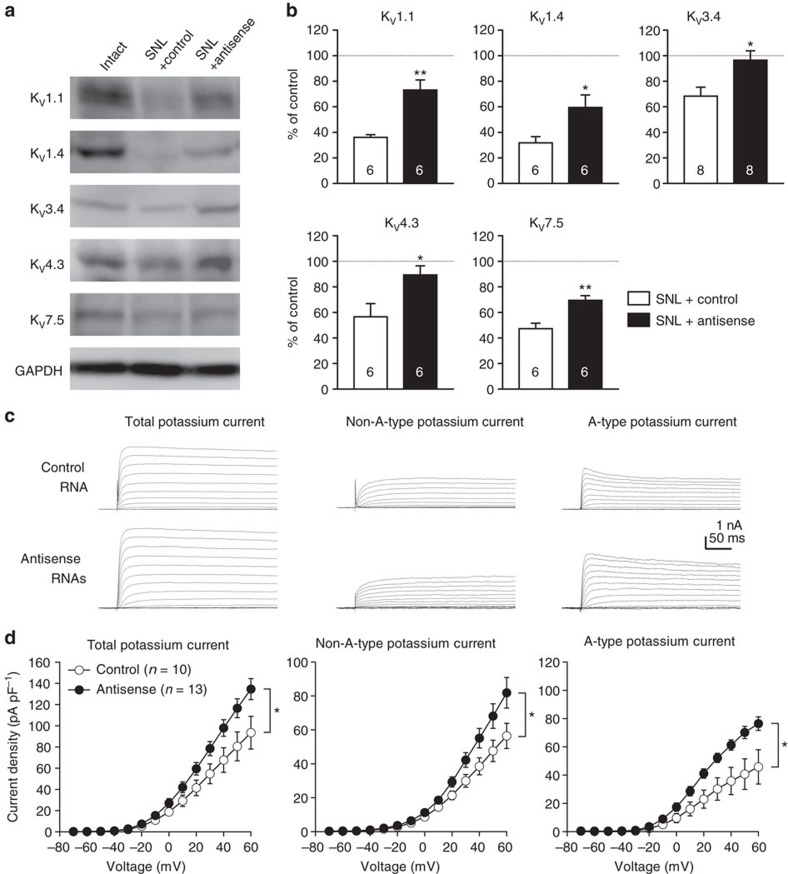
Figure 7 miR-17-92 inhibition rescues potassium channel expressions and potassium currents in DRG neurons in the neuropathic pain state. (a) Representative images of immunoblotting for voltage-gated potassium channel α subunits in the L5 DRG obtained from SNL rats at day 28. Full blots can be found in the Supplementary Fig. 12. AAV vectors expressing either a control AAV vector or mixture of AAV vectors encoding TuD antisense RNAs against miR-18a, miR-19a, miR-19b and miR-92a were administered 7 days after SNL. GAPDH was used as a loading standard. (b) Expression levels of voltage-gated potassium channel protein, as a percentage of expression level in intact L5 DRG. Numbers of samples are indicated at the base of each bar. *P<0.05 and **P<0.01 (P=0.004 for KV1.1; P=0.038 for KV1.4; P=0.015 for KV3.4; P=0.028 for KV4.3; P=0.003 for KV7.5), Welch’s test. (c,d) Potassium currents were recorded in acutely-dissociated DRG neurons 7 days after SNL. Control AAV vector or AAV vector mixture was injected 7 days before SNL. Only EGFP-fluorescent DRG neurons were recorded. (c) Representative traces of total, non-A-type and A-type potassium currents elicited by stepwise depolarization from −70 to 60 mV at a holding potential of −80 mV in small DRG neurons. (d) Current density of each potassium current component plotted against voltage in small DRG neurons obtained from three rats. Error bars are s.e.m. *P<0.05 (P=0.045 for total current; P=0.046 for non-A-type current; P=0.015 for A-type current), two-way repeated-measures ANOVA.
Figure 7 miR-17-92 inhibition rescues potassium channel expressions and potassium currents in DRG neurons in the neuropathic pain state. (a) Representative images of immunoblotting for voltage-gated potassium channel α subunits in the L5 DRG obtained from SNL rats at day 28. Full blots can be found in the Supplementary Fig. 12. AAV vectors expressing either a control AAV vector or mixture of AAV vectors encoding TuD antisense RNAs against miR-18a, miR-19a, miR-19b and miR-92a were administered 7 days after SNL. GAPDH was used as a loading standard. (b) Expression levels of voltage-gated potassium channel protein, as a percentage of expression level in intact L5 DRG. Numbers of samples are indicated at the base of each bar. *P<0.05 and **P<0.01 (P=0.004 for KV1.1; P=0.038 for KV1.4; P=0.015 for KV3.4; P=0.028 for KV4.3; P=0.003 for KV7.5), Welch’s test. (c,d) Potassium currents were recorded in acutely-dissociated DRG neurons 7 days after SNL. Control AAV vector or AAV vector mixture was injected 7 days before SNL. Only EGFP-fluorescent DRG neurons were recorded. (c) Representative traces of total, non-A-type and A-type potassium currents elicited by stepwise depolarization from −70 to 60 mV at a holding potential of −80 mV in small DRG neurons. (d) Current density of each potassium current component plotted against voltage in small DRG neurons obtained from three rats. Error bars are s.e.m. *P<0.05 (P=0.045 for total current; P=0.046 for non-A-type current; P=0.015 for A-type current), two-way repeated-measures ANOVA.CC BY · PubMed Central
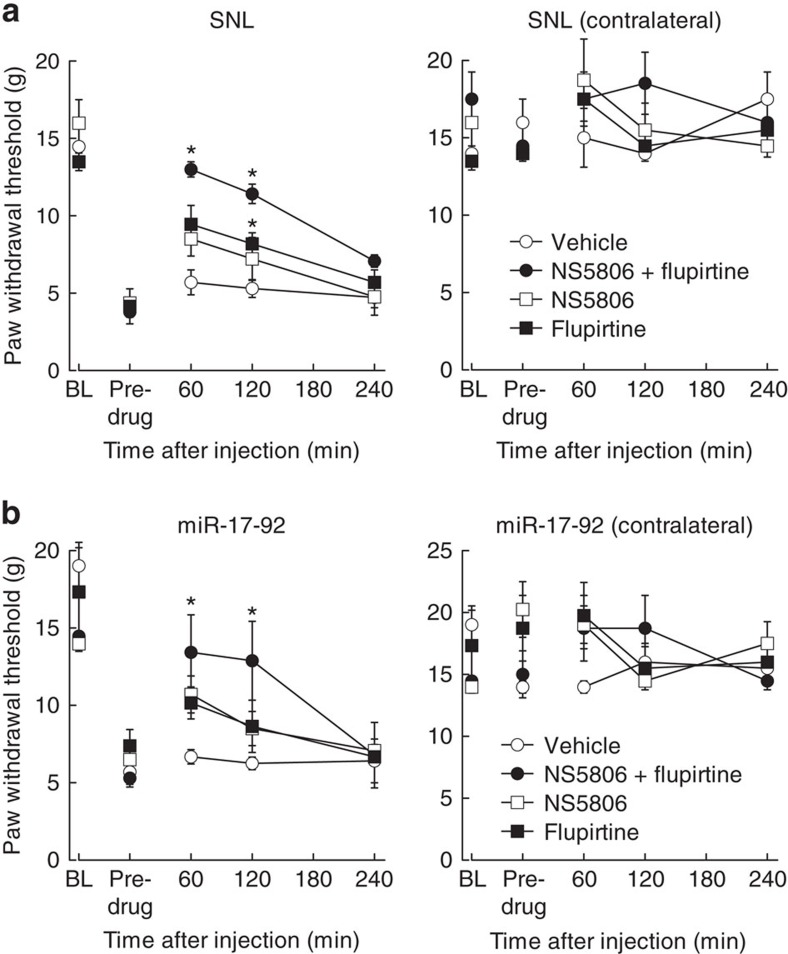
Figure 8 Combined administration of potassium channel modulators potently alleviated mechanical allodynia induced by miR-17-92 or SNL. Paw withdrawal responses to mechanical stimuli were evaluated on the SNL (a) and AAV-injected (b) sides and the contralateral sides (n=4). NS-5806, flupirtine or both were administered intraperitoneally 7 days after SNL; the same volume of vehicle was injected as a control. Rats were examined before SNL or AAV injection (BL), and before and after drug administration. Error bars are s.e.m. *P<0.05 compared with vehicle, Steel test.
Figure 8 Combined administration of potassium channel modulators potently alleviated mechanical allodynia induced by miR-17-92 or SNL. Paw withdrawal responses to mechanical stimuli were evaluated on the SNL (a) and AAV-injected (b) sides and the contralateral sides (n=4). NS-5806, flupirtine or both were administered intraperitoneally 7 days after SNL; the same volume of vehicle was injected as a control. Rats were examined before SNL or AAV injection (BL), and before and after drug administration. Error bars are s.e.m. *P<0.05 compared with vehicle, Steel test.CC BY · PubMed Central

Verification

Claims the paper makes

The claims and statistics of this paper haven’t been checked yet.

Run the check — free, no account needed. It reads the open-access text and checks the sources it cites.

A few free checks a day · papers already verified open instantly · results are public

Claims other papers make about this one

Each is checked against this paper’s own text: does it say what the citing paper says it does?

Self-check

Percentages, sums and reported differences re-computed from the paper’s own numbers.

The self-check needs the paper’s full text.

Citations

Cites

Show all 55 references

Cited by

Metadata

Authors
Sakai, A., Saitow, F., Maruyama, M., Miyake, N., Miyake, K., Shimada, T., Okada, T., & Suzuki, H.
Venue
Nature Communications
Published
2017-07-05
Volume
8
Issue
1
ISSN
2041-1723
Cited by
108
References
55
Language
en
Licence

About these checks

Registry, retraction, Cites and statistics results are computed, not judged, with one exception: a printed reference that no index lists is read once by a model before it counts as a citation error. Claims are extracted by a model and kept only when their quote appears verbatim in the text; each cited source is then checked, with a model’s help, for whether it says what the claim relies on. Those verdicts can be wrong — read the claim’s quote and the cited source before relying on one.

Statistics and arithmetic are recomputed, not judged.

Confidence bands are shown only for fields calibrated on our annotated test set. None is calibrated yet, so no band is shown.

What counts as a claim ›How we measure confidence ›How we check this ›

Are you an author, or do you see a problem with this page? Request a review

Data sources

Bibliographic data: Semantic Scholar, OpenAlex, Crossref.

Contains information from the Semantic Scholar Academic Graph Datasets, made available under the ODC Attribution License (ODC-BY 1.0).

Semantic Scholar’s data is described in: Kinney, R., et al. (2023). The Semantic Scholar Open Data Platform. arXiv:2301.10140.