

Decoding tumour phenotype by noninvasive imaging using a quantitative radiomics approach
Open accessThe DOI matches its Crossref record; 29 of the 29 references it cites were found in a registry or an index.
Abstract
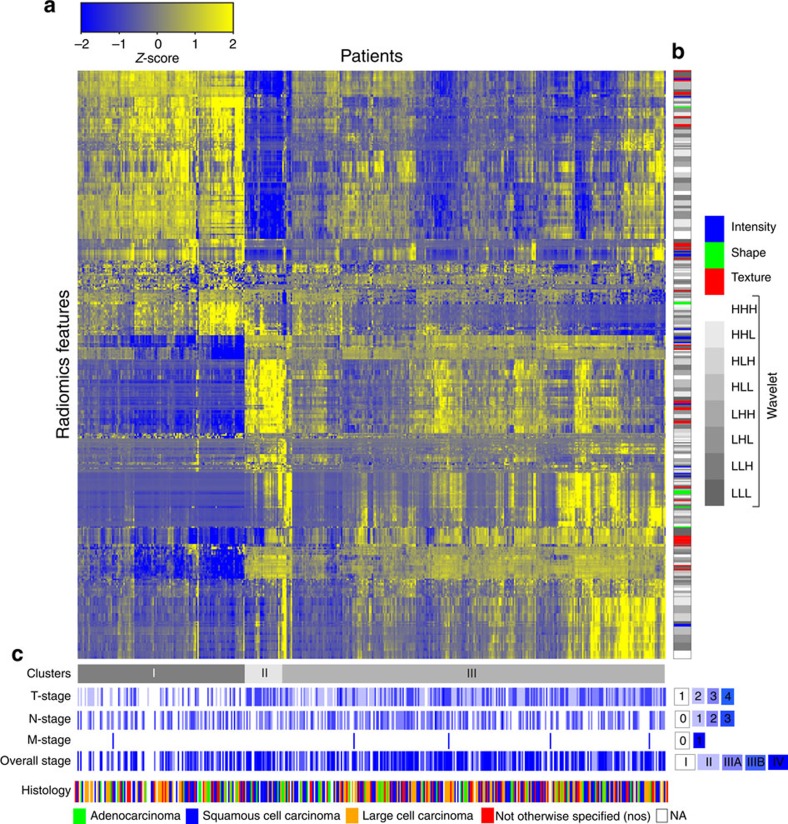
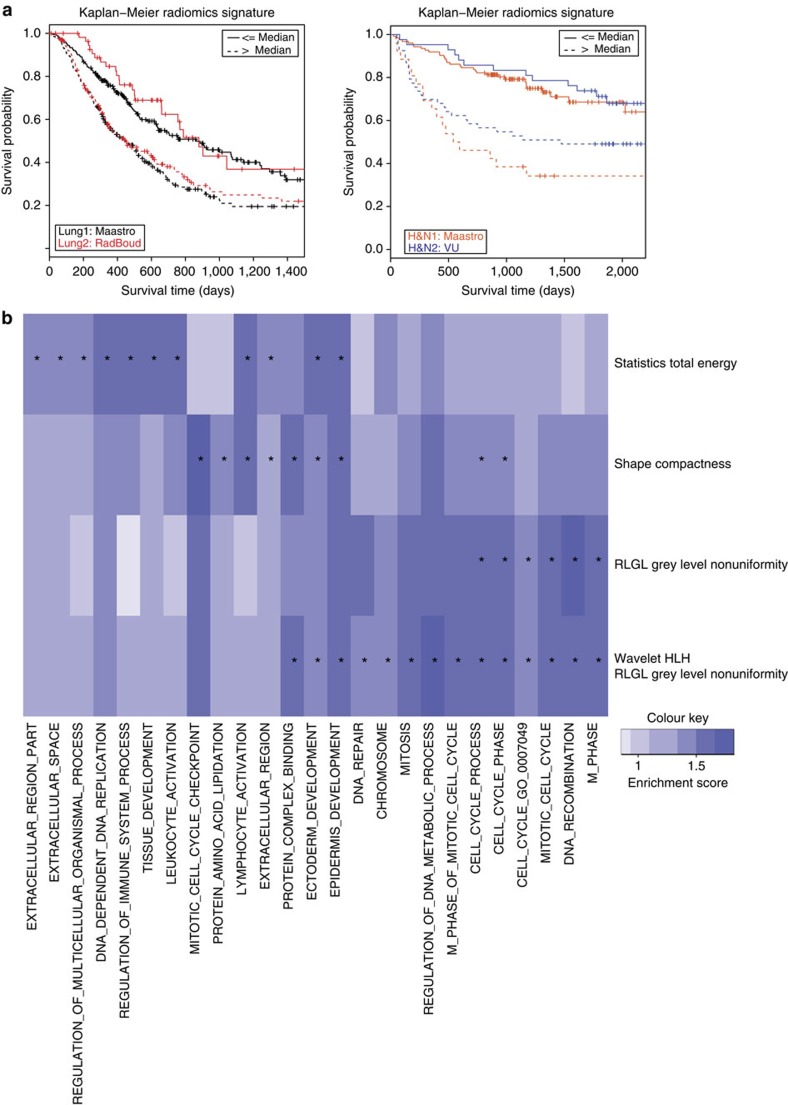
Human cancers exhibit strong phenotypic differences that can be visualized noninvasively by medical imaging. Radiomics refers to the comprehensive quantification of tumour phenotypes by applying a large number of quantitative image features. Here we present a radiomic analysis of 440 features quantifying tumour image intensity, shape and texture, which are extracted from computed tomography data of 1,019 patients with lung or head-and-neck cancer. We find that a large number of radiomic features have prognostic power in independent data sets of lung and head-and-neck cancer patients, many of which were not identified as significant before. Radiogenomics analysis reveals that a prognostic radiomic signature, capturing intratumour heterogeneity, is associated with underlying gene-expression patterns. These data suggest that radiomics identifies a general prognostic phenotype existing in both lung and head-and-neck cancer. This may have a clinical impact as imaging is routinely used in clinical practice, providing an unprecedented opportunity to improve decision-support in cancer treatment at low cost.
Overview
The claims and statistics of this paper haven’t been checked yet.
Free: it reads the open-access text and checks the first 5 claims that cite a source we can check. Create a free account to check every claim.
Integrity signals
Registry
Cites
Statistics
Figures


Verification
Claims the paper makes
The claims and statistics of this paper haven’t been checked yet.
Free: it reads the open-access text and checks the first 5 claims that cite a source we can check. Create a free account to check every claim.
Claims other papers make about this one
Each is checked against this paper’s own text: does it say what the citing paper says it does?
The source backs part of the claim, not all of it — or backs it for a different population, condition or comparison.
In the citing paper
“Notably, the signature was comprised of the top features from four classes (size, shape, texture, and wavelets) that were prioritized from a database of 442 features by using test-retest reproducibility and intersubject range.”
From Radiomics: Images Are More than Pictures, They Are Data (2016) · cites this paper as [47]
Experimental — accuracy not yet measuredThe source backs part of the claim, not all of it — or backs it for a different population, condition or comparison.
In the citing paper
“Many studies have shown that imaging features are significantly associated with patterns of gene expression and genetic mutations, demonstrating that radiogenomic analysis can identify different biological mechanisms by means of mathematical and computational devices, enabling the decoding of disease phenotypes by noninvasive methods(48,49).”
From Artificial intelligence, machine learning, computer-aided diagnosis, and radiomics: advances in imaging towards to precision medicine (2019) · cites this paper as [49]
Experimental — accuracy not yet measuredThe cited source says what the claim attributes to it.
In the citing paper
“A study by Aerts et al (47) showed that a radiomic signature could be used to predict outcome in completely independent cohorts of patients with lung cancer from two separate institutions.”
From Radiomics: Images Are More than Pictures, They Are Data (2016) · cites this paper as [47]
The cited source says what the claim attributes to it.
In the citing paper
“Further, this same signature could be applied to cohorts of patients with head and neck cancer with equivalent prognostic power.”
From Radiomics: Images Are More than Pictures, They Are Data (2016) · cites this paper as [47]
In the citing paper
“We used scans from 26 patients from the RIDER dataset19, routinely used for test–retest robustness analysis in tumour imaging19–21.”
From Foundation Model for Cancer Imaging Biomarkers (2024) · cites this paper as [20]
3 more claims about this paper
Create a free account to see every claim other papers make about this one.
Self-check
Percentages, sums and reported differences re-computed from the paper’s own numbers.
The self-check needs the paper’s full text.
Citations
Cites
Subramanian, A., Tamayo, P., Mootha, V. K., Mukherjee, S., Ebert, B. L., Gillette, M. A., Paulovich, A., Pomeroy, S. L., Golub, T. R., Lander, E. S., et al. (2005) · Proceedings of the National Academy of Sciences · doi:10.1073/pnas.0506580102 · Cited by 53,625
Harrell, F. E. (2001) · Springer Series in Statistics · doi:10.1007/978-1-4757-3462-1 · Cited by 9,195
Intratumor Heterogeneity and Branched Evolution Revealed by Multiregion Sequencing
Gerlinger, M., Rowan, A. J., Horswell, S., Larkin, J., Endesfelder, D., Gronroos, E., Martinez, P., Matthews, N., Stewart, A., Tarpey, P., et al. (2012) · New England Journal of Medicine · doi:10.1056/nejmoa1113205 · Cited by 7,774 · cited 2×
“It is known that multiple subclonal populations coexist within tumours, reflecting extensive intratumoral ‘somatic evolution’ 15,16 .”
BackgroundMolecular signatures database (MSigDB) 3.0
Liberzon, A., Subramanian, A., Pinchback, R., Thorvaldsdóttir, H., Tamayo, P., & Mesirov, J. P. (2011) · Bioinformatics · doi:10.1093/bioinformatics/btr260 · Cited by 7,111
Harrell (2015) · Springer Series in Statistics · doi:10.1007/978-3-319-19425-7 · Cited by 6,878
Radiomics: extracting more information from medical images using advanced feature analysis
Lambin, P., Rios-Velazquez, E., Leijenaar, R., Carvalho, S., van Stiphout, R. G. P. M., Granton, P., Zegers, C. M. L., Gillies, R., Boellard, R., Dekker, A., et al. (2012) · European Journal of Cancer · doi:10.1016/j.ejca.2011.11.036 · Cited by 6,084
Self-citationDistant metastasis occurs late during the genetic evolution of pancreatic cancer
Yachida, S., Jones, S., Bozic, I., Antal, T., Leary, R., Fu, B., Kamiyama, M., Hruban, R. H., Eshleman, J. R., Nowak, M. A., et al. (2010) · Nature · doi:10.1038/nature09515 · Cited by 2,502 · cited 1×
“It is known that multiple subclonal populations coexist within tumours, reflecting extensive intratumoral ‘somatic evolution’ 15,16 .”
BackgroundRadiomics: the process and the challenges
Kumar, V., Gu, Y., Basu, S., Berglund, A., Eschrich, S. A., Schabath, M. B., Forster, K., Aerts, H. J. W. L., Dekker, A., Fenstermacher, D., et al. (2012) · Magnetic Resonance Imaging · doi:10.1016/j.mri.2012.06.010 · Cited by 2,258
Self-citationTixier, F., Le Rest, C. C., Hatt, M., Albarghach, N., Pradier, O., Metges, J.-P., Corcos, L., & Visvikis, D. (2011) · Journal of Nuclear Medicine · doi:10.2967/jnumed.110.082404 · Cited by 696
Decoding global gene expression programs in liver cancer by noninvasive imaging
Segal, E., Sirlin, C. B., Ooi, C., Adler, A. S., Gollub, J., Chen, X., Chan, B. K., Matcuk, G. R., Barry, C. T., Chang, H. Y., et al. (2007) · Nature Biotechnology · doi:10.1038/nbt1306 · Cited by 629
Cited by
nnU-Net: a self-configuring method for deep learning-based biomedical image segmentation
Isensee, F., Jaeger, P. F., Kohl, S. A. A., Petersen, J., & Maier-Hein, K. H. (2021) · Nature Methods · doi:10.1038/s41592-020-01008-z · Cited by 10,477
Radiomics: Images Are More than Pictures, They Are Data
Gillies, R. J., Kinahan, P. E., & Hricak, H. (2016) · Radiology · doi:10.1148/radiol.2015151169 · Cited by 8,421
Self-citationComputational Radiomics System to Decode the Radiographic Phenotype
(2017) · doi:10.1158/0008-5472.can-17-0339 · Cited by 6,593
Self-citationRadiomics: the bridge between medical imaging and personalized medicine
Lambin, P., Leijenaar, R. T. H., Deist, T. M., Peerlings, J., de Jong, E. E. C., van Timmeren, J., Sanduleanu, S., Larue, R. T. H. M., Even, A. J. G., Jochems, A., et al. (2017) · Nature Reviews Clinical Oncology · doi:10.1038/nrclinonc.2017.141 · Cited by 5,688
Self-citationConvolutional neural networks: an overview and application in radiology
Yamashita, R., Nishio, M., Do, R. K. G., & Togashi, K. (2018) · Insights into Imaging · doi:10.1007/s13244-018-0639-9 · Cited by 4,682
“Most recent radiomics studies use hand-crafted feature extraction techniques, such as texture analysis, followed by conventional machine learning classifiers, such as random forests and support vector machines [15, 16].”
Method
Metadata
- Authors
- Aerts, H. J. W. L., Velazquez, E. R., Leijenaar, R. T. H., Parmar, C., Grossmann, P., Carvalho, S., Bussink, J., Monshouwer, R., Haibe-Kains, B., Rietveld, D., Hoebers, F., Rietbergen, M. M., Leemans, C. R., Dekker, A., Quackenbush, J., Gillies, R. J., & Lambin, P.
- Affiliations
- Brigham and Women's Hospital (US)
- Maastricht University (NL)
- Radboud University Medical Center (NL)
- Amsterdam UMC Location Vrije Universiteit Amsterdam (NL)
- Dana-Farber Cancer Institute (US)
- Moffitt Cancer Center (US)
- Corresponding author
- Aerts, Hugo J. W. L.
- ORCID
- Venue
- Nature Communications
- Published
- 2014-06-03
- Volume
- 5
- Issue
- 1
- Pages
- 4006-4006
- ISSN
- 2041-1723 (ISSN-L)
- PMC
- PMC4059926
- OpenAlex
- W2103004421
- Semantic Scholar
- 3b002068646831a6f59fabb6daeb0209ed54049d
- Cited by
- 5,132
- References
- 29
- Citations by year
- 2026: 415 · 2025: 460 · 2024: 458 · 2023: 510 · 2022: 567 · 2021: 638 · 2020: 587 · 2019: 552 · 2018: 388 · 2017: 283 · 2016: 175 · 2015: 82 · 2014: 11
- FWCI
- 142.84
- Type
- journal article
- Language
- en
- Update notices
- correction (2014-08-07)
- Open access
- hybrid
- doi.org
- Licence
- Locations
- Nature Communications (publishedVersion, cc-by-nc-nd)
- PubMed Central (publishedVersion, cc-by-nc-nd)
- PubMed (publishedVersion)
- Pure Amsterdam UMC (publishedVersion)
- Amsterdam UMC (VU Amsterdam) - Institutional Repository (publishedVersion)
- Radboud Repository (Radboud University) (submittedVersion)
- Digital Access to Scholarship at Harvard (DASH) (Harvard University) (submittedVersion, cc-by)
- RePEc: Research Papers in Economics (submittedVersion)
- Research Publications (Maastricht University) (submittedVersion, cc-by-nc-nd)
- Radboud Repository (Radboud University) (submittedVersion, other-oa)
- Research Publications (Maastricht University) (submittedVersion, other-oa)
- Data Archiving and Networked Services (DANS) (submittedVersion)
- Funders
- European Federation of Pharmaceutical Industries and Associations
- KWF Kankerbestrijding (UM 2009-4454, 2011-5020, KWF UM 2009-4454, KWF UM 2011-5020, 2009-4454)
- Center for Translational Molecular Medicine (grant 030-103, 030-103)
- Innovative Medicines Initiative (115151)
- National Institutes of Health (U01 CA)
- National Cancer Institute (NIH-USA U01CA 143062-01, U01CA143062)
- Interreg
- Topics
- Health Sciences › Medicine › Radiology, Nuclear Medicine and Imaging › Radiomics and Machine Learning in Medical Imaging
- Physical Sciences › Computer Science › Computer Vision and Pattern Recognition › Image Retrieval and Classification Techniques
- Health Sciences › Medicine › Radiology, Nuclear Medicine and Imaging › Medical Imaging Techniques and Applications
- Keywords
- radiomics, tumor phenotype, lung cancer, head and neck cancer, radiogenomics, intratumoral heterogeneity, computed tomography, image texture features, gene expression, non-invasive imaging, treatment decision support
- MeSH terms
- Adenocarcinoma, Carcinoma, Non-Small-Cell Lung, Carcinoma, Squamous Cell, Female, Head and Neck Neoplasms, Humans, Lung Neoplasms, Male, Phenotype, Prognosis, Tomography, X-Ray Computed, Tumor Burden, Positron-Emission Tomography, Multimodal Imaging
About these checks
Registry, retraction, Cites and statistics results are computed, not judged, with one exception: a printed reference that no index lists is read once by a model before it counts as a citation error. Claims are extracted by a model and kept only when their quote appears verbatim in the text; each cited source is then checked, with a model’s help, for whether it says what the claim relies on. Those verdicts can be wrong — read the claim’s quote and the cited source before relying on one.
Statistics and arithmetic are recomputed, not judged.
Confidence bands are shown only for fields calibrated on our annotated test set. None is calibrated yet, so no band is shown.
What counts as a claim ›How we measure confidence ›How we check this ›
Are you an author, or do you see a problem with this page? Request a review
Data sources
Bibliographic data: Semantic Scholar, OpenAlex, Crossref.
Contains information from the Semantic Scholar Academic Graph Datasets, made available under the ODC Attribution License (ODC-BY 1.0).
Semantic Scholar’s data is described in: Kinney, R., et al. (2023). The Semantic Scholar Open Data Platform. arXiv:2301.10140.
