

The DOI matches its Crossref record; 60 of the 60 references it cites were found in a registry or an index.
Non-plasmonic nanoantennas for surface enhanced spectroscopies with ultra-low heat conversion
Open accessAbstract
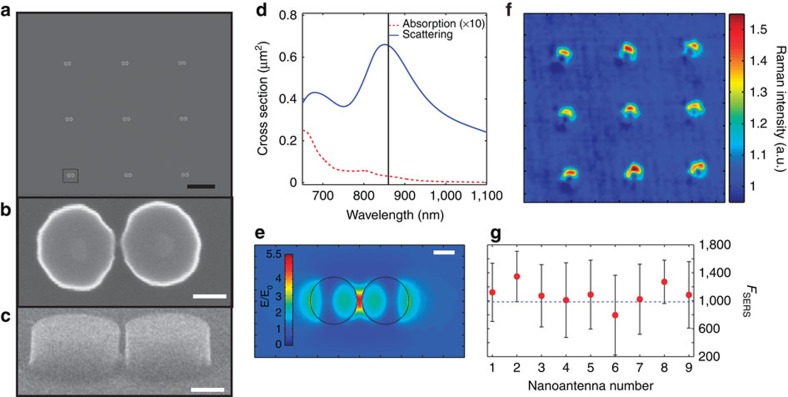
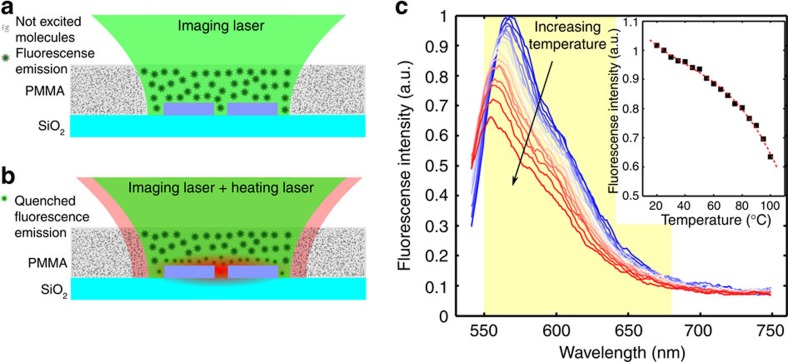
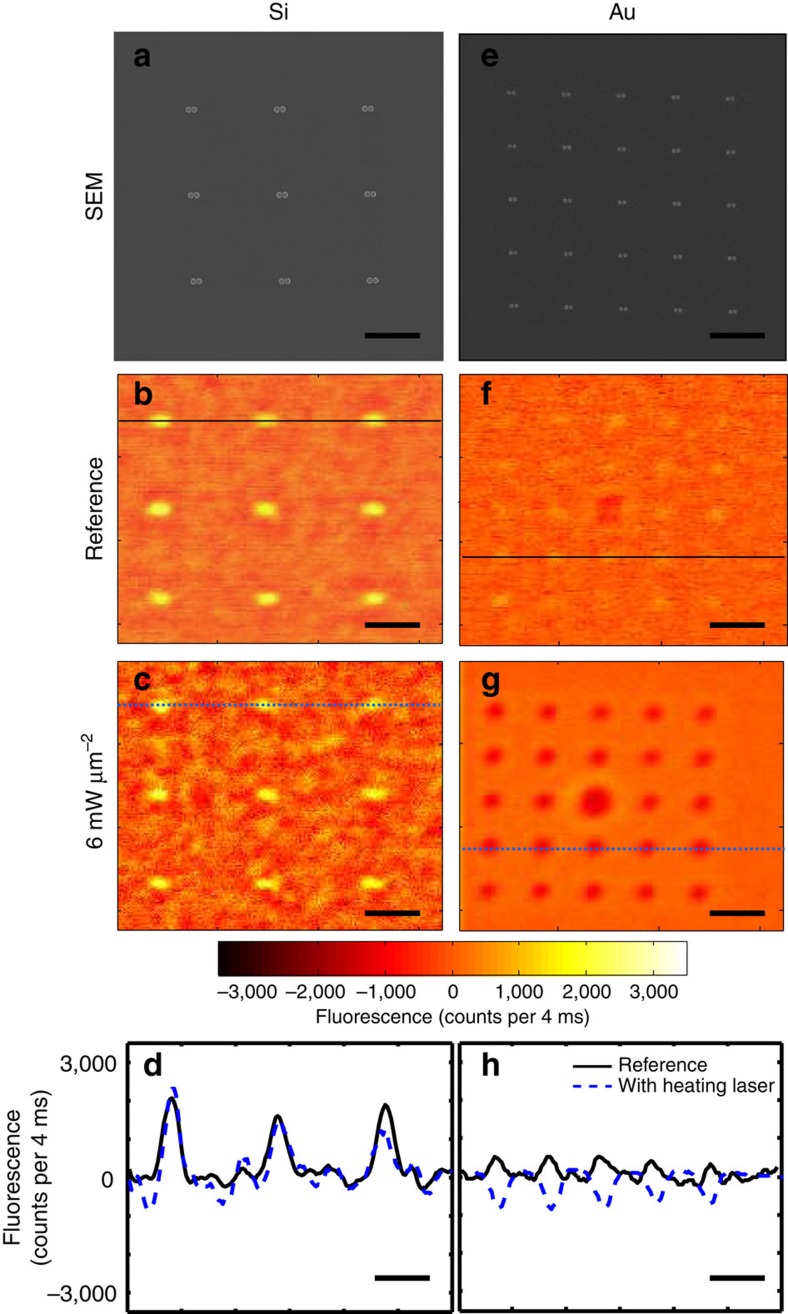
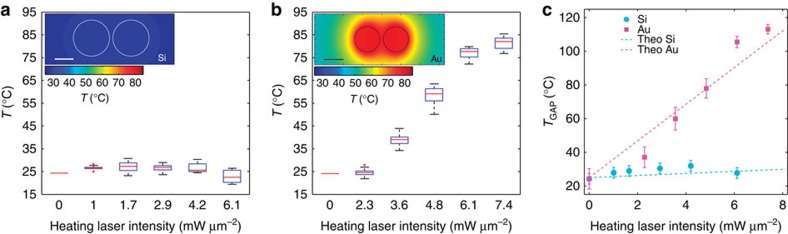
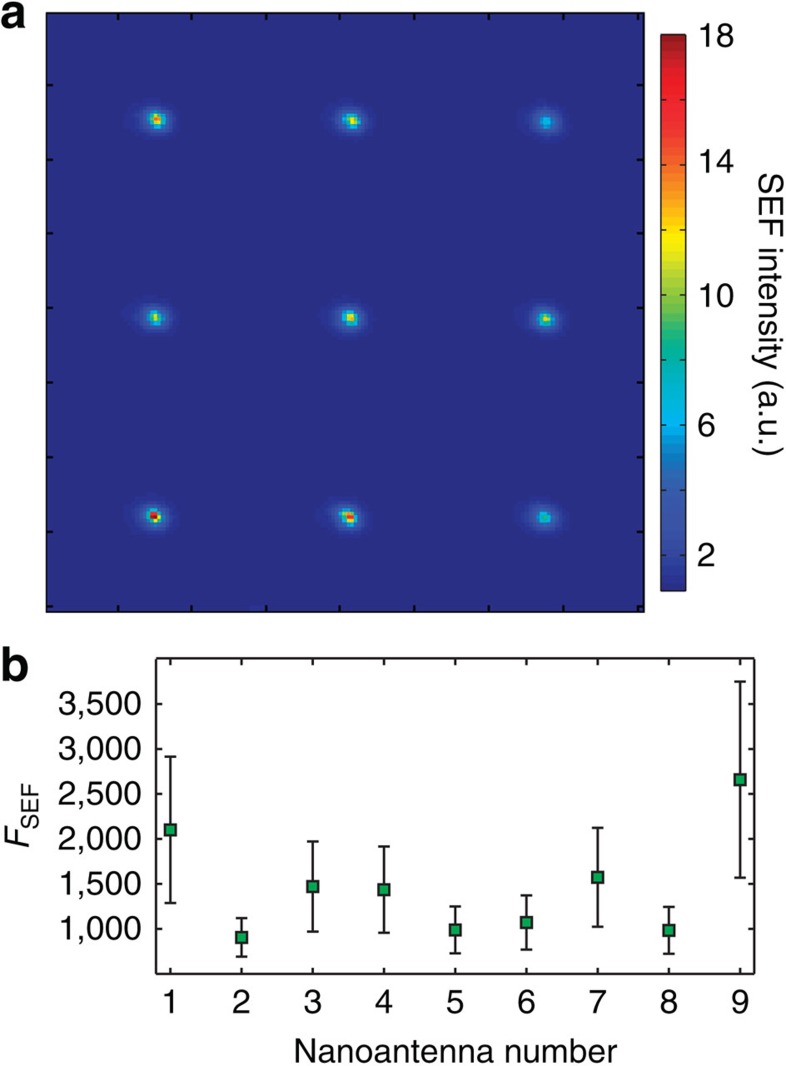
Nanoplasmonics has recently revolutionized our ability to control light on the nanoscale. Using metallic nanostructures with tailored shapes, it is possible to efficiently focus light into nanoscale field 'hot spots'. High field enhancement factors have been achieved in such optical nanoantennas, enabling transformative science in the areas of single molecule interactions, highly enhanced nonlinearities and nanoscale waveguiding. Unfortunately, these large enhancements come at the price of high optical losses due to absorption in the metal, severely limiting real-world applications. Via the realization of a novel nanophotonic platform based on dielectric nanostructures to form efficient nanoantennas with ultra-low light-into-heat conversion, here we demonstrate an approach that overcomes these limitations. We show that dimer-like silicon-based single nanoantennas produce both high surface enhanced fluorescence and surface enhanced Raman scattering, while at the same time generating a negligible temperature increase in their hot spots and surrounding environments.
Overview
The claims and statistics of this paper haven’t been checked yet.
Run the check — free, no account needed. It reads the open-access text and checks the sources it cites.
Integrity signals
Registry
Cites
Statistics
Figures
Verification
Claims the paper makes
The claims and statistics of this paper haven’t been checked yet.
Run the check — free, no account needed. It reads the open-access text and checks the sources it cites.
Claims other papers make about this one
Each is checked against this paper’s own text: does it say what the citing paper says it does?
In the citing paper
“Via the realization of a novel nanophotonic platform based on dielectric nanostructures to form efficient nanoantennae with ultra-low light-into heat conversion, is demonstrated an approach that overcomes these limitations.”
From The Current State of Optical Sensors in Medical Wearables (2022) · cites this paper as [289]
Self-check
Percentages, sums and reported differences re-computed from the paper’s own numbers.
The self-check needs the paper’s full text.
Citations
Cites
Optical Constants of the Noble Metals
Johnson, P. B., & Christy, R. W. (1972) · Physical Review B · doi:10.1103/physrevb.6.4370 · Cited by 20,094
Plasmonics: Fundamentals and Applications
Maier, S. A. (2007) · Springer eBooks · doi:10.1007/0-387-37825-1 · Cited by 9,943
Self-citationPlasmonics for improved photovoltaic devices
Atwater, H. A., & Polman, A. (2010) · Nature Materials · doi:10.1038/nmat2629 · Cited by 8,463
Plasmonics for extreme light concentration and manipulation
Schuller, J. A., Barnard, E. S., Cai, W., Jun, Y. C., White, J. S., & Brongersma, M. L. (2010) · Nature Materials · doi:10.1038/nmat2630 · Cited by 4,395
Surface-Enhanced Raman Spectroscopy
Stiles, P. L., Dieringer, J. A., Shah, N. C., & Duyne, R. P. V. (2008) · Annual Review of Analytical Chemistry · doi:10.1146/annurev.anchem.1.031207.112814 · Cited by 3,205
Enhancement and Quenching of Single-Molecule Fluorescence
Anger, P., Bharadwaj, P., & Novotný, L. (2006) · Physical Review Letters · doi:10.1103/physrevlett.96.113002 · Cited by 3,139
Alternative Plasmonic Materials: Beyond Gold and Silver
Naik, G. V., Shalaev, V. M., & Boltasseva, A. E. (2013) · Advanced Materials · doi:10.1002/adma.201205076 · Cited by 2,415
Visible-light-enhanced catalytic oxidation reactions on plasmonic silver nanostructures
Christopher, P., Xin, H., & Linic, S. (2011) · Nature Chemistry · doi:10.1038/nchem.1032 · Cited by 1,999
Nanoshell-Enabled Photothermal Cancer Therapy: Impending Clinical Impact
Lal, S., Clare, S. E., & Halas, N. J. (2008) · Accounts of Chemical Research · doi:10.1021/ar800150g · Cited by 1,627
Principles of Surface-Enhanced Raman Spectroscopy: and Related Plasmonic Effects
Ru, E. C. L., & Etchegoin, P. (2008) · Cited by 1,455
Cited by
Sorted by citations
Present and Future of Surface-Enhanced Raman Scattering
Langer, J., de Aberasturi, D. J., Aizpurua, J., Álvarez‐Puebla, R. A., Auguié, B., Baumberg, J. J., Bazan, G. C., Bell, S. E. J., Boisen, A., Brolo, A. G., et al. (2019) · ACS Nano · doi:10.1021/acsnano.9b04224 · Cited by 3,993
Self-citationOptically resonant dielectric nanostructures
Kuznetsov, A. I., Miroshnichenko, A. E., Brongersma, M. L., Kivshar, Y. S., & Luk’yanchuk, B. (2016) · Science · doi:10.1126/science.aag2472 · Cited by 2,914
Jahani, S., & Jacob, Z. (2016) · Nature Nanotechnology · doi:10.1038/nnano.2015.304 · Cited by 1,969
Imaging-based molecular barcoding with pixelated dielectric metasurfaces
Tittl, A., Leitis, A., Liu, M., Yesilköy, F., Choi, D., Neshev, D. N., Kivshar, Y. S., & Altug, H. (2018) · Science · doi:10.1126/science.aas9768 · Cited by 1,351
A Review on Surface-Enhanced Raman Scattering
Pilot, R., Signorini, R., Durante, C., Orian, L., Bhamidipati, M., & Fabris, L. (2019) · Biosensors · doi:10.3390/bios9020057 · Cited by 1,063
Advances and applications of nanophotonic biosensors
Altug, H., Oh, S., Maier, S. A., & Homola, J. (2022) · Nature Nanotechnology · doi:10.1038/s41565-021-01045-5 · Cited by 914
Self-citationMetamaterial-inspired silicon nanophotonics
Staude, I., & Schilling, J. (2017) · Nature Photonics · doi:10.1038/nphoton.2017.39 · Cited by 810
Enhanced Raman Scattering with Dielectrics
Alessandri, I., & Lombardi, J. R. (2016) · Chemical Reviews · doi:10.1021/acs.chemrev.6b00365 · Cited by 652
Bell, S. E. J., Charron, G., Cortés, E., Kneipp, J., de la Chapelle, M. L., Langer, J., Procházka, M., Tran, V. T., & Schlücker, S. (2019) · Angewandte Chemie International Edition · doi:10.1002/anie.201908154 · Cited by 623
Self-citationNonlinear metasurfaces: a paradigm shift in nonlinear optics
Krasnok, A., Tymchenko, M., & Alù, A. (2018) · Materials Today · doi:10.1016/j.mattod.2017.06.007 · Cited by 613
Directional lasing in resonant semiconductor nanoantenna arrays
Ha, S. T., Fu, Y. H., Emani, N. K., Pan, Z., Bakker, R. M., Paniagua-Domínguez, R., & Kuznetsov, A. I. (2018) · Nature Nanotechnology · doi:10.1038/s41565-018-0245-5 · Cited by 605
What’s so Hot about Electrons in Metal Nanoparticles?
Hartland, G. V., Besteiro, L. V., Johns, P., & Govorov, A. O. (2017) · ACS Energy Letters · doi:10.1021/acsenergylett.7b00333 · Cited by 476
Enhanced Third Harmonic Generation in Single Germanium Nanodisks Excited at the Anapole Mode
Grinblat, G., Li, Y., Nielsen, M. P., Oulton, R. F., & Maier, S. A. (2016) · Nano Letters · doi:10.1021/acs.nanolett.6b01958 · Cited by 440
Self-citationSurface-enhanced Raman spectroscopy: a half-century historical perspective
Yi, J., You, E., Hu, R., Wu, D., Liu, G., Yang, Z., Zhang, H., Gu, Y., Wang, Y.-H., Wang, X., et al. (2024) · Chemical Society Reviews · doi:10.1039/d4cs00883a · Cited by 402
Plasmonic tweezers: for nanoscale optical trapping and beyond
Zhang, Y., Min, C., Dou, X., Wang, X., Urbach, H. P., Somekh, M. G., & Yuan, X. (2021) · Light Science & Applications · doi:10.1038/s41377-021-00474-0 · Cited by 384
All-Dielectric Colored Metasurfaces with Silicon Mie Resonators
Proust, J., Bedu, F., Gallas, B., Ozerov, I., & Bonod, N. (2016) · ACS Nano · doi:10.1021/acsnano.6b03207 · Cited by 337
Dielectric Metasurfaces Enabling Advanced Optical Biosensors
Tseng, M. L., Jahani, Y., Leitis, A., & Altug, H. (2020) · ACS Photonics · doi:10.1021/acsphotonics.0c01030 · Cited by 339
Resonant leaky modes in all-dielectric metasystems: Fundamentals and applications
Huang, L., Xu, L., Powell, D. A., Padilla, W. J., & Miroshnichenko, A. E. (2023) · Physics Reports · doi:10.1016/j.physrep.2023.01.001 · Cited by 342
Ben‐Jaber, S., Peveler, W. J., Quesada-Cabrera, R., Cortés, E., Sotelo-Vázquez, C., Abdul‐Karim, N., Maier, S. A., & Parkin, I. P. (2016) · Nature Communications · doi:10.1038/ncomms12189 · Cited by 281
Self-citationVaskin, A., Kołkowski, R., Koenderink, A. F., & Staude, I. (2018) · Nanophotonics · doi:10.1515/nanoph-2019-0110 · Cited by 281
Recent Advances in Tunable Metasurfaces: Materials, Design, and Applications
Abdelraouf, O. A. M., Wang, Z., Liu, H., Dong, Z., Wang, Q., Ye, M., Wang, X. R., Wang, Q. J., & Liu, H. (2022) · ACS Nano · doi:10.1021/acsnano.2c04628 · Cited by 285
Resonant dielectric nanostructures: a low-loss platform for functional nanophotonics
Decker, M., & Staude, I. (2016) · Journal of Optics · doi:10.1088/2040-8978/18/10/103001 · Cited by 265
Grinblat, G., Li, Y., Nielsen, M. P., Oulton, R. F., & Maier, S. A. (2016) · ACS Nano · doi:10.1021/acsnano.6b07568 · Cited by 267
Self-citationCambiasso, J., Grinblat, G., Li, Y., Rakovich, A., Cortés, E., & Maier, S. A. (2017) · Nano Letters · doi:10.1021/acs.nanolett.6b05026 · Cited by 267
Self-citationMonolithic AlGaAs second-harmonic nanoantennas
Gili, V. F., Carletti, L., Locatelli, A., Rocco, D., Finazzi, M., Ghirardini, L., Favero, I., Gómez, C., Lemaître, A., Celebrano, M., et al. (2016) · Optics Express · doi:10.1364/oe.24.015965 · Cited by 252
Efficient Third Harmonic Generation from Metal–Dielectric Hybrid Nanoantennas
Shibanuma, T., Grinblat, G., Albella, P., & Maier, S. A. (2017) · Nano Letters · doi:10.1021/acs.nanolett.7b00462 · Cited by 249
Self-citationAll-Dielectric Silicon Nanogap Antennas To Enhance the Fluorescence of Single Molecules
Regmi, R., Berthelot, J., Winkler, P. M., Mivelle, M., Proust, J., Bedu, F., Ozerov, I., Begou, T. C., Lumeau, J. H., Rigneault, H., et al. (2016) · Nano Letters · doi:10.1021/acs.nanolett.6b02076 · Cited by 238
Metamaterial, plasmonic and nanophotonic devices
Monticone, F., & Alù, A. (2017) · Reports on Progress in Physics · doi:10.1088/1361-6633/aa518f · Cited by 244
Subwavelength Artificial Structures: Opening a New Era for Engineering Optics
Luo, X. (2018) · Advanced Materials · doi:10.1002/adma.201804680 · Cited by 224
Plasmonic- and dielectric-based structural coloring: from fundamentals to practical applications
Lee, T., Jang, J., Jeong, H., & Rho, J. (2018) · Nano Convergence · doi:10.1186/s40580-017-0133-y · Cited by 224
Anapole-Assisted Strong Field Enhancement in Individual All-Dielectric Nanostructures
Yang, Y., Zenin, V. A., & Bozhevolnyi, S. I. (2018) · ACS Photonics · doi:10.1021/acsphotonics.7b01440 · Cited by 200
Recent Progress on Plasmon‐Enhanced Fluorescence
Dong, J., Zhang, Z., Zheng, H., & Sun, M. (2015) · Nanophotonics · doi:10.1515/nanoph-2015-0028 · Cited by 199
Silicon Nanostructures for Bright Field Full Color Prints
Flauraud, V., Reyes, M., Paniagua-Domínguez, R. J., Kuznetsov, A. I., & Brügger, J. (2017) · ACS Photonics · doi:10.1021/acsphotonics.6b01021 · Cited by 198
Broadband single molecule SERS detection designed by warped optical spaces
Mao, P., Liu, C., Favraud, G., Chen, Q., Han, M. S., Fratalocchi, A., & Zhang, S. (2018) · Nature Communications · doi:10.1038/s41467-018-07869-5 · Cited by 194
Reversible Thermal Tuning of All‐Dielectric Metasurfaces
Rahmani, M., Xu, L., Miroshnichenko, A. E., Komar, A., Camacho‐Morales, R., Chen, H., Zárate, Y. D., Kruk, S., Zhang, G., Neshev, D. N., et al. (2017) · Advanced Functional Materials · doi:10.1002/adfm.201700580 · Cited by 190
Self-citationEnhancement Factors: A Central Concept during 50 Years of Surface-Enhanced Raman Spectroscopy
Ru, E. C. L., & Auguié, B. (2024) · ACS Nano · doi:10.1021/acsnano.4c01474 · Cited by 191
All-Dielectric Resonant Meta-Optics Lightens up
Staude, I., Pertsch, T., & Kivshar, Y. S. (2019) · ACS Photonics · doi:10.1021/acsphotonics.8b01326 · Cited by 189
Dielectric nanoresonators for light manipulation
Yang, Z., Jiang, R., Zhuo, X., Xie, Y., Wang, J., & Lin, H. (2017) · Physics Reports · doi:10.1016/j.physrep.2017.07.006 · Cited by 177
Optical Metasurfaces for Energy Conversion
Cortés, E., Wendisch, F. J., Sortino, L., Mancini, A., Ezendam, S., Saris, S., Menezes, L. D. S., Tittl, A., Ren, H., & Maier, S. A. (2022) · Chemical Reviews · doi:10.1021/acs.chemrev.2c00078 · Cited by 181
Self-citationSpectroscopy and Biosensing with Optically Resonant Dielectric Nanostructures
Krasnok, A., Caldarola, M., Bonod, N., & Alù, A. (2018) · Advanced Optical Materials · doi:10.1002/adom.201701094 · Cited by 173
Self-citationMultifold Emission Enhancement in Nanoimprinted Hybrid Perovskite Metasurfaces
Makarov, S., Milichko, V. A., Ushakova, E. V., Omelyanovich, M. M., Pasarán, A. C., Haroldson, R., Balachandran, B., Wang, H., Hu, W. W., Kivshar, Y. S., et al. (2017) · ACS Photonics · doi:10.1021/acsphotonics.6b00940 · Cited by 166
Highly sensitive biosensors based on all-dielectric nanoresonators
Bontempi, N., Chong, K. E., Orton, H. W., Staude, I., Choi, D., Alessandri, I., Kivshar, Y. S., & Neshev, D. N. (2017) · Nanoscale · doi:10.1039/c6nr07904k · Cited by 167
Resonant Raman scattering from silicon nanoparticles enhanced by magnetic response
Dmitriev, P. A., Baranov, D. G., Milichko, V. A., Makarov, S. V., Mukhin, I. S., Samusev, A. K., Krasnok, A., Belov, P. A., & Kivshar, Y. S. (2016) · Nanoscale · doi:10.1039/c5nr07965a · Cited by 163
Quantum Dot Emission Driven by Mie Resonances in Silicon Nanostructures
Rutckaia, V., Heyroth, F., Novikov, A. V., Shaleev, M. V., Petrov, M. I., & Schilling, J. (2017) · Nano Letters · doi:10.1021/acs.nanolett.7b03248 · Cited by 163
Modifying magnetic dipole spontaneous emission with nanophotonic structures
Baranov, D. G., Savelev, R. S., Li, S. V., Krasnok, A., & Alù, A. (2017) · Laser & Photonics Review · doi:10.1002/lpor.201600268 · Cited by 164
Roadmap on photonic metasurfaces
Schulz, S. A., Oulton, R. F., Kenney, M., Alù, A., Staude, I., Bashiri, A., Fedorova, Z., Kołkowski, R., Koenderink, A. F., Xiao, X., et al. (2024) · Applied Physics Letters · doi:10.1063/5.0204694 · Cited by 171
Self-citationUpconversion amplification through dielectric superlensing modulation
Liang, L., Teh, D. B. L., Dinh, N., Chen, W., Chen, Q., Wu, Y. H., Chowdhury, S., Yamanaka, A., Sum, T. C., Chen, C., et al. (2019) · Nature Communications · doi:10.1038/s41467-019-09345-0 · Cited by 157
Mohammadi, E., Tavakoli, A., Dehkhoda, P., Jahani, Y., Tsakmakidis, K. L., Tittl, A., & Altug, H. (2019) · ACS Photonics · doi:10.1021/acsphotonics.8b01767 · Cited by 158
Resonant Nonplasmonic Nanoparticles for Efficient Temperature-Feedback Optical Heating
Zograf, G., Petrov, M. I., Zuev, D. A., Dmitriev, P., Milichko, V. A., Makarov, S., & Belov, P. A. (2017) · Nano Letters · doi:10.1021/acs.nanolett.7b00183 · Cited by 152
Strong Photoluminescence Enhancement in All-Dielectric Fano Metasurface with High Quality Factor
Yuan, S., Qiu, X.-Z., Cui, C., Zhu, L., Wang, Y., Li, Y., Song, J., Huang, Q., & Xia, J. (2017) · ACS Nano · doi:10.1021/acsnano.7b04810 · Cited by 150
Porous carbon nanowire array for surface-enhanced Raman spectroscopy
Chen, N., Xiao, T., Luo, Z., Kitahama, Y., Hiramatsu, K., Kishimoto, N., Itoh, T., Cheng, Z., & Goda, K. (2020) · Nature Communications · doi:10.1038/s41467-020-18590-7 · Cited by 147
Nonradiating anapole states in nanophotonics: from fundamentals to applications
Yang, Y., & Bozhevolnyi, S. I. (2019) · Nanotechnology · doi:10.1088/1361-6528/ab02b0 · Cited by 146
Active Tuning of Spontaneous Emission by Mie-Resonant Dielectric Metasurfaces
Bohn, J., Bucher, T., Chong, K. E., Komar, A., Choi, D., Neshev, D. N., Kivshar, Y. S., Pertsch, T., & Staude, I. (2018) · Nano Letters · doi:10.1021/acs.nanolett.8b00475 · Cited by 145
Luo, X., Tsai, D. P., Gu, M., & Hong, M. (2019) · Chemical Society Reviews · doi:10.1039/c8cs00864g · Cited by 139
Sortino, L., Zotev, P. G., Mignuzzi, S., Cambiasso, J., Schmidt, D., Genco, A., Aßmann, M., Bayer, M., Maier, S. A., Sapienza, R., et al. (2019) · Nature Communications · doi:10.1038/s41467-019-12963-3 · Cited by 136
Self-citationOptical Sensing by Metamaterials and Metasurfaces: From Physics to Biomolecule Detection
Khan, S. A., Khan, N. Z., Xie, Y., Abbas, M. T., Rauf, M., Mehmood, I., Runowski, M., Agathopoulos, S., & Zhu, J. (2022) · Advanced Optical Materials · doi:10.1002/adom.202200500 · Cited by 135
Diagnosis and prognosis of myocardial infarction on a plasmonic chip
Xu, W. L., Wang, L., Zhang, R., Sun, X., Huang, L., Su, H., Wei, X., Chen, C., Lou, J., Dai, H., et al. (2020) · Nature Communications · doi:10.1038/s41467-020-15487-3 · Cited by 134
Tuning the exponential sensitivity of a bound-state-in-continuum optical sensor
Romano, S., Zito, G., Yépez, S. N. L., Cabrini, S., Penzo, E., Coppola, G., Rendina, I., & Mocellaark, V. (2019) · Optics Express · doi:10.1364/oe.27.018776 · Cited by 126
Lasing Action in Single Subwavelength Particles Supporting Supercavity Modes
Mylnikov, V., Ha, S. T., Pan, Z., Valuckas, V., Paniagua-Domínguez, R. J., Demir, H. V., & Kuznetsov, A. I. (2020) · ACS Nano · doi:10.1021/acsnano.0c02730 · Cited by 124
Surface-Enhanced Raman and Fluorescence Spectroscopy with an All-Dielectric Metasurface
Romano, S., Zito, G., Managò, S., Calafiore, G. C., Penzo, E., Cabrini, S., Luca, A. C. D., & Mocella, V. (2018) · The Journal of Physical Chemistry C · doi:10.1021/acs.jpcc.8b03190 · Cited by 122
All‐Dielectric Metamaterial Fabrication Techniques
Bi, K., Wang, Q., Xu, J., Chen, L., Lan, C., & Lei, M. (2020) · Advanced Optical Materials · doi:10.1002/adom.202001474 · Cited by 124
The second optical metasurface revolution: moving from science to technology
Brongersma, M. L., Pala, R. A., Altug, H., Capasso, F., Chen, W. T., Majumdar, A., & Atwater, H. A. (2025) · Nature Reviews Electrical Engineering · doi:10.1038/s44287-024-00136-4 · Cited by 132
All-Dielectric Antenna Wavelength Router with Bidirectional Scattering of Visible Light
Li, J., Verellen, N., Vercruysse, D., Bearda, T., Lagae, L., & Dorpe, P. V. (2016) · Nano Letters · doi:10.1021/acs.nanolett.6b01519 · Cited by 121
Roadmap for single-molecule surface-enhanced Raman spectroscopy
Yu, Y., Xiao, T., Wu, Y., Li, W., Qing-guang, Z., Li, L., & Li, Z. (2020) · Advanced Photonics · doi:10.1117/1.ap.2.1.014002 · Cited by 117
Mie Resonator Color Inks of Monodispersed and Perfectly Spherical Crystalline Silicon Nanoparticles
Sugimoto, H., Okazaki, T., & Fujii, M. (2020) · Advanced Optical Materials · doi:10.1002/adom.202000033 · Cited by 120
Directional and Spectral Shaping of Light Emission with Mie-Resonant Silicon Nanoantenna Arrays
Vaskin, A., Bohn, J., Chong, K. E., Bucher, T., Zilk, M., Choi, D., Neshev, D. N., Kivshar, Y. S., Pertsch, T., & Staude, I. (2018) · ACS Photonics · doi:10.1021/acsphotonics.7b01375 · Cited by 114
Shaping the Radiation Pattern of Second-Harmonic Generation from AlGaAs Dielectric Nanoantennas
Carletti, L., Locatelli, A., Neshev, D. N., & Angelis, C. D. (2016) · ACS Photonics · doi:10.1021/acsphotonics.6b00050 · Cited by 113
Dmitriev, P., Makarov, S., Milichko, V. A., Mukhin, I. S., Gudovskikh, A. S., Ситникова, А. А., Samusev, A. K., Krasnok, A., & Belov, P. A. (2015) · Nanoscale · doi:10.1039/c5nr06742a · Cited by 110
Recent advances in plasmonic nanocavities for single-molecule spectroscopy
Maccaferri, N., Barbillon, G., Koya, A. N., Lü, G., Acuna, G. P., & Garoli, D. (2020) · Nanoscale Advances · doi:10.1039/d0na00715c · Cited by 110
Nonlinear Dielectric Nanoantennas and Metasurfaces: Frequency Conversion and Wavefront Control
Grinblat, G. (2021) · ACS Photonics · doi:10.1021/acsphotonics.1c01356 · Cited by 110
Self-citationOptical Metasurfaces for Biomedical Imaging and Sensing
Kim, H., Yun, H. K., Jeong, S., Lee, S., Cho, E., & Rho, J. (2025) · ACS Nano · doi:10.1021/acsnano.4c14751 · Cited by 114
Sinev, I., Iorsh, I. V., Bogdanov, A., Permyakov, D. V., Эдуардович, К. Ф., Mukhin, I. S., Samusev, A. K., Valuckas, V., Kuznetsov, A. I., Luk’yanchuk, B., et al. (2016) · Laser & Photonics Review · doi:10.1002/lpor.201600055 · Cited by 107
Sortino, L., Zotev, P. G., Phillips, C. L., Brash, A. J., Cambiasso, J., Marensi, E., Fox, A. M., Maier, S. A., Sapienza, R., & Tartakovskii, A. I. (2021) · Nature Communications · doi:10.1038/s41467-021-26262-3 · Cited by 106
Self-citationThe Current State of Optical Sensors in Medical Wearables
Vavrinsky, E., Esfahani, N. E., Hausner, M., Kuzma, A., Rezo, V., Donoval, M., & Kosnacova, H. (2022) · Biosensors · doi:10.3390/bios12040217 · Cited by 103
Albella, P., Shibanuma, T., & Maier, S. A. (2015) · Scientific Reports · doi:10.1038/srep18322 · Cited by 106
Self-citationSubwavelength interference of light on structured surfaces
Luo, X., Tsai, D. P., Gu, M., & Hong, M. (2018) · Advances in Optics and Photonics · doi:10.1364/aop.10.000757 · Cited by 100
Jones, S., Andrén, D., Karpinski, P., & Käll, M. (2018) · ACS Photonics · doi:10.1021/acsphotonics.8b00231 · Cited by 100
Experimental demonstration of ultra-large-scale terahertz all-dielectric metamaterials
Bi, K., Yang, D., Chen, J., Wang, Q., Wu, H., Lan, C., & Yang, Y. (2019) · Photonics Research · doi:10.1364/prj.7.000457 · Cited by 99
All-dielectric thermonanophotonics
Zograf, G., Petrov, M. I., Makarov, S., & Kivshar, Y. S. (2021) · Advances in Optics and Photonics · doi:10.1364/aop.426047 · Cited by 100
Applications of Hybrid Metal‐Dielectric Nanostructures: State of the Art
Barreda, A. I., Vitale, F., Minovich, A. E., Ronning, C., & Staude, I. (2022) · Advanced Photonics Research · doi:10.1002/adpr.202100286 · Cited by 98
Dielectric nanoantennas to manipulate solid-state light emission
Bidault, S., Mivelle, M., & Bonod, N. (2019) · Journal of Applied Physics · doi:10.1063/1.5108641 · Cited by 96
Enhancing Magnetic Light Emission with All-Dielectric Optical Nanoantennas
Sanz‐Paz, M., Ernandes, C., Esparza, J. U., Burr, G. W., van Hulst, N. F., Maître, A., Aigouy, L., Gacoin, T., Bonod, N., Parajo, M. F. G., et al. (2018) · Nano Letters · doi:10.1021/acs.nanolett.8b00548 · Cited by 91
Optical Trapping of Nanoparticles Using All-Silicon Nanoantennas
Xu, Z., Song, W., & Crozier, K. B. (2018) · ACS Photonics · doi:10.1021/acsphotonics.8b01250 · Cited by 95
Temperature Measurement in Plasmonic Nanoapertures Used for Optical Trapping
Jiang, Q., Rogez, B., Claude, J.-B., Baffou, G., & Wenger, J. (2019) · ACS Photonics · doi:10.1021/acsphotonics.9b00519 · Cited by 93
Shibanuma, T., Albella, P., & Maier, S. A. (2016) · Nanoscale · doi:10.1039/c6nr04335f · Cited by 93
Self-citationNanoantenna–Microcavity Hybrids with Highly Cooperative Plasmonic–Photonic Coupling
Liu, J.-N., Huang, Q., Liu, K., Singamaneni, S., & Cunningham, B. T. (2017) · Nano Letters · doi:10.1021/acs.nanolett.7b03519 · Cited by 92
Rahmani, M., Leo, G., Brener, I., Zayats, A. V., A., M., Angelis, C. D., Tan, H. H., Gili, V. F., Karouta, F., Oulton, R. F., et al. (2018) · Opto-Electronic Advances · doi:10.29026/oea.2018.180021 · Cited by 90
Self-citationDegenerate Four-Wave Mixing in a Multiresonant Germanium Nanodisk
Grinblat, G., Li, Y., Nielsen, M. P., Oulton, R. F., & Maier, S. A. (2017) · ACS Photonics · doi:10.1021/acsphotonics.7b00631 · Cited by 89
Self-citationBroadband Dielectric–Metal Hybrid Nanoantenna: Silicon Nanoparticle on a Mirror
Sugimoto, H., & Fujii, M. (2018) · ACS Photonics · doi:10.1021/acsphotonics.7b01461 · Cited by 89
Shibanuma, T., Matsui, T., Roschuk, T. R., Wójcik, J., Mascher, P., Albella, P., & Maier, S. A. (2017) · ACS Photonics · doi:10.1021/acsphotonics.6b00979 · Cited by 89
Self-citationEnhancement and Inhibition of Spontaneous Photon Emission by Resonant Silicon Nanoantennas
Bouchet, D., Mivelle, M., Proust, J., Gallas, B., Ozerov, I., Parajo, M. F. G., Gulinatti, A., Rech, I., Wilde, Y. D., Bonod, N., et al. (2016) · Physical Review Applied · doi:10.1103/physrevapplied.6.064016 · Cited by 86
Demonstration of the enhanced Purcell factor in all-dielectric structures
Krasnok, A., Glybovski, S., Petrov, M. I., Makarov, S., Savelev, R. S., Belov, P. A., Simovski, C. R., & Kivshar, Y. S. (2016) · Applied Physics Letters · doi:10.1063/1.4952740 · Cited by 86
Controlling second-harmonic generation at the nanoscale with monolithic AlGaAs-on-AlOx antennas
Carletti, L., Rocco, D., Locatelli, A., Angelis, C. D., Gili, V. F., Ravaro, M., Favero, I., Leo, G., Finazzi, M., Ghirardini, L., et al. (2017) · Nanotechnology · doi:10.1088/1361-6528/aa5645 · Cited by 86
Sortino, L., Zotev, P. G., Phillips, C. L., Brash, A. J., Cambiasso, J., Marensi, E., Fox, A. M., Maier, S. A., Sapienza, R., & Tartakovskii, A. I. (2021) · White Rose Research Online (University of Leeds, The University of Sheffield, University of York) · Cited by 86
Self-citationGoel, R., Chakraborty, S., Awasthi, V., Bhardwaj, V., & Dubey, S. K. (2024) · Sensors and Actuators A Physical · doi:10.1016/j.sna.2024.115555 · Cited by 88
Efficiency and Bond Selectivity in Plasmon‐Induced Photochemistry
Cortés, E. (2017) · Advanced Optical Materials · doi:10.1002/adom.201700191 · Cited by 84
Self-citationZhang, Y., Chang, K., Ogunlade, B., Herndon, L., Tadesse, L. F., Kirane, A. R., & Dionne, J. A. (2024) · ACS Nano · doi:10.1021/acsnano.4c04282 · Cited by 83
Large-Scale Silicon Nanophotonic Metasurfaces with Polarization Independent Near-Perfect Absorption
Länk, N. O., Verre, R., Johansson, P., & Käll, M. (2017) · Nano Letters · doi:10.1021/acs.nanolett.7b00416 · Cited by 83
Resonant Scattering Manipulation of Dielectric Nanoparticles
Xu, J., Wu, Y., Zhang, P., Wu, Y. H., Vallée, R. A. L., Wu, S., & Liu, X. (2021) · Advanced Optical Materials · doi:10.1002/adom.202100112 · Cited by 84
Constructing 3D and Flexible Plasmonic Structure for High‐Performance SERS Application
Li, C., Yu, J., Xu, S., Jiang, S., Xiu, X., Chen, C., Liu, A., Wu, T., Man, B., & Zhang, C. (2018) · Advanced Materials Technologies · doi:10.1002/admt.201800174 · Cited by 82
Metadata
- Authors
- Caldarola, M., Albella, P., Cortés, E., Rahmani, M., Roschuk, T., Grinblat, G., Oulton, R. F., Bragas, A. V., & Maier, S. A.
- Affiliations
- Consejo Nacional de Investigaciones Científicas y Técnicas (AR)
- Imperial College London (GB)
- Corresponding author
- Bragas, Andrea V.
- Maier, Stefan A.
- ORCID
- Venue
- Nature Communications
- Published
- 2015-08-04
- Volume
- 6
- Issue
- 1
- Pages
- 7915-7915
- ISSN
- 2041-1723 (ISSN-L)
- PMC
- PMC4532885
- OpenAlex
- W2254159412
- Cited by
- 520
- References
- 60
- Citations by year
- 2026: 16 · 2025: 22 · 2024: 36 · 2023: 35 · 2022: 41 · 2021: 47 · 2020: 59 · 2019: 70 · 2018: 73 · 2017: 64 · 2016: 51 · 2015: 5
- FWCI
- 32.00
- Type
- journal article
- Language
- en
- Open access
- gold
- doi.org
- Locations
- Nature Communications (publishedVersion, cc-by)
- PubMed Central (publishedVersion, cc-by)
- PubMed (publishedVersion)
- Leiden Repository (Leiden University) (submittedVersion)
- Spiral (Imperial College London) (submittedVersion)
- RePEc: Research Papers in Economics (submittedVersion)
- Americanae (AECID Library) (submittedVersion, cc-by-nc-sa)
- UCrea (University of Cantabria) (submittedVersion, cc-by)
- LA Referencia (Red Federada de Repositorios Institucionales de Publicaciones Científicas) (submittedVersion, cc-by-nc-sa)
- Data Archiving and Networked Services (DANS) (submittedVersion, other-oa)
- Greater South Information System
- Funders
- Leverhulme Trust
- Universidad de Buenos Aires (2014‐2017)
- Engineering and Physical Sciences Research Council (EP/I004343/1, EP/H000917/2, EP/H000844/1)
- Agencia Nacional de Promoción Científica y Tecnológica (2010-00825)
- Office of Naval Research
- Office of Naval Research Global
- Topics
- Physical Sciences › Physics and Astronomy › Atomic and Molecular Physics, and Optics › Plasmonic and Surface Plasmon Research
- Physical Sciences › Materials Science › Electronic, Optical and Magnetic Materials › Gold and Silver Nanoparticles Synthesis and Applications
- Physical Sciences › Physics and Astronomy › Atomic and Molecular Physics, and Optics › Near-Field Optical Microscopy
- Keywords
- dielectric nanostructures, silicon nanoantennas, surface-enhanced fluorescence, surface-enhanced Raman scattering, optical loss, heat generation, hot spots, nanophotonics
About these checks
Registry, retraction, Cites and statistics results are computed, not judged, with one exception: a printed reference that no index lists is read once by a model before it counts as a citation error. Claims are extracted by a model and kept only when their quote appears verbatim in the text; each cited source is then checked, with a model’s help, for whether it says what the claim relies on. Those verdicts can be wrong — read the claim’s quote and the cited source before relying on one.
Statistics and arithmetic are recomputed, not judged.
Confidence bands are shown only for fields calibrated on our annotated test set. None is calibrated yet, so no band is shown.
What counts as a claim ›How we measure confidence ›How we check this ›
Are you an author, or do you see a problem with this page? Request a review
