

The DOI matches its Crossref record; 45 of the 47 references it cites were found in a registry or an index; 12 of the 23 sources its claims cite were checked for support.
Shape optimization for high efficiency metasurfaces: theory and implementation
Open accessAbstract
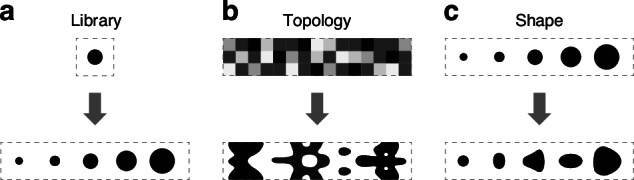
Complex non-local behavior makes designing high efficiency and multifunctional metasurfaces a significant challenge. While using libraries of meta-atoms provide a simple and fast implementation methodology, pillar to pillar interaction often imposes performance limitations. On the other extreme, inverse design based on topology optimization leverages non-local coupling to achieve high efficiency, but leads to complex and difficult to fabricate structures. In this paper, we demonstrate numerically and experimentally a shape optimization method that enables high efficiency metasurfaces while providing direct control of the structure complexity through a Fourier decomposition of the surface gradient. The proposed method provides a path towards manufacturability of inverse-designed high efficiency metasurfaces.
Overview
CoChat Summary
## TL;DR
This paper presents a shape-optimization framework for metasurfaces that keeps the benefits of inverse design while giving direct control over fabrication complexity via Fourier decomposition of boundary gradients. The authors numerically and experimentally show that it can raise efficiencies of library-based metasurfaces while preserving smooth, manufacturable shapes.
## Key findings
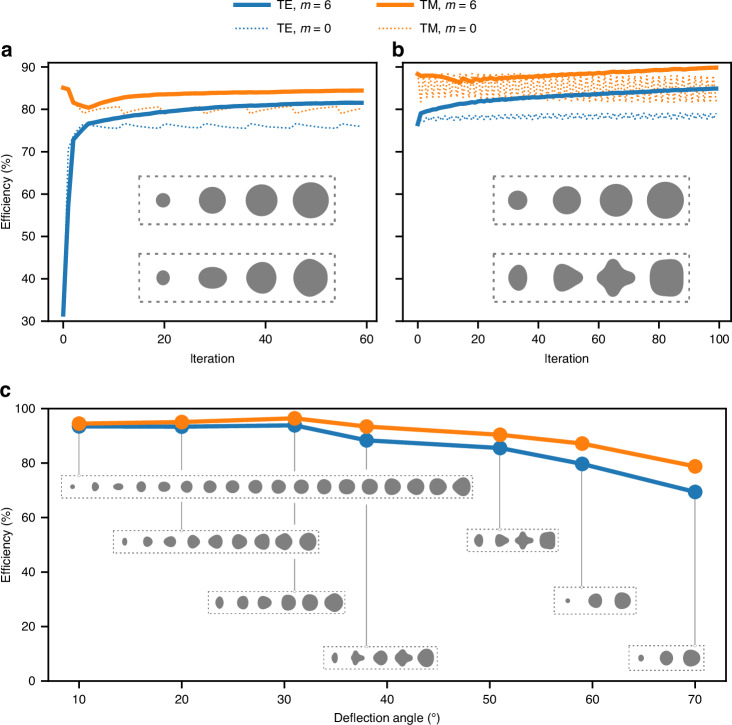
- For a resonant 51° metagrating, an initial library design had only about 30% TE efficiency and 85% TM efficiency; shape optimization improved this to 82% TE and 84% TM with higher Fourier orders, while the simpler m = 0 case improved TE but could not recover TM as well.
- For a non-resonant 51° metagrating, the initial library design had 76% TE and 88% TM efficiency; shape optimization improved this to 85% TE and 90% TM.
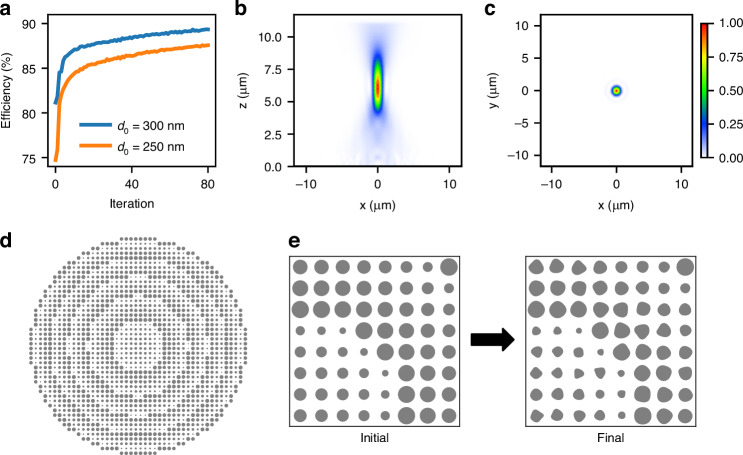
- For metalenses at 1.55 μm, shape optimization improved initial library designs to 88% and 90% efficiency for the two starting geometries mentioned, with smooth boundaries and fabrication constraints respected.
- A fabricated 70° metagrating showed measured peak efficiency close to 70%, and the shape-optimized m = 6 designs had substantially higher efficiencies than the library for both TE and TM.
## Methods
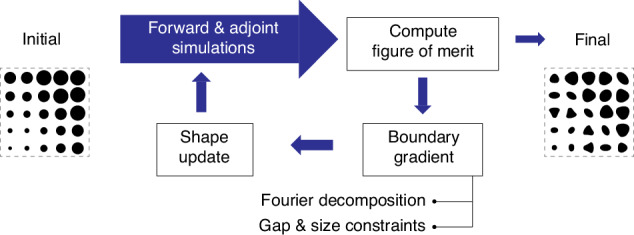
- The method is an adjoint-based shape optimization approach: each iteration uses a forward and adjoint electromagnetic simulation to compute shape gradients for the meta-atoms, then updates boundaries; the gradients are decomposed in a Fourier basis before updating.
- Numerical examples used 1 μm tall amorphous silicon pillars on glass, typically with 1.55 μm operation, 90 nm minimum gap, and 80 nm minimum feature size; metagratings were optimized for deflection angles from 10° to 70°, and metalenses were also demonstrated.
- Experimental validation used conventional top-down fabrication on a 500 μm fused silica wafer with PECVD a-Si, e-beam lithography, and RIE; characterization measured absolute diffraction efficiencies for TE and TM with a tunable laser.
## Limitations
- The paper states that adjoint shape optimization is computationally expensive because it requires solving Maxwell’s equations for both forward and adjoint fields.
- It also states that the method converges to a local optimum, so different initial conditions can lead to different final designs.
- Evident from the text: the method is shown on specific metasurface examples (metagratings and metalenses) and does not demonstrate a broader class of devices beyond what is described here.
Model-written summary. Check it against the paper before relying on it.
Integrity signals
Registry
Cites
Statistics
Figures

Verification
Claims the paper makes
6 Valid · 0 Not valid · 4 Not checked · 32 Own results and interpretations
The cited sources support only part of this claim — read each source’s verdict below.
In the paper
“Rigorous electromagnetic simulation of the full device ensures that the interaction between meta-structures is fully considered.”
§ Shape optimization for high efficiency metasurfaces: theory and implementation > Introduction
What the sources say
- Not checked — no full text of the sourcecites [18] Sell, D., Yang, J., Doshay, S., Yang, R. & Fan, J. A. Large-angle, multifunctional metagratings based on freeform multimode geometries. Nano Lett. 17, 3752–3757 (2017). source
- Not checked — no full text of the sourcecites [27] Jensen, J. S. & Sigmund, O. Topology optimization for nano-photonics. Laser Photonics Rev. 5, 308–321 (2011). source
- Partly supportedcites [28] Molesky, S. et al. Inverse design in nanophotonics. Nat. Photonics 12, 659–670 (2018). sourceExperimental — accuracy not yet measured
The Background (pp. 3–4) describes adjoint optimization using electromagnetic field calculations and design variables across a computational domain. It does not state that simulations cover the full device in every case or that interactions between meta-structures are fully considered, so the claim is stronger and more specific than the source. (LLM, conf=0.77)
- Supportedcites [29] Chung, H. & Miller, O. D. High-na achromatic metalenses by inverse design. Opt. Express 28, 6945–6965 (2020). source
The Introduction (pp. 1–2) contrasts full-wave, full-device inverse design with the limitations of isolated periodic unit cells. The Metalens Inverse Design Framework (p. 4) describes topology optimization using adjoint fields and FDTD simulation of every geometry. Together, these passages support the paraphrase that full-device electromagnetic simulation accounts for interactions between structures. (LLM, conf=0.86)
- Not checked — no full text of the sourcecites [30] Sang, D. et al. Toward high-efficiency ultrahigh numerical aperture freeform metalens: from vector diffraction theory to topology optimization. Laser Photonics Rev. 16, 2200265 (2022). source
plainstates a cause- Asserted: passes — The authors put it forward as true.
- Checkable: passes — It can be checked against evidence.
- Load-bearing: passes — The paper’s conclusions depend on it.
- Based: passes — The paper gives a reason why it holds.
The cited sources support only part of this claim — read each source’s verdict below.
In the paper
“Despite successful designs with very high efficiencies, controlling the complexity of the final structure is a significant challenge, particularly for large scale manufacturing.”
§ Shape optimization for high efficiency metasurfaces: theory and implementation > Introduction
What the sources say
- Supportedcites [6] Kuznetsov, A. I. et al. Roadmap for optical metasurfaces. ACS Photonics 11, 816–865 (2024). source
The Design and Machine Learning section (page unavailable) identifies reliable fabrication of optimized freeform devices as an open challenge and discusses constraints such as minimum feature sizes. The Industry Perspective section (page unavailable) says complex metasurface structures lack reliable large-scale foundry fabrication, supporting the manufacturing aspect of the paraphrase. (LLM, conf=0.86)
- Not checked — no full text of the sourcecites [27] Jensen, J. S. & Sigmund, O. Topology optimization for nano-photonics. Laser Photonics Rev. 5, 308–321 (2011). source
- Not checked — no full text of the sourcecites [30] Sang, D. et al. Toward high-efficiency ultrahigh numerical aperture freeform metalens: from vector diffraction theory to topology optimization. Laser Photonics Rev. 16, 2200265 (2022). source
- Partly supportedcites [31] Wang, E. W., Sell, D., Phan, T. & Fan, J. A. Robust design of topology-optimized metasurfaces. Optical Mater. Express 9, 469–482 (2019). sourceExperimental — accuracy not yet measured
The Introduction (page unavailable) identifies fabrication of nanoscale features as a principal challenge and describes how small holes in a topology-optimized design can disappear during patterning. Section 3 (page unavailable) reports that small geometric deviations make reliable fabrication difficult. These passages support a fabrication challenge, but do not specifically say that controlling the final structure’s complexity is the challenge or discuss large-scale manufacturing. (LLM, conf=0.82)
plain- Asserted: passes — The authors put it forward as true.
- Checkable: passes — It can be checked against evidence.
- Load-bearing: passes — The paper’s conclusions depend on it.
- Based: passes — The paper gives a reason why it holds.
- Supported
In the paper
“The difference is the Fresnel reflection, which if adjusted brings the measured values to 71% and 72%.”
§ Shape optimization for high efficiency metasurfaces: theory and implementation > Discussion The shape optimization method discussed in this paper presents an alternative to conventional library approach in metasurface design and to the more general topology optimization. As discussed, despite being simple and computationally fast, the library method falls short in many aspects, most notably by not capturing non-local coupling effects and not being amenable to general waveform incidences. Our results demonstrate that library structures exhibiting low efficiency due to the aforementioned limitations can be substantially improved with shape optimization. We show results where a resonant library structure with only 30% TE efficiency was enhanced to 82%, while still maintaining high TM efficiency at 84%, smooth boundaries and respecting minimum features size and minimum gaps. Furthermore, we showed that even the highest efficiency library is also significantly improved going from 76% to 85% for TE, while maintaining high efficiency for TM at 90%, and again respecting fabrication constraints. The general shape optimization explores more degrees of freedom than parametrized structures, and it is not therefore surprising that it leads to higher efficiencies. For example, parametrized aSi elliptical pillars were used to design 50 deg gratings at 900 nm wavelength and obtained absolute efficiency of 64% for a single polarization40. Comparatively, shape optimization leads to TE and TM efficiency of 85% and 90%. Using rectangular pillars, a metalens with 0.78 numerical aperture operating at 850 nm was designed using parametrized rectangular aSi pillars, and obtained efficiency of 78% (no minimum feature size or gap constraints). In contrast, shape optimized metalens with slightly higher NA of 0.83 resulted in efficiency of 90%, including fabrication constraints. Compared to topology optimization, shape optimization explores a reduced design space. In topology, the output structure can contain many more detailed features, and it most likely leads to higher overall efficiencies than shape optimization. For example, topology optimized gratings showed theoretical efficiencies for a 70 degrees deflection angle around 96% (average TE/TM)18. Comparatively, shape optimization obtained lower values of 74% average TE/TM as shown in Fig. 4c. However, as discussed such topology optimized structures are more difficult to fabricate than shape optimized structures. Another topology optimized metagrating at 75 degrees deflection angle that was actually fabricated showed experimental efficiencies of 74% and 75%, for TE and TM, respectively18. The definition of efficiency here was the power in the deflected beam normalized to the power transmitted through the bare silicon dioxide substrate. This definition differs from ours in the sense that we compute efficiency as the power in the deflected beam normalized by the power incident on the metasurface. The difference is the Fresnel reflection, which if adjusted brings the measured values to 71% and 72%. Comparatively, the measured efficiencies for the 70 degrees shape optimized structures from Fig. 8 were on a similar level at 70%. The shape optimization algorithm was demonstrated here for two objective functions, i.e., TE and TM polarization, but it can be easily extended to more objectives such as multiple wavelengths or multiple angles of incidence etc. It can also be extended to more complex structures such as bi-layer or multi-height metasurfaces42,43. Moreover, although the focus of our work is on dielectric metasurfaces as they tend to result in higher transmissions than metallic ones, the adjoint optimization method can be applied to any general permittivity44. As a final note, the computational cost of this optimization method is expensive, as it requires solving Maxwell equations for both forward and adjoint fields. In our optimization, we used a commercial finite-element solver in the frequency domain. Multi-wavelength optimization can greatly benefit from finite-difference time domain solvers, as the fields for all wavelengths can be obtained from only one forward and one adjoint simulations. Finally, combining this approach with GPU-accelerated FDTD can greatly speed up solving the fields37,45. In general, the adjoint formulation tends to converge to a local optimum, with different initial conditions converging to different local optima, as was illustrated in the examples discussed here. Coupling the optimization method with parallelization is therefore beneficial to allow many starting geometries to be explored efficiently. In summary, we presented a general shape optimization method that enables optimization of high efficiency metasurfaces. Coupled with a Fourier decomposition of the boundary gradient, the method enables high performance devices while providing greater control over the structure complexity and rigorously enforcing minimum feature size and minimum gaps. Various metagratings and metalenses were simulated, with experimental results validating the expected efficiencies. We believe these results provide a path towards manufacturability of inverse-designed high efficiency metasurfaces.
What the sources say
- Not checked — no full text of the sourcecites [18] Sell, D., Yang, J., Doshay, S., Yang, R. & Fan, J. A. Large-angle, multifunctional metagratings based on freeform multimode geometries. Nano Lett. 17, 3752–3757 (2017). source
plainstates a causeSingle case- Asserted: passes — The authors put it forward as true.
- Checkable: passes — It can be checked against evidence.
- Load-bearing: unclear — It is unclear whether the paper’s conclusions depend on it.
- Based: passes — The paper gives a reason why it holds.
A result the paper reports from its own data — it cites no other source for it, so there is none to check. The quote shows it is in the paper.
In the paper
“For example, the 70 degrees metagrating showed average TE/TM efficiency of 74%.”
§ Shape optimization for high efficiency metasurfaces: theory and implementation > Results > Numerical simulations To illustrate the method, we applied shape optimization to design several metagratings and metalenses at 1.55 μm operating wavelength, all based on 1 μm tall amorphous silicon (aSi) pillars on a glass substrate. In every example discussed here, we imposed minimum gap between pillars of 90 nm and minimum feature size of 80 nm. Furthermore, we targeted polarization insensitive operation and therefore simultaneously optimized for TE and TM incident polarizations. In the first example, a meta-grating was designed to deflect light at 51°. The initial structure was created based on the library approach, and contains 4 circular pillars, each on a 500 nm unit cell. In the library method, the pillars’ diameters are chosen so that they impart a phase profile with steps of 2π/N (N = 4 in this example). The phase imparted by the first unit cell is, however, arbitrary, as different values simply represent different global phases. One can therefore freely choose the diameter of the first pillar as long as subsequent diameters correspond to a 2π/N phase shift. Despite nominally imparting equivalent phase profiles, these meta-gratings with different pillar sizes exhibit distinct non-local interaction, and may perform very differently. This is exactly the case observed here for the 51°, in which certain choices of the first pillar diameter create a resonance that severely reduces the first order diffraction efficiency for TE light. We applied shape optimization to two metagratings differing only by the choice of the first pillar diameter, one exhibiting low efficiency due to the appearance of a resonance for TE, and another with the highest efficiency for this library (which was found after sweeping the first pillar diameter for all values available in the library from 100 nm to 410 nm). The initial library design for the resonant metagrating has first order diffraction efficiency of only about 30% for TE polarization (see iteration = 0 in Fig. 4a), while it is as high as 85% for TM polarization. Such low performance for TE cannot be predicted from the performance of the individual meta-atoms, as all values of pillar diameters in the library are highly transmissive (above 80%), and of course their response is polarization independent by symmetry. We then applied shape optimization and observed that the performance is significantly improved as shown in Fig. 4a. The solid and dashed curves represent separate optimizations with different Fourier orders. The enhancement was observed either when the Fourier order is restricted to m = 0 (dashed lines, final geometry in upper inset) or when we allowed up to m = 6 (solid lines, final geometry in lower inset). Note that in both cases, at the beginning of the optimization over the first few iterations, the improvement in TE polarization comes at the expense of the TM efficiency. This initial degradation in the TM efficiency could not be recovered with the m = 0 case, demonstrating a clear limitation in restricting the shapes to circles. With higher Fourier orders, eventually the TM efficiency recovers leading to a device with efficiencies of 82% and 84% for TE and TM, respectively. Despite allowing higher Fourier order, the final shapes are still smooth and respect the gap and minimum feature constraints. In the second case shown in Fig. 4b, the initial structure was the highest average TE/TM efficiency obtained with this library. Despite that, the initial efficiency of 76% for TE was still significantly improved to 85%, with no degradation on the TM efficiency (which actually slightly improved from 88% to 90%). This example illustrates that the shape optimization can be used to eliminate resonances that are not possible to predict from the library alone, as well as to push the performance beyond the highest achievable with such library. Degradation in efficiency due to non-local effects is not specific to this 51° metagrating, and was observed in other deflection angles from 10 to 70 degrees, in some cases TE and in other cases for TM polarizations. Furthermore, a choice of initial diameter that leads to relatively good performance for one deflection angle is not necessarily the best choice for another angle, illustrating another challenge of relying solely on the library approach. We designed various other metagratings using shape optimzation from angles varying between 10 and 70 degrees, with the final efficiencies and shapes shown in Fig. 4c. For example, the 70 degrees metagrating showed average TE/TM efficiency of 74%. As mentioned, the shape optimization method is not limited to metagratings and can be applied to any general metasurface. To illustrate this, we designed a metalens operating at 1.55 μm and the results are shown in Fig. 5. The optimization domain was again initialized with a structure based on a library of aSi circular pillars on a glass substrate. The library unit cell is 500 nm and the pillars range from 100 to 410 nm in diameter, with height of 1 μm. The lens was designed to impart a phase transformation with focus of 5.3 μm over a total diameter of 2r = 23 μm, nominally resulting in a numerical aperture of NA = sin[tan−1(r/f)] = 0.92. However, the lens was illuminated with a Gaussian beam with waist radius w = 5.2 μm, which focused at f = 5.3 μm limits the NA of the system to approximately NA = 0.83. We optimized two metalenses that differ only by a global phase, represented by the diameter of the innermost pillars of d = 250 nm and d = 300 nm. As can be seen on Fig. 5a, these nominally equivalent metalenses have different efficiencies of 75% and 81% (values at iteration 0), respectively. Shape optimization was applied with Fourier decomposition up to m = 6, and again with minimum gap of 90 nm and minimum feature of 80 nm. Given the circular symmetry of the device, we only simulated one-quarter of the structure, and only one polarization (TE). Polarization insensitivity is enforced by computing the gradient for TM polarization from the TE gradient rotated by 90 deg. The optimization results in Fig. 5a show that the efficiency is substantially improved for both initial structures, reaching 88% and 90%. These results reinforce two aspects already observed for metagratings: first, shape optimization can improve the efficiency of library structures, regardless of the specific initial choice. This is not to say that every choice leads to the same final efficiency though (as is clear in Fig. 5a). Second, the efficiency is improved beyond what could be achieved with such library. Figure 5b shows cuts of the z-component of Poynting vector in the xz plane (z being the propagation direction), starting at z = 0 (base of the pillars) and in the free-space region (above the 1 μm pillar height) with very little undesired diffraction observed. The beam at the focus plane is shown in Fig. 5c. The full metalens structure for the d = 300 nm case is shown Fig. 5d, e shows a zoomed region at the metalens center before and after shape optimization. As can be seen, all features have smooth boundaries, the minimum feature size is approximately 130 nm, and respecting the 80 nm minimum gap. As outlined in the Supplementary Information, all values reported here represent the absolute efficiency, defined as the projection of the output field onto the target field divided by the power incident on the metasurface.
plainstates a causeSingle case- Asserted: passes — The authors put it forward as true.
- Checkable: passes — It can be checked against evidence.
- Load-bearing: unclear — It is unclear whether the paper’s conclusions depend on it.
- Based: passes — The paper gives a reason why it holds.
A result the paper reports from its own data — it cites no other source for it, so there is none to check. The quote shows it is in the paper.
In the paper
“As mentioned, this was the highest efficiency obtained with this library and one can see that differently from the previous case, it pushed away the resonance approximately 34 nm above the design wavelength.”
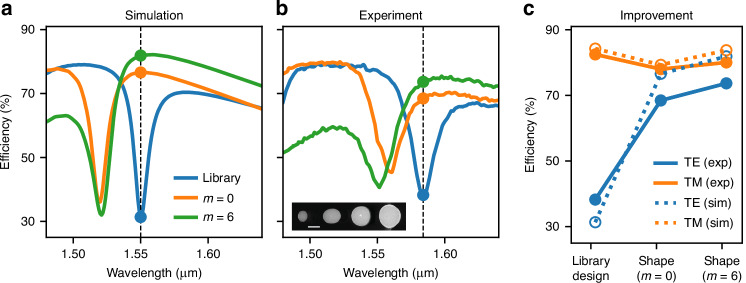
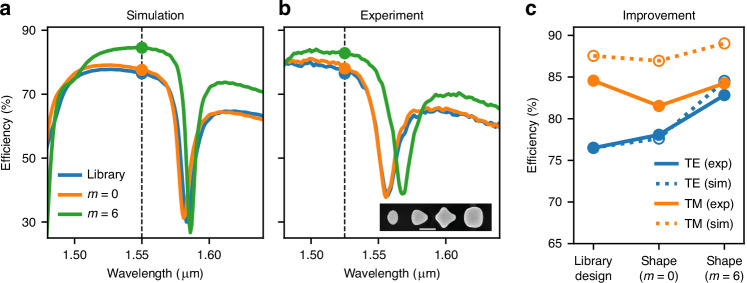
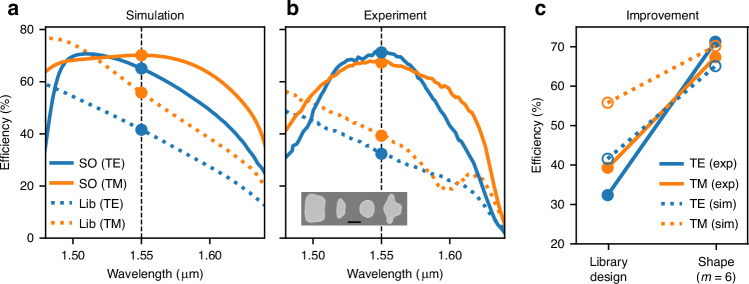
§ Shape optimization for high efficiency metasurfaces: theory and implementation > Results > Fabrication and characterization To validate the method, various metagratings were fabricated and characterized experimentally. The samples were fabricated using a conventional top-down approach, allowing for high-throughput and reproducibility. Choosing amorphous silicon as the nanopillars’ material allows for low losses and high contrast refractive index across the telecommunications c-band. The metasurfaces were fabricated on a 500 μm thick fused silica wafer, coated with 1 μm aSi using PECVD. An adhesive layer (HDMS) is spun on the wafer to promote adhesion of the negative e-beam resist (ma-N 2400) and the latter is then baked and coated with a charging dissipating solution (e-spacer). The nanopillars pattern is then exposed using e-beam lithography and developed in AZ 726 developer, while the e-spacer layer is removed in water. Exploiting a RIE (SPTS Rapier) technique, with simultaneous injection of etcher (SF6) and passivation (C4F8) gases in the chamber, the pattern is transferred onto the a-Si, using the resist as etching mask. The residual resist is then removed with oxygen plasma asher (Matrix Plasma Asher). After fabrication, the samples were characterized using a tuneable laser to measure the diffraction efficiency over a wide spectral range for both TE and TM polarizations. All values reported here represent the absolute diffraction efficiencies, defined as the ratio between the output power in the first order diffraction and the power incident on the metasurface, exactly how it is defined in the simulations (often in the literature, relative diffraction efficiencies are reported, and some times, even absolute efficiencies values don’t properly consider Fresnel reflections at the glass-air interface). A detailed description of the experimental setup and procedure is provided in the Supplementary Information. Figure 6a and b show the simulated and experimental spectral responses for the resonant 51° metagrating design from Fig. 4a. We only show the TE polarization as the efficiency for TM is relatively flat in this wavelength region. The initial library design (in blue) exhibits a clear resonance at 1.55 μm. In the experiment, this resonance was slightly red-shifted to 1.58 μm, which we attribute to small variations in the fabrication parameters such as refractive index, small sidewall angle and pillar sizes. For the sake of comparison between experiment and simulations, all efficiencies were then measured at the resonance wavelength, as indicated by the solid dots in the figures. In both, simulations and experiments, the shape optimized metagratings exhibited improved efficiencies. Comparing their spectra, we observe that shape optimization improves the diffraction efficiency by shifting the resonance away from the design wavelength. Furthermore, one can see that the shape optimization induces a tilt in the spectrum and the efficiency at the design wavelength, to the right of the resonance, is further increased. Remarkably, these spectral signatures, shift and tilt, are clearly observed in the experimental results in Fig. 6b. A comparison of the efficiencies predicted in simulations and observed experimentally is shown in Fig. 6c for both TE and TM, with reasonably good agreement. It is also remarkable that the experimental results show the trade-off predicted in the TE-TM efficiency for the two different Fourier orders: simple circles (m = 0) increase the TE at the expense of TM while m = 6 breaks this trade-off. We also fabricated the non-resonant 51° meta-grating design from Fig. 4b, and the results for TE are shown in Fig. 7. As mentioned, this was the highest efficiency obtained with this library and one can see that differently from the previous case, it pushed away the resonance approximately 34 nm above the design wavelength. Again the spectrum is slightly shifted in the experiment, and therefore all measurements were shifted accordingly. Differently than in the previous resonant case, the shape optimization now does not lead to significant shifts in the resonance, and mostly push the spectrum upwards at the design wavelength. The experimental results exhibit the same behavior as predicted in simulations, and a quantitative comparison in the efficiencies is shown in Fig. 7c. Similarly to the resonant case, here we also observe that the higher Fourier order m = 6 exhibits high efficiency for both TE and TM, reaching about 83% and 84% absolute efficiencies (higher than both the library design and the m = 0 device). Finally, we then designed and fabricated a 70° metagrating, showing broadband and polarization insensitive operation. The spectral efficiencies for the initial library design and for the shape optimized metagratings are shown in Fig. 8 in dashed and solid lines, respectively. The experimental results in (b) reproduce qualitatively the simulations in (a), with measured peak efficiency close to 70%. The shape optimized meta-gratings with Fourier order m = 6 exhibit a relatively flat spectrum centered at 1.55 μm, with substantially higher efficiencies than the library for both TE and TM. A quantitative comparison between the simulation and experimental efficiencies is shown in Fig. 8c.
plainstates a causeSingle case- Asserted: passes — The authors put it forward as true.
- Checkable: passes — It can be checked against evidence.
- Load-bearing: unclear — It is unclear whether the paper’s conclusions depend on it.
- Based: passes — The paper gives a reason why it holds.
12 more claims
Create a free account to see all 42 claims and every source verdict.
- It may state two separate claims as one. 21
- Probably not a substantial claim. 8
- The quote only partly states this claim. 1
Self-check
Percentages, sums and reported differences re-computed from the paper’s own numbers.
A note, not an issue: for example, a cited work that was retracted only after this paper was published, which its authors could not have known.
In the paper
“The lens was designed to impart a phase transformation with focus of 5.3 μm over a total diameter of 2r = 23 μm, nominally resulting in a numerical aperture of NA = sin[tan−1(r/f)] = 0.92.”
§ Shape optimization for high efficiency metasurfaces: theory and implementation > Results > Numerical simulations
Reported 0.92 · recomputed 2.169811
Citations
Cites
Light Propagation with Phase Discontinuities: Generalized Laws of Reflection and Refraction
Yu, N., Genevet, P., Kats, M. A., Aieta, F., Tetienne, J.-P., Capasso, F., & Gaburro, Z. (2011) · Science · doi:10.1126/science.1210713 · Cited by 10,361
Self-citationFlat optics with designer metasurfaces
Yu, N., & Capasso, F. (2014) · Nature Materials · doi:10.1038/nmat3839 · Cited by 5,984 · cited 1×
“Wavefront shaping using metasurfaces has attracted significant scientific and technological interest in recent years [1–6].”
Self-citationPlanar Photonics with Metasurfaces
Kildishev, A. V., Boltasseva, A., & Shalaev, V. M. (2013) · Science · doi:10.1126/science.1232009 · Cited by 3,110
Optically resonant dielectric nanostructures
Kuznetsov, A. I., Miroshnichenko, A. E., Brongersma, M. L., Kivshar, Y. S., & Luk’yanchuk, B. (2016) · Science · doi:10.1126/science.aag2472 · Cited by 2,884
Arbabi, A., Horie, Y., Bagheri, M., & Faraon, A. (2015) · Nature Nanotechnology · doi:10.1038/nnano.2015.186 · Cited by 2,813 · cited 1×
“The most common design approach is based on libraries of meta-atoms (Figure 1a), using either parametrized shapes or free-form meta-atoms [3, 7, 20–24].”
A broadband achromatic metalens for focusing and imaging in the visible
Chen, W. T., Zhu, A. Y., Sanjeev, V., Khorasaninejad, M., Shi, Z., Lee, E., & Capasso, F. (2018) · Nature Nanotechnology · doi:10.1038/s41565-017-0034-6 · Cited by 1,866 · cited 2×
“…many degrees of freedom of an incoming beam, including phase, amplitude, polarization, and dispersion has led to a number of demonstrations in areas ranging from imaging, polarization optics, communications, atom trapping, optical computing and image processing, nonlinear optics and others [7–16].”
Self-citationInverse design in nanophotonics
Molesky, S., Lin, Z., Piggott, A. Y., Jin, W., Vucković, J., & Rodriguez, A. W. (2018) · Nature Photonics · doi:10.1038/s41566-018-0246-9 · Cited by 1,818 · cited 1×
“Topology and shape optimization in photonics are both inverse design techniques based on the adjoint method [25, 26].”
Matrix Fourier optics enables a compact full-Stokes polarization camera
Rubin, N. A., D’Aversa, G., Chevalier, P., Shi, Z., Chen, W. T., & Capasso, F. (2019) · Science · doi:10.1126/science.aax1839 · Cited by 1,017
Self-citationTopology optimization for nano‐photonics
Jensen, J. S., & Sigmund, O. (2011) · Laser & Photonics Reviews · doi:10.1002/lpor.201000014 · Cited by 767 · cited 3×
“These challenges have stimulated recent research to incorporate manufacturing robustness in the design process [6, 25, 28, 29], either external to the adjoint formulation such as applying structural blurring every so often during optimization, or including penalty terms in the figure of merit to…”
Adjoint shape optimization applied to electromagnetic design
Lalau-Keraly, C. M., Bhargava, S., Miller, O. D., & Yablonovitch, E. (2013) · Optics Express · doi:10.1364/oe.21.021693 · Cited by 753
Research works printed but not linked: 1
- Landau, L. D. et al. Electrodynamics of continuous media, 8 (Elsevier, 2013).
Cited by
Kong, L., Zhang, F., Cheng, S., & Zhang, X. (2024) · Laser & Photonics Review · doi:10.1002/lpor.202401608 · Cited by 41
Trapping of single atoms in metasurface optical tweezer arrays
Holman, A., Xu, Y., Sun, X., Wu, J., Wang, M., Zhu, Z., Seo, B., Yu, N., & Will, S. (2026) · Nature · doi:10.1038/s41586-025-09961-5 · Cited by 79
“…recent demonstrations of dispersion-engineered and inverse-designed metasurfaces have already demonstrated an efficiency above 90% over a wavelength range of hundreds of nanometres 58,69 , and a recent quasi-three-dimensional metasurface even demonstrated >99% anomalous-refraction efficiency 70 .”
HiLAB: A Hybrid Inverse‐Design Framework
Marzban, R., Abiri, H., Pestourie, R., & Adibi, A. (2025) · Small Methods · doi:10.1002/smtd.202500975 · Cited by 21
“Such approaches have successfully been applied to metasurface deflectors [7], polarization controllers [8], and mode converters [18], among others [19].”
Inverse Design in Nanophotonics via Representation Learning
Marzban, R., Adibi, A., & Pestourie, R. (2025) · Advanced Optical Materials · doi:10.1002/adom.202502062 · Cited by 33
“More constrained parameterizations, such as shape-based [43] or level-set methods [112], reduce the search space.”
An efficient on-demand inverse design of terahertz metasurfaces via deep learning
Jue, X., Wang, Y., Xie, Z., Han, D., Li, S., & Chen, J. (2025) · Optics & Laser Technology · doi:10.1016/j.optlastec.2025.113723 · Cited by 15
Metadata
- Authors
- Dainese, P., Marra, L., Cassara, D., Portes, A., Oh, J., Yang, J., Palmieri, A., Rodrigues, J. R., Dorrah, A. H., & Capasso, F.
- Affiliations
- Corning (United States) (US)
- Harvard University (US)
- Venue
- Light: Science & Applications
- Published
- 2024-10-29
- Volume
- 13
- Issue
- 1
- Pages
- 300-300
- ISSN
- 2047-7538 (ISSN-L)
- PMC
- PMC11519467
- OpenAlex
- W4403882296
- Cited by
- 75
- References
- 47
- Citations by year
- 2026: 38 · 2025: 32 · 2024: 5
- FWCI
- 5.84
- Type
- journal article
- Language
- en
- Open access
- gold
- doi.org
- Licence
- cc-by
- creativecommons.org/licenses/by/4.0 (tdm)
- creativecommons.org/licenses/by/4.0 (vor)
- Locations
- Light Science & Applications (publishedVersion, cc-by)
- PubMed Central (publishedVersion, cc-by)
- PubMed (publishedVersion)
- arXiv (Cornell University) (submittedVersion, cc-by)
- DOAJ (DOAJ: Directory of Open Access Journals) (submittedVersion)
- Figshare (submittedVersion, cc-by)
- arXiv (Cornell University) (cc-by)
- Topics
- Physical Sciences › Materials Science › Electronic, Optical and Magnetic Materials › Metamaterials and Metasurfaces Applications
- Physical Sciences › Engineering › Electrical and Electronic Engineering › Advanced Antenna and Metasurface Technologies
- Physical Sciences › Physics and Astronomy › Acoustics and Ultrasonics › Acoustic Wave Phenomena Research
- Keywords
- metasurfaces, shape optimization, inverse design, topology optimization, meta-atoms, nonlocal coupling, Fourier decomposition, surface gradient, manufacturability
About these checks
Registry, retraction, Cites and statistics results are computed, not judged, with one exception: a printed reference that no index lists is read once by a model before it counts as a citation error. Claims are extracted by a model and kept only when their quote appears verbatim in the text; each cited source is then checked, with a model’s help, for whether it says what the claim relies on. Those verdicts can be wrong — read the claim’s quote and the cited source before relying on one.
The claim verdicts this report counts are experimental: their accuracy is not yet measured.
A language model drew the claims from the paper on 2026-10-10, under version 3 of the claim definition (model deepseek-v4.1-flash, prompt extract-v3).
A second model labelled each claim on 2026-10-10 (model jev-1.13-20260917, definition revision gold-guideline-v0.2).
Cited sources are checked with a language model’s help (gpt-6-sol).
Statistics and arithmetic are recomputed, not judged.
Confidence bands are shown only for fields calibrated on our annotated test set. None is calibrated yet, so no band is shown.
What counts as a claim ›How we measure confidence ›How we check this ›
Are you an author, or do you see a problem with this page? Request a review
How to cite
Cite CoChat for the checks on this page, and the paper for its own findings.
- This page
- CoChat. (2026). Citation check: Shape optimization for high efficiency metasurfaces: theory and implementation. https://app.cochat.ai/papers/10.1038/s41377-024-01629-5
- The paper
- Dainese, P., Marra, L., Cassara, D., Portes, A., Oh, J., Yang, J., Palmieri, A., Rodrigues, J. R., Dorrah, A. H., & Capasso, F. (2024). Shape optimization for high efficiency metasurfaces: theory and implementation. Light: Science & Applications. https://doi.org/10.1038/s41377-024-01629-5
Data sources
Bibliographic data: Semantic Scholar, OpenAlex, Crossref.
Contains information from the Semantic Scholar Academic Graph Datasets, made available under the ODC Attribution License (ODC-BY 1.0).
Semantic Scholar’s data is described in: Kinney, R., et al. (2023). The Semantic Scholar Open Data Platform. arXiv:2301.10140.
