

The DOI matches its Crossref record; 10 of the 10 references it cites were found in a registry or an index.
Power and optimal study design in iPSC-based brain disease modelling
Abstract
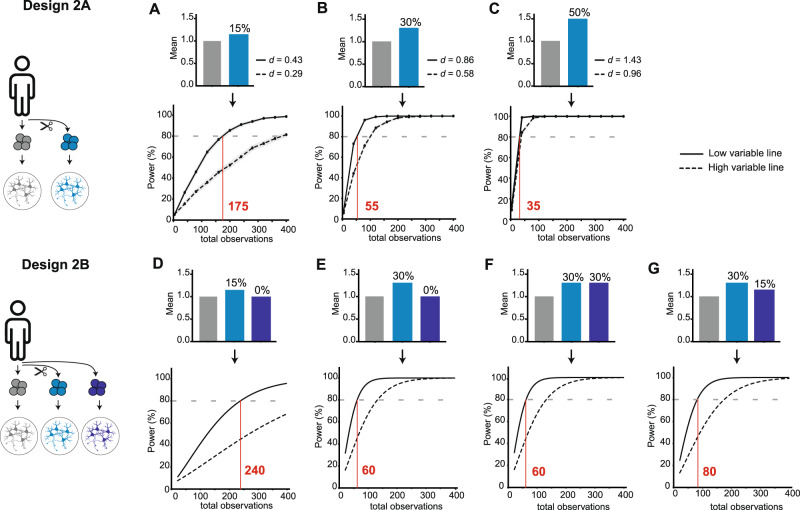
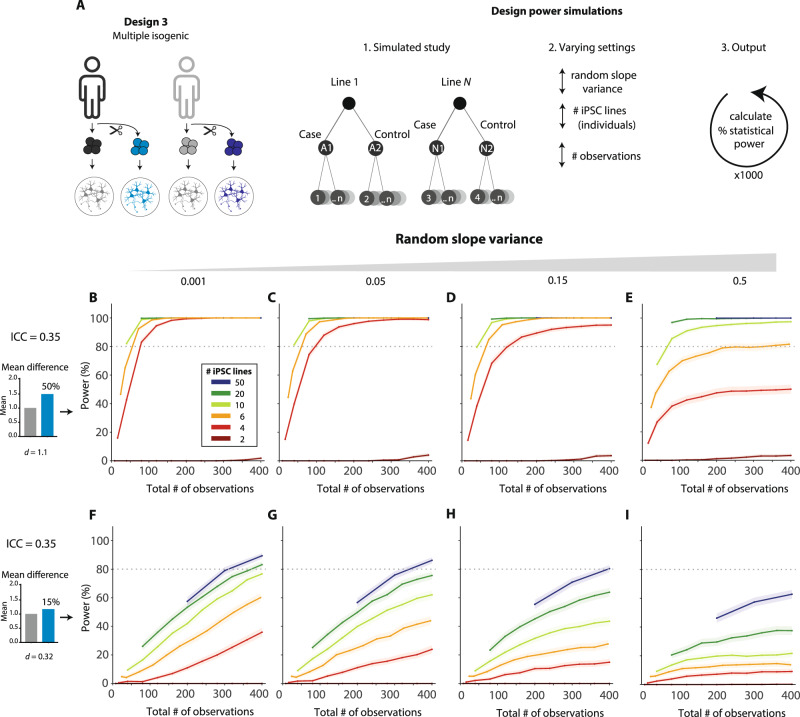
Studies using induced pluripotent stem cells (iPSCs) are gaining momentum in brain disorder modelling, but optimal study designs are poorly defined. Here, we compare commonly used designs and statistical analysis for different research aims. Furthermore, we generated immunocytochemical, electrophysiological, and proteomic data from iPSC-derived neurons of five healthy subjects, analysed data variation and conducted power simulations. These analyses show that published case–control iPSC studies are generally underpowered. Designs using isogenic iPSC lines typically have higher power than case–control designs, but generalization of conclusions is limited. We show that, for the realistic settings used in this study, a multiple isogenic pair design increases absolute power up to 60% or requires up to 5-fold fewer lines. A free web tool is presented to explore the power of different study designs, using any (pilot) data.
Overview
The claims and statistics of this paper haven’t been checked yet.
Run the check — free, no account needed. It reads the open-access text and checks the sources it cites.
Integrity signals
Registry
Cites
Statistics
Figures
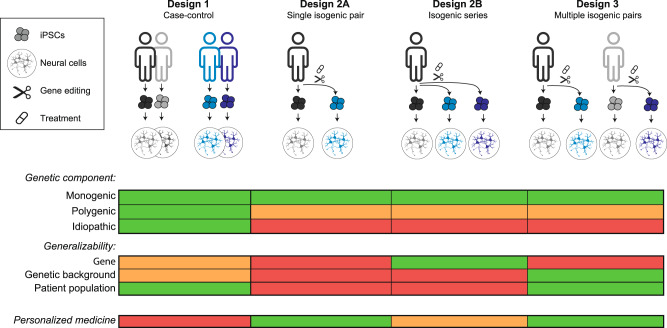
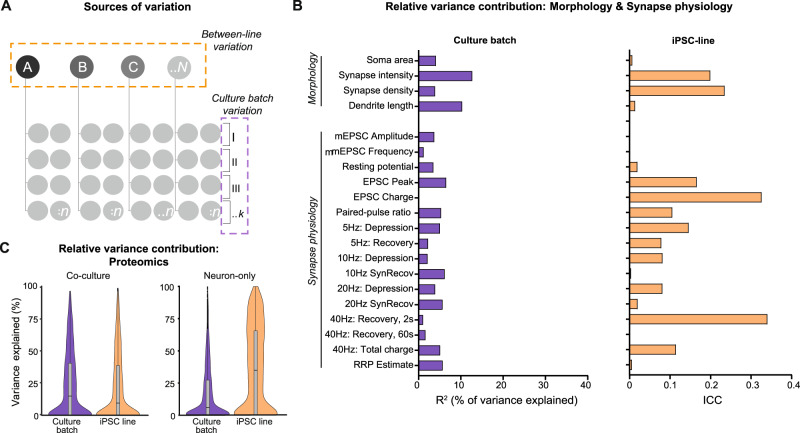
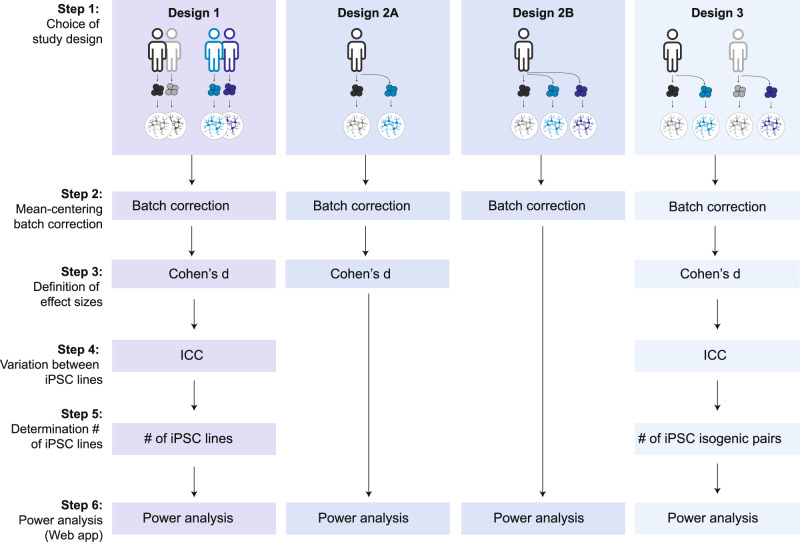
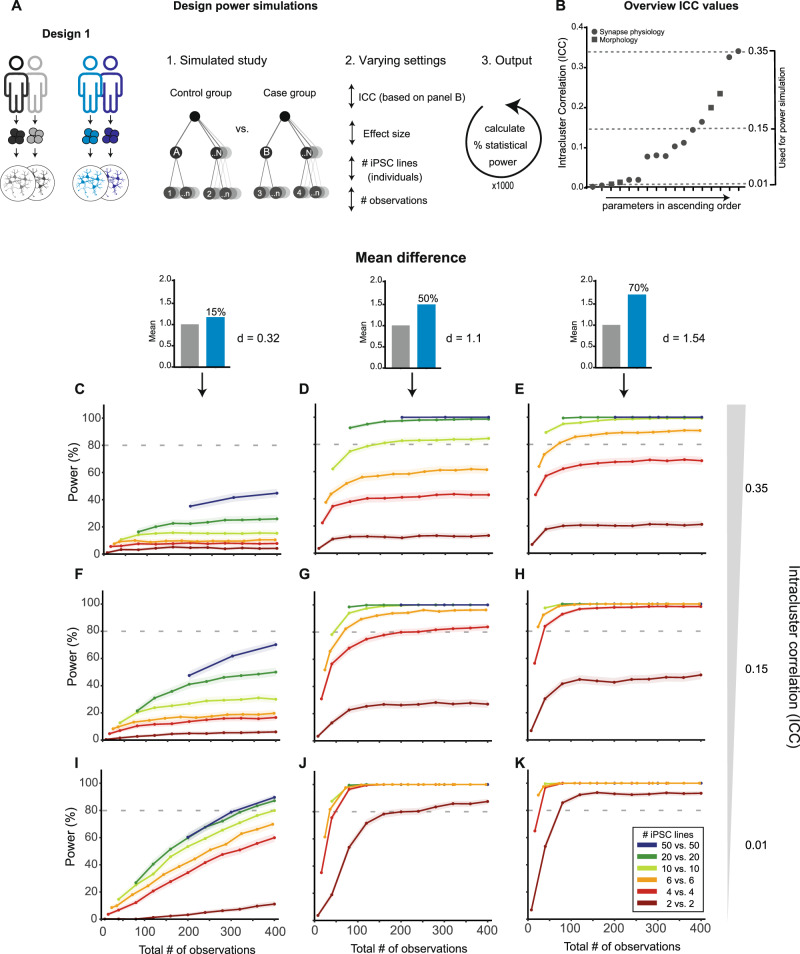
Verification
Claims the paper makes
The claims and statistics of this paper haven’t been checked yet.
Run the check — free, no account needed. It reads the open-access text and checks the sources it cites.
Claims other papers make about this one
Each is checked against this paper’s own text: does it say what the citing paper says it does?
In the citing paper
“Using multiple iPSC lines, rather than replicating the experiment within a single line, can increase statistical power [162]. However, it also introduces the risk of high inter-individual variability, as may have been occasionally the case in the present study.”
From microRNA-132 attenuates inflammation in induced pluripotent stem cell-derived microglia from Alzheimer’s disease patients (2026) · cites this paper as [162]
Self-check
Percentages, sums and reported differences re-computed from the paper’s own numbers.
The self-check needs the paper’s full text.
Citations
Cites
Power failure: why small sample size undermines the reliability of neuroscience
Button, K. S., Ioannidis, J. P. A., Mokrysz, C., Nosek, B. A., Flint, J., Robinson, E. S. J., & Munafò, M. R. (2013) · Nature Reviews Neuroscience · doi:10.1038/nrn3475 · Cited by 7,641 · cited 1×
“Unfortunately, “power failure” is a general and ubiquitous problem in neuroscience: meta-analyses indicate that the majority of studies across neuroscience subfields has inadequate statistical power [1, 2].”
BackgroundBruderer, R., Bernhardt, O. M., Gandhi, T., Miladinović, S. M., Cheng, L.-Y., Messner, S., Ehrenberger, T., Zanotelli, V., Butscheid, Y., Escher, C., et al. (2015) · Molecular & Cellular Proteomics · doi:10.1074/mcp.m114.044305 · Cited by 1,238
Erroneous analyses of interactions in neuroscience: A problem of significance
Nieuwenhuis, S., Forstmann, B. U., & Wagenmakers, E.-J. (2011) · Nature Neuroscience · doi:10.1038/nn.2886 · Cited by 864
Common genetic variation drives molecular heterogeneity in human iPSCs
Kilpinen, H., Goncalves, A., Leha, A., Afzal, V., Alasoo, K., Ashford, S., Bala, S., Bensaddek, D., Casale, F. P., Culley, O. J., et al. (2017) · Nature · doi:10.1038/nature22403 · Cited by 586
Genetic Background Drives Transcriptional Variation in Human Induced Pluripotent Stem Cells
Rouhani, F., Kumasaka, N., de Brito, M. C., Bradley, A., Vallier, L., & Gaffney, D. (2014) · PLoS Genetics · doi:10.1371/journal.pgen.1004432 · Cited by 294
Kyttälä, A., Moraghebi, R., Valensisi, C., Kettunen, J., Andrus, C., Pasumarthy, K. K., Nakanishi, M., Nishimura, K., Ohtaka, M., Weltner, J., et al. (2016) · Stem Cell Reports · doi:10.1016/j.stemcr.2015.12.009 · Cited by 257
Molecular and functional variation in iPSC-derived sensory neurons
HIPSCI Consortium, Schwartzentruber, J., Foskolou, S., Kilpinen, H., Rodrigues, J., Alasoo, K., Knights, A. J., Patel, M., Goncalves, A., Ferreira, R., et al. (2018) · Nature Genetics · doi:10.1038/s41588-017-0005-8 · Cited by 223
Extrapolating from animals to humans
Ioannidis, J. P. A. (2012) · Science Translational Medicine · doi:10.1126/scitranslmed.3004631 · Cited by 124
Germain, P.-L., & Testa, G. (2017) · Stem Cell Reports · doi:10.1016/j.stemcr.2017.05.012 · Cited by 94
Systematic assessment of variability in the proteome of iPSC derivatives
Beekhuis-Hoekstra, S. D., Watanabe, K., Werme, J., de Leeuw, C. A., Paliukhovich, I., Li, K. W., Koopmans, F., Smit, A. B., Posthuma, D., & Heine, V. M. (2021) · Stem Cell Research · doi:10.1016/j.scr.2021.102512 · Cited by 23
Research works printed but not linked: 26
- Nord CL, Valton V, Wood J, Roiser JP. Power-up: a reanalysis of ‘power failure’ in neuroscience using mixture modelling. J Neurosci. 2017;37:8051–61. · DOI
- Galbraith S, Daniel JA, Vissel B. A study of clustered data and approaches to its analysis. J Neurosci. 2010;30:10601–8. · DOI
- Aarts E, Verhage M, Veenvliet JV, Dolan CV, Van Der Sluis S. A solution to dependency: using multilevel analysis to accommodate nested data. Nat Neurosci. 2014;17:491–6. · DOI
- Aarts E, Dolan CV, Verhage M, Van der Sluis S. Multilevel analysis quantifies variation in the experimental effect while optimizing power and preventing false positives. BMC Neurosci. 2015;16:1–15. · DOI
- Boisgontier MP, Cheval B. The anova to mixed model transition. Neurosci Biobehav Rev. 2016;68:1004–5. Available from https://doi.org/10.1016/j.neubiorev.2016.05.034. · DOI
- Yu Z, Guindani M, Grieco SF, Chen L, Holmes TC, Xu X. Beyond t test and ANOVA: applications of mixed-effects models for more rigorous statistical analysis in neuroscience research. Neuron. [Internet]. 2022;110:21–35. Available from https://doi.org/10.1016/j.neuron.2021.10.030. · DOI · Paper page
- Volpato V, Webber C Addressing variability in iPSC-derived models of human disease: Guidelines to promote reproducibility. DMM Dis Model Mech. 2020;13. · DOI · Paper page
- Nehme R, Zuccaro E, Ghosh SD, Li C, Sherwood JL, Pietilainen O, et al. Combining NGN2 programming with developmental patterning generates human excitatory neurons with NMDAR-mediated synaptic transmission. Cell Rep. [Internet]. 2018;23:2509–23. https://www.sciencedirect.com/science/article/pii/S2211124718306259. · DOI
- Meijer M, Rehbach K, Brunner JW, Classen JA, Lammertse HCA, van Linge LA, et al. A single-cell model for synaptic transmission and plasticity in human iPSC-derived neurons. Cell Rep. 2019;27:2199–2211.e6. · DOI
- Gonzalez-Lozano MA, Koopmans F. Data-independent acquisition (SWATH) mass spectrometry analysis of protein content in primary neuronal cultures. In: Li K, editor. Neuroproteomics. Humana, New York, NY; 2019. · DOI
- Cox J, Mann M. MaxQuant enables high peptide identification rates, individualized p.p.b.-range mass accuracies and proteome-wide protein quantification. Nat Biotechnol. 2008;26:1367–72. · DOI · Paper page
- Schmitz SK, Hjorth JJJ, Joemai RMS, Wijntjes R, Eijgenraam S, de Bruijn P, et al. Automated analysis of neuronal morphology, synapse number and synaptic recruitment. J Neurosci Methods. [Internet]. 2011;195:185–93. Available from https://doi.org/10.1016/j.jneumeth.2010.12.011. · DOI
- Nakagawa S, Johnson PCD, Schielzeth H The coefficient of determination R2 and intra-class correlation coefficient from generalized linear mixed-effects models revisited and expanded. J R Soc Interface. 2017;14. · DOI
- Hoffman GE, Schadt EE. variancePartition: Interpreting drivers of variation in complex gene expression studies. BMC Bioinforma [Internet]. 2016;17:17–22. Available from https://doi.org/10.1186/s12859-016-1323-z. · DOI · Paper page
- Dominicus A, Skrondal A, Gjessing HK, Pedersen NL, Palmgren J. Likelihood ratio tests in behavioral genetics: Problems and solutions. Behav Genet. 2006;36:331–40. · DOI
- Wickham H ggplot2: Elegant Graphics for Data Analysis [Internet]. Springer-Verlag New York; 2016 (189–201). Available from: https://ggplot2.tidyverse.org · DOI
- Koopmans F, van Nierop P, Andres-Alonso M, Byrnes A, Cijsouw T, Coba MP, et al. SynGO: an evidence-based, expert-curated knowledge base for the synapse. Neuron. 2019;103:217–34.e4. · DOI · Paper page
- Tang X, Zhou L, Wagner AM, Marchetto MCN, Muotri AR, Gage FH, et al. Astroglial cells regulate the developmental timeline of human neurons differentiated from induced pluripotent stem cells. Stem Cell Res. [Internet]. 2013;11:743–57. https://doi.org/10.1016/j.scr.2013.05.002. · DOI
- Klapper SD, Garg P, Dagar S, Lenk K, Gottmann K, Nieweg K. Astrocyte lineage cells are essential for functional neuronal differentiation and synapse maturation in human iPSC-derived neural networks. Glia 2019;67:1893–909. · DOI
- Burke EE, Chenoweth JG, Shin JH, Collado-Torres L, Kim SK, Micali N, et al. Dissecting transcriptomic signatures of neuronal differentiation and maturation using iPSCs. Nat Commun. [Internet]. 2020;11:1–14. Available from https://doi.org/10.1038/s41467-019-14266-z. · DOI
- Raudenbush SW, Liu X. Statistical power and optimal design for multisite randomized trials. Psychol Methods. 2000;5:199–213. · DOI · Paper page
- Kajiwara M, Aoi T, Okita K, Takahashi R, Inoue H, Takayama N, et al. Donor-dependent variations in hepatic differentiation from human-induced pluripotent stem cells. Proc Natl Acad Sci USA. 2012;109:12538–43. · DOI
- Burrows CK, Banovich NE, Pavlovic BJ, Patterson K, Gallego Romero I, Pritchard JK, et al. Genetic variation, not cell type of origin, underlies the majority of identifiable regulatory differences in iPSCs. PLoS Genet. 2016;12:1–18. · DOI
- Carcamo-Orive I, Hoffman GE, Cundiff P, Beckmann ND, D’Souza SL, Knowles JW, et al. Analysis of transcriptional variability in a large human iPSC library reveals genetic and non-genetic determinants of heterogeneity. Cell Stem Cell. 2017;20:518–32.e9. https://doi.org/10.1016/j.stem.2016.11.005. · DOI
- Bisogno LS, Yang J, Bennett BD, Ward JM, MacKey LC, Annab LA, et al. Ancestry-dependent gene expression correlates with reprogramming to pluripotency and multiple dynamic biological processes. Sci Adv. 2020;6:1–14. · DOI
- Hoffman GE, Schrode N, Flaherty E, Brennand KJ. New considerations for hiPSC-based models of neuropsychiatric disorders. Mol Psychiatry. [Internet]. 2019;24:49–66. https://doi.org/10.1038/s41380-018-0029-1. · DOI
Cited by
Sorted by citations
Penning, A., Snoeck, S., Ormaechea, O. R., Ayyildiz, D., Polzer, O., Buitrago-Arango, M., Capobianco, R., de Winter, F., Balusu, S., Verhaagen, J., et al. (2026) · Acta Neuropathologica Communications · doi:10.1186/s40478-026-02228-8 · Cited by 6
Metadata
- Authors
- Brunner, J. W., Lammertse, H. C. A., van Berkel, A. A., Koopmans, F., Li, K. W., Smit, A. B., Toonen, R. F., Verhage, M., & van der Sluis, S.
- Venue
- Molecular Psychiatry
- Published
- 2022-11-16
- Volume
- 28
- Issue
- 4
- Pages
- 1545-1556
- ISSN
- 1359-4184
- 1476-5578
- PMC
- PMC10208961
- Cited by
- 49
- References
- 10
- Language
- en
About these checks
Registry, retraction, Cites and statistics results are computed, not judged, with one exception: a printed reference that no index lists is read once by a model before it counts as a citation error. Claims are extracted by a model and kept only when their quote appears verbatim in the text; each cited source is then checked, with a model’s help, for whether it says what the claim relies on. Those verdicts can be wrong — read the claim’s quote and the cited source before relying on one.
Statistics and arithmetic are recomputed, not judged.
Confidence bands are shown only for fields calibrated on our annotated test set. None is calibrated yet, so no band is shown.
What counts as a claim ›How we measure confidence ›How we check this ›
Are you an author, or do you see a problem with this page? Request a review
