

The DOI matches its Crossref record; 36 of the 37 references it cites were found in a registry or an index.
Predicting the naturalistic course of depression from a wide range of clinical, psychological, and biological data: a machine learning approach
Open accessAbstract
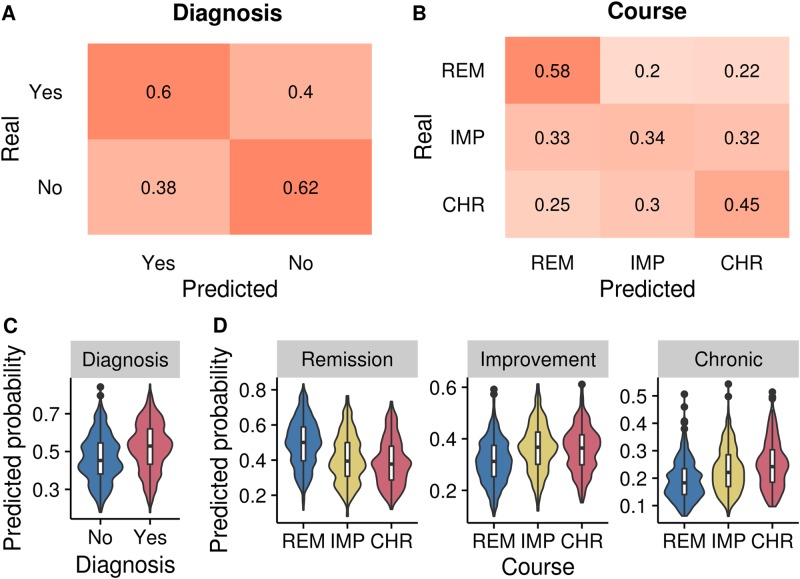
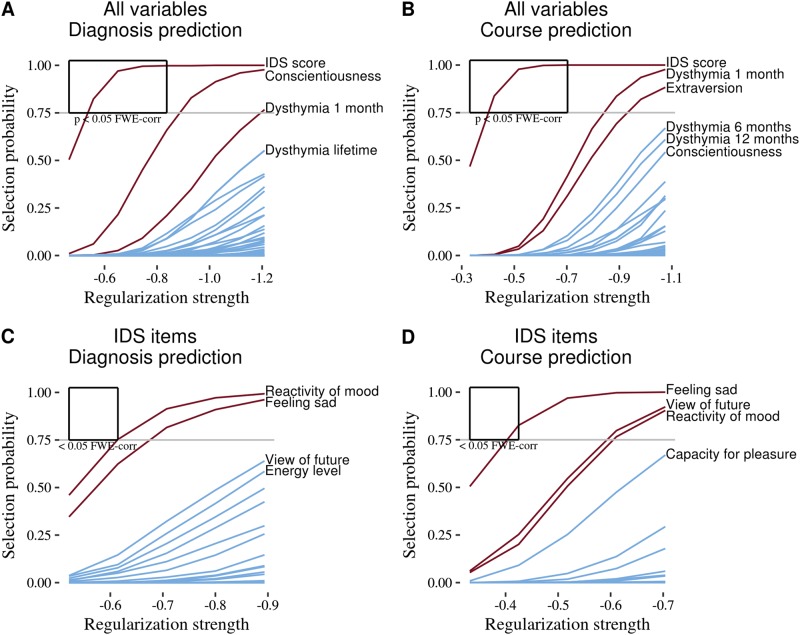
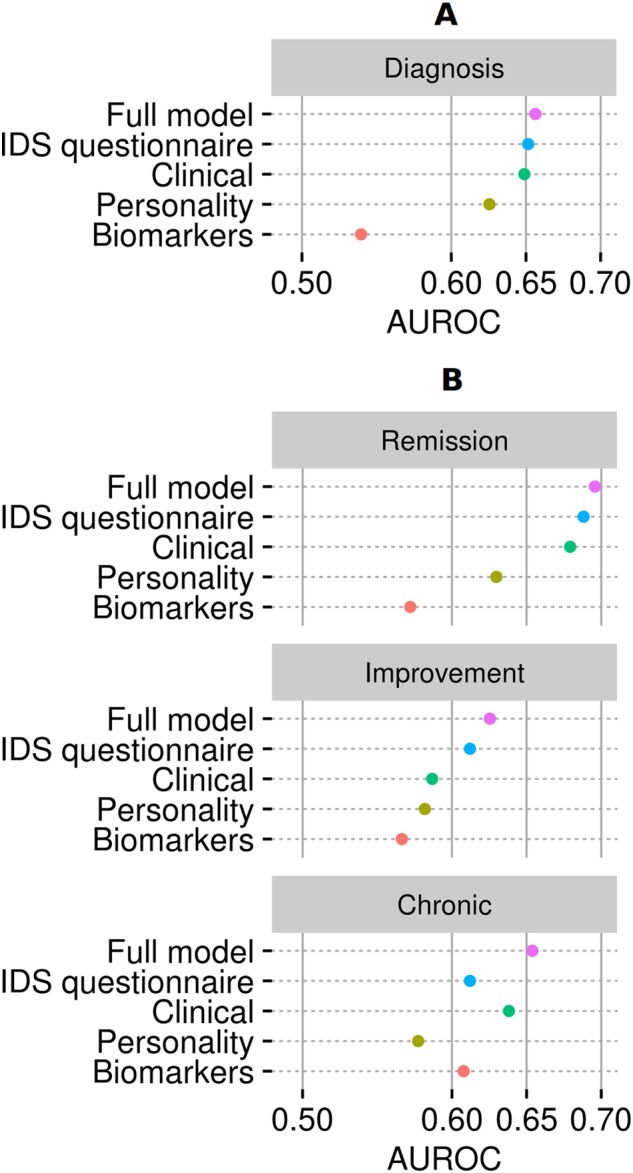
Many variables have been linked to different course trajectories of depression. These findings, however, are based on group comparisons with unknown translational value. This study evaluated the prognostic value of a wide range of clinical, psychological, and biological characteristics for predicting the course of depression and aimed to identify the best set of predictors. Eight hundred four unipolar depressed patients (major depressive disorder or dysthymia) patients were assessed on a set involving 81 demographic, clinical, psychological, and biological measures and were clinically followed-up for 2 years. Subjects were grouped according to (i) the presence of a depression diagnosis at 2-year follow-up (yes n = 397, no n = 407), and (ii) three disease course trajectory groups (rapid remission, n = 356, gradual improvement n = 273, and chronic n = 175) identified by a latent class growth analysis. A penalized logistic regression, followed by tight control over type I error, was used to predict depression course and to evaluate the prognostic value of individual variables. Based on the inventory of depressive symptomatology (IDS), we could predict a rapid remission course of depression with an AUROC of 0.69 and 62% accuracy, and the presence of an MDD diagnosis at follow-up with an AUROC of 0.66 and 66% accuracy. Other clinical, psychological, or biological variables did not significantly improve the prediction. Among the large set of variables considered, only the IDS provided predictive value for course prediction on an individual level, although this analysis represents only one possible methodological approach. However, accuracy of course prediction was moderate at best and further improvement is required for these findings to be clinically useful.
Overview
The claims and statistics of this paper haven’t been checked yet.
Run the check — free, no account needed. It reads the open-access text and checks the sources it cites.
Integrity signals
Registry
Cites
Statistics
Figures
Verification
Claims the paper makes
The claims and statistics of this paper haven’t been checked yet.
Run the check — free, no account needed. It reads the open-access text and checks the sources it cites.
Claims other papers make about this one
Each is checked against this paper’s own text: does it say what the citing paper says it does?
The source backs part of the claim, not all of it — or backs it for a different population, condition or comparison.
In the citing paper
“The model predicted who would develop TRD (defined as chronic depression with no improvement after two years of any or no treatments), found that about half (47%) of the TRD patients were correctly predicted to be so.”
From Irremediability in psychiatric euthanasia: examining the objective standard (2023) · cites this paper as Dinga et al., 2018
Experimental — accuracy not yet measuredThe source backs part of the claim, not all of it — or backs it for a different population, condition or comparison.
In the citing paper
“This is the only prediction model built on naturalistic study data that we found, and the study with the longest prediction endpoint.”
From Irremediability in psychiatric euthanasia: examining the objective standard (2023) · cites this paper as Dinga et al., 2018
Experimental — accuracy not yet measuredThe cited source says what the claim attributes to it.
In the citing paper
“However, it lacks external validation.”
From Irremediability in psychiatric euthanasia: examining the objective standard (2023) · cites this paper as Dinga et al., 2018
The cited source says what the claim attributes to it.
In the citing paper
“only one study involved long-term follow-up of sustained remission (Dinga et al., 2018)”
From Irremediability in psychiatric euthanasia: examining the objective standard (2023) · cites this paper as Dinga et al., 2018
Self-check
Percentages, sums and reported differences re-computed from the paper’s own numbers.
The self-check needs the paper’s full text.
Citations
Cites
The Elements of Statistical Learning
Hastie, T., Tibshirani, R., & Friedman, J. (2009) · Springer Series in Statistics · doi:10.1007/978-0-387-84858-7 · Cited by 25,970
Regularization Paths for Generalized Linear Models via Coordinate Descent
Friedman, J., Hastie, T., & Tibshirani, R. (2010) · Journal of Statistical Software · doi:10.18637/jss.v033.i01 · Cited by 19,927
An inventory for measuring clinical anxiety: Psychometric properties.
Beck, A. T., Epstein, N., Brown, G., & Steer, R. A. (1988) · Journal of Consulting and Clinical Psychology · doi:10.1037/0022-006x.56.6.893 · Cited by 14,407
Murray, C. J. L., Vos, T., Lozano, R., Naghavi, M., Flaxman, A. D., Michaud, C., Ezzati, M., Shibuya, K., Salomon, J. A., Abdalla, S., et al. (2012) · The Lancet · doi:10.1016/s0140-6736(12)61689-4 · Cited by 8,888
Robins, L. N. (1988) · Archives of General Psychiatry · doi:10.1001/archpsyc.1988.01800360017003 · Cited by 2,909
Meinshausen, N., & Bühlmann, P. (2010) · Journal of the Royal Statistical Society Series B (Statistical Methodology) · doi:10.1111/j.1467-9868.2010.00740.x · Cited by 2,463
Domains and Facets: Hierarchical Personality Assessment Using the Revised NEO Personality Inventory
Costa, P. T., & McCrae, R. R. (1995) · Journal of Personality Assessment · doi:10.1207/s15327752jpa6401_2 · Cited by 2,080
Comparing effect sizes in follow-up studies: ROC Area, Cohen's d, and r.
Rice, M. E., & Harris, G. T. (2005) · Law and Human Behavior · doi:10.1007/s10979-005-6832-7 · Cited by 1,608
Kapur, S., Phillips, A. G., & Insel, T. R. (2012) · Molecular Psychiatry · doi:10.1038/mp.2012.105 · Cited by 980
The Netherlands Study of Depression and Anxiety (NESDA): rationale, objectives and methods
Penninx, B. W. J. H., Beekman, A. T. F., Smit, J. H., Zitman, F. G., Nolen, W. A., Spinhoven, P., Cuijpers, P. J., de Jong, P. J., van Marwijk, H., Assendelft, W. J., et al. (2008) · International Journal of Methods in Psychiatric Research · doi:10.1002/mpr.256 · Cited by 930
Self-citation
Cited by
Sorted by citations
Applications of Machine Learning Predictive Models in the Chronic Disease Diagnosis
Battineni, G., Sagaro, G. G., Chintalapudi, N., & Amenta, F. (2020) · Journal of Personalized Medicine · doi:10.3390/jpm10020021 · Cited by 418
de Pablo, G. S., Studerus, E., Vaquerizo‐Serrano, J., Irving, J., Catalán, A., Oliver, D., Baldwin, H., Danese, A., Fazel, S., Steyerberg, E. W., et al. (2020) · Schizophrenia Bulletin · doi:10.1093/schbul/sbaa120 · Cited by 234
Penninx, B. W. J. H., Eikelenboom, M., Giltay, E. J., van Hemert, A. M., Riese, H., Schoevers, R. A., & Beekman, A. T. F. (2021) · Journal of Affective Disorders · doi:10.1016/j.jad.2021.03.026 · Cited by 100
Self-citationTran, B. X., McIntyre, R. S., Latkin, C. A., Phan, H. T., Vu, G. T., Nguyen, H. L. T., Gwee, K. K., Ho, C. S. H., & Ho, R. (2019) · International Journal of Environmental Research and Public Health · doi:10.3390/ijerph16122150 · Cited by 93
A systematic review on AI/ML approaches against COVID-19 outbreak
Dogan, O., Tiwari, S., Jabbar, M. A., & Guggari, S. (2021) · Complex & Intelligent Systems · doi:10.1007/s40747-021-00424-8 · Cited by 87
Metadata
- Authors
- Dinga, R., Marquand, A. F., Veltman, D. J., Beekman, A. T. F., Schoevers, R. A., van Hemert, A. M., Penninx, B. W. J. H., & Schmaal, L.
- Affiliations
- Amsterdam Neuroscience (NL)
- University Medical Center Groningen (NL)
- Leiden University Medical Center (NL)
- The University of Melbourne (AU)
- Corresponding author
- Schmaal, Lianne
- ORCID
- Venue
- Translational Psychiatry
- Published
- 2018-11-05
- Volume
- 8
- Issue
- 1
- Pages
- 241-241
- ISSN
- 2158-3188 (ISSN-L)
- PMC
- PMC6218451
- OpenAlex
- W2900054827
- Cited by
- 125
- References
- 37
- Citations by year
- 2026: 11 · 2025: 16 · 2024: 10 · 2023: 17 · 2022: 25 · 2021: 22 · 2020: 22 · 2019: 2
- FWCI
- 7.42
- Type
- journal article
- Language
- en
- Open access
- gold
- doi.org
- Locations
- Translational Psychiatry (publishedVersion, cc-by)
- Europe PMC (PubMed Central) (publishedVersion, other-oa)
- PubMed Central (publishedVersion, cc-by)
- PubMed (publishedVersion)
- Pure Amsterdam UMC (publishedVersion, cc-by)
- Amsterdam UMC (VU Amsterdam) - Institutional Repository (publishedVersion, other-oa)
- Leiden Repository (Leiden University) (submittedVersion)
- Minerva Access (University of Melbourne) (submittedVersion, cc-by)
- Radboud Repository (Radboud University) (submittedVersion)
- Data Archiving and Networked Services (DANS) (submittedVersion, other-oa)
- DOAJ (DOAJ: Directory of Open Access Journals) (submittedVersion)
- University of Groningen research database (University of Groningen / Centre for Information Technology) (submittedVersion, cc-by)
- Radboud Repository (Radboud University) (submittedVersion, other-oa)
- Funders
- Nederlandse Organisatie voor Wetenschappelijk Onderzoek (016.156.415)
- Topics
- Health Sciences › Medicine › Pharmacology (medical) › Treatment of Major Depression
- Social Sciences › Psychology › Experimental and Cognitive Psychology › Anxiety, Depression, Psychometrics, Treatment, Cognitive Processes
- Social Sciences › Psychology › Experimental and Cognitive Psychology › Mental Health Research Topics
- Keywords
- major depressive disorder, dysthymia, rapid remission, chronic depression, Inventory of Depressive Symptomatology, prognostic factors, latent class growth analysis, penalized logistic regression
- MeSH terms
- Machine Learning, Adult, Major Depressive Disorder, Depressive Disorder, Major, Female, Follow-Up Studies, Humans, Male, Middle Aged, Prognosis, Disease Progression, Dysthymic Disorder
About these checks
Registry, retraction, Cites and statistics results are computed, not judged, with one exception: a printed reference that no index lists is read once by a model before it counts as a citation error. Claims are extracted by a model and kept only when their quote appears verbatim in the text; each cited source is then checked, with a model’s help, for whether it says what the claim relies on. Those verdicts can be wrong — read the claim’s quote and the cited source before relying on one.
Statistics and arithmetic are recomputed, not judged.
Confidence bands are shown only for fields calibrated on our annotated test set. None is calibrated yet, so no band is shown.
What counts as a claim ›How we measure confidence ›How we check this ›
Are you an author, or do you see a problem with this page? Request a review
