Cited by 112Liver Disease Diagnosis and TreatmentLiver physiology and pathologyLiver Diseases and Immunity

The DOI matches its Crossref record; 43 of the 43 references it cites were found in a registry or an index.

The transcription factor c-Jun/AP-1 promotes liver fibrosis during non-alcoholic steatohepatitis by regulating Osteopontin expression

Open access

Abstract

Progression of non-alcoholic fatty liver disease (NAFLD) from steatosis to non-alcoholic steatohepatitis (NASH) is a key step of NASH pathogenesis. The AP-1 transcription factor c-Jun is an important regulator of hepatic stress responses, but its contribution to NASH pathogenesis remains poorly defined. We therefore addressed c-Jun expression in liver biopsies of patients with steatosis and NASH. The role of c-Jun during NASH pathogenesis was analyzed mechanistically in c-Jun mutant mice fed with a methionine- and choline-deficient diet (MCDD). Disease progression from steatosis to NASH in patients correlated with increased c-Jun expression in hepatocytes, while its expression in non-parenchymal liver cells (NPLCs) particularly correlated with fibrosis. Analysis of untreated and MCDD-fed mice lacking c-Jun in hepatocytes ( c-Jun ∆li ) revealed that c-Jun promotes hepatocyte survival, thereby protecting against the regenerative ductular reaction (DR) of Sox9/Osteopontin (Opn) co-expressing NPLCs, expression of the Opn receptor CD44 and fibrosis, which were all exacerbated in c-Jun ∆li mice. Since Opn and c-Jun were co-expressed by NPLCs in mice and patients with NASH, we wondered whether the increased fibrosis observed in c-Jun ∆li mice could be rescued by additional c-Jun deletion in NPLCs ( c-Jun ∆li* ). c-Jun ∆li* mice with NASH indeed exhibited reduced expression of Opn and CD44 in NPLCs, impaired DR and reduced fibrosis. A similar phenotype was observed in Opn knockout mice, suggesting that the observed functions of c-Jun were indeed Opn-dependent. In conclusion, c-Jun expression correlates with disease progression from steatosis to NASH in patients and exerts cell-type-specific functions in mice: In hepatocytes, it promotes cell survival thereby limiting the DR and fibrogenesis. In NPLCs, it rather promotes the DR and fibrogenesis by regulating expression of Opn and CD44.

Overview

The claims and statistics of this paper haven’t been checked yet.

Run the check — free, no account needed. It reads the open-access text and checks the sources it cites.

A few free checks a day · papers already verified open instantly · results are public

Integrity signals

Registry

Crossref · 10.1038/s41418-018-0239-8

Cites

43 of 43 references verified0 citation errors · 0 not checkable

Statistics

Figures

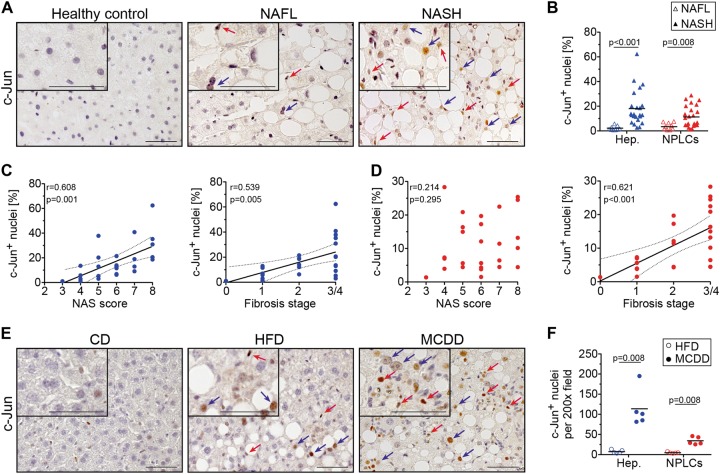
Fig. 1 c-Jun expression correlates with disease progression from NAFL to NASH in humans and mice. a Representative immunohistochemistry for c-Jun of human liver biopsies from healthy controls, patients with NAFL or NASH. b c-Jun expression in hepatocytes and NPLCs of NAFL (n = 9) and NASH patients (n = 27) was quantified. c Hepatocellular c-Jun expression was correlated with the NAS (c, left panel) and fibrosis stage (c, right panel). d c-Jun expression in NPLCs was correlated with the NAS (d, left panel) and fibrosis stage (d, right panel). e Representative immunohistochemistry for c-Jun of livers from mice treated with a CD, HFD or MCDD. f c-Jun expression in hepatocytes and NPLCs of HFD- (n = 4) and MCDD-fed mice (n = 5) was quantified. Significance was tested by Mann–Whitney test and correlation was tested by Pearson correlation coefficient. p values are indicated if significant. Scale bar = 50 µm. Hepatocytes and NPLCs are depicted by blue and red arrows, respectively
Fig. 1 c-Jun expression correlates with disease progression from NAFL to NASH in humans and mice. a Representative immunohistochemistry for c-Jun of human liver biopsies from healthy controls, patients with NAFL or NASH. b c-Jun expression in hepatocytes and NPLCs of NAFL (n = 9) and NASH patients (n = 27) was quantified. c Hepatocellular c-Jun expression was correlated with the NAS (c, left panel) and fibrosis stage (c, right panel). d c-Jun expression in NPLCs was correlated with the NAS (d, left panel) and fibrosis stage (d, right panel). e Representative immunohistochemistry for c-Jun of livers from mice treated with a CD, HFD or MCDD. f c-Jun expression in hepatocytes and NPLCs of HFD- (n = 4) and MCDD-fed mice (n = 5) was quantified. Significance was tested by Mann–Whitney test and correlation was tested by Pearson correlation coefficient. p values are indicated if significant. Scale bar = 50 µm. Hepatocytes and NPLCs are depicted by blue and red arrows, respectivelyCC BY · PubMed Central
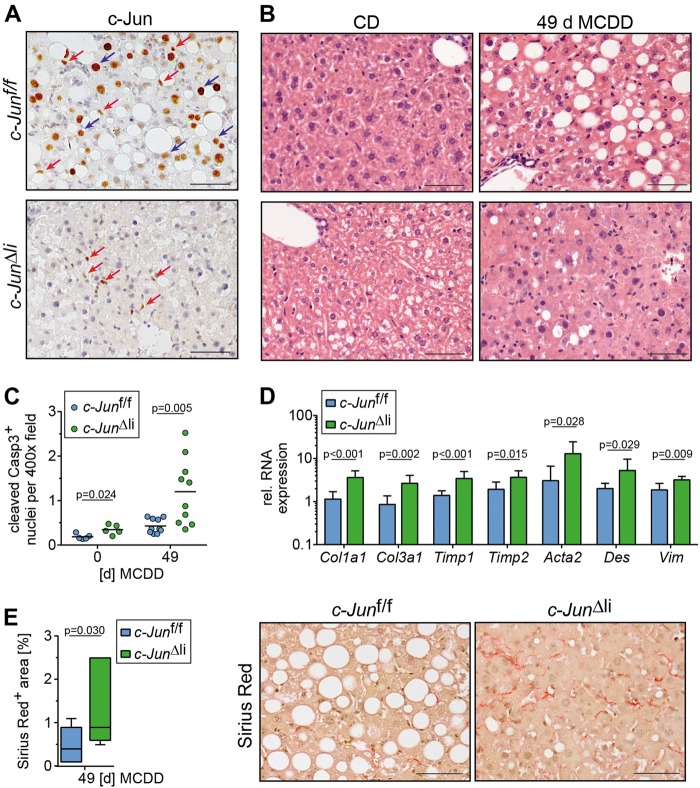
Fig. 2 Increased fibrosis in MCDD-fed c-Jun∆li mice. a, b Representative immunohistochemistry for c-Jun following 49 days of MCDD feeding (a) and hematoxylin and eosin (H&E) stainings following 0 and 49 days of MCDD feeding (b) of livers from mice with the indicated genotypes. Nuclei of hepatocytes and NPLCs are depicted by blue and red arrows, respectively. c Cells with caspase 3 cleavage were assessed by immunofluorescence and quantified (n = 5-10/genotype and timepoint). d Hepatic mRNA expression of the indicated genes following 49 days of MCDD (n = 5-8/genotype). mRNA expression is shown relative to untreated controls. e Quantification and representative Sirius Red stainings following 49 days of MCDD (left, n = 7/genotype). Significance was tested by Mann–Whitney test. P-values are indicated if significant. Scale bar = 50 µm
Fig. 2 Increased fibrosis in MCDD-fed c-Jun∆li mice. a, b Representative immunohistochemistry for c-Jun following 49 days of MCDD feeding (a) and hematoxylin and eosin (H&E) stainings following 0 and 49 days of MCDD feeding (b) of livers from mice with the indicated genotypes. Nuclei of hepatocytes and NPLCs are depicted by blue and red arrows, respectively. c Cells with caspase 3 cleavage were assessed by immunofluorescence and quantified (n = 5-10/genotype and timepoint). d Hepatic mRNA expression of the indicated genes following 49 days of MCDD (n = 5-8/genotype). mRNA expression is shown relative to untreated controls. e Quantification and representative Sirius Red stainings following 49 days of MCDD (left, n = 7/genotype). Significance was tested by Mann–Whitney test. P-values are indicated if significant. Scale bar = 50 µmCC BY · PubMed Central
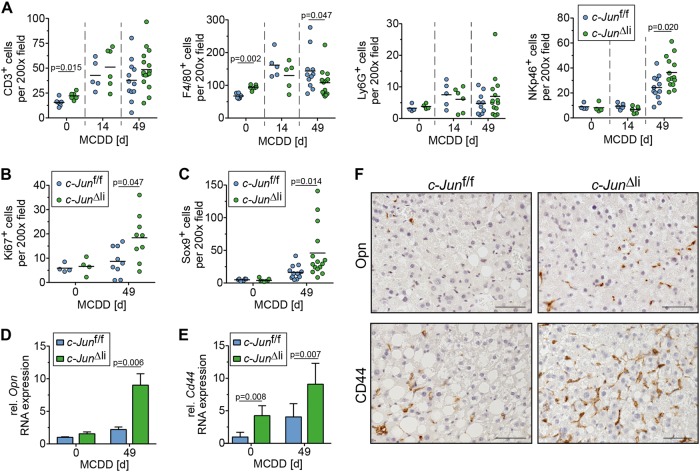
Fig. 3 Increased DR in MCDD-fed c-Jun∆li mice. a The number of CD3-, F4/80-, Ly6G-, and NKp46-positive cells was assessed by immunohistochemistry (n = 4-16/genotype and timepoint). b Quantification of Ki67-positive NPLCs by immunohistochemistry (n = 4–9/genotype and timepoint). c Sox9-positive cells were assessed by immunohistochemistry (n = 5–15/genotype and timepoint). d–f Hepatic expression of Opn and of its receptor CD44 was determined by qPCR (d and e, n = 4–8/genotype and timepoint) and immunohistochemistry (f, representative stainings following 49 days of MCDD). mRNA expression is shown relative to untreated controls. Significance was tested by Mann–Whitney test. P-values are indicated if significant. Scale bar = 50 µm
Fig. 3 Increased DR in MCDD-fed c-Jun∆li mice. a The number of CD3-, F4/80-, Ly6G-, and NKp46-positive cells was assessed by immunohistochemistry (n = 4-16/genotype and timepoint). b Quantification of Ki67-positive NPLCs by immunohistochemistry (n = 4–9/genotype and timepoint). c Sox9-positive cells were assessed by immunohistochemistry (n = 5–15/genotype and timepoint). d–f Hepatic expression of Opn and of its receptor CD44 was determined by qPCR (d and e, n = 4–8/genotype and timepoint) and immunohistochemistry (f, representative stainings following 49 days of MCDD). mRNA expression is shown relative to untreated controls. Significance was tested by Mann–Whitney test. P-values are indicated if significant. Scale bar = 50 µmCC BY · PubMed Central
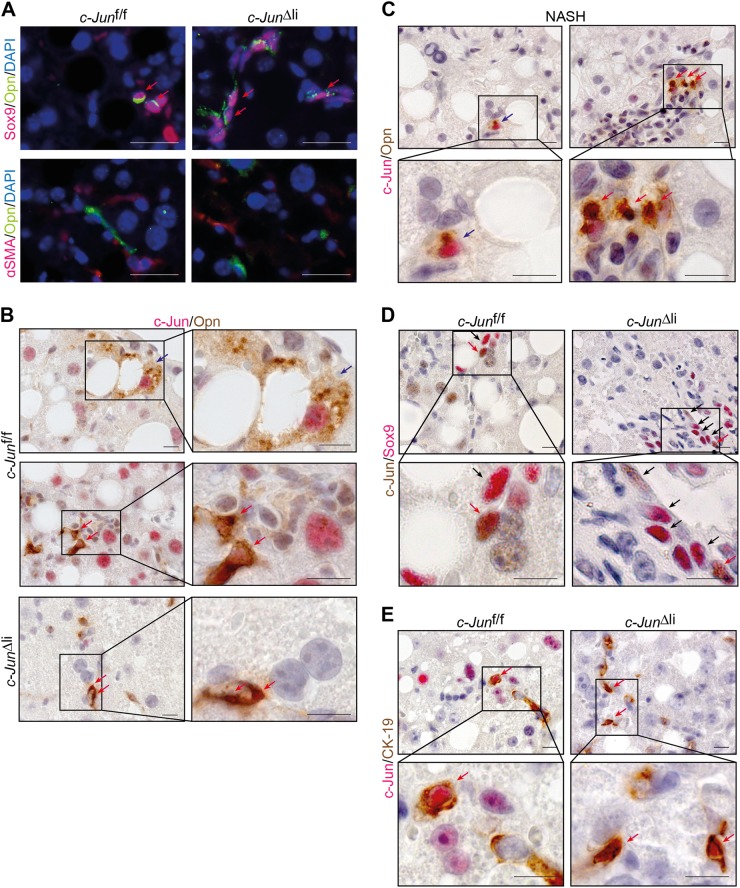
Fig. 4 Co-expression of c-Jun with the HPC markers Sox9, CK-19 and Opn. a Representative double-immunofluorescence stainings for Opn (green) and Sox9 (red) (upper panel) or αSMA (red) (lower panel) of livers from mice with the indicated genotypes following 49 days of MCDD feeding. Double-positive cells are indicated by red arrows. b, c Representative immunohistochemistry of OPN (brown) and c-Jun (red) double-positive cells of mice of the indicated genotypes following 49 days of MCDD feeding (b) or liver sections of patients with NASH (c). d, e Representative immunohistochemistry of c-Jun (d = brown, e = red) and Sox9 (d = red) or CK-19 (e = brown) double-positive cells of mice of the indicated genotypes following 49 days of MCDD feeding. Double-positive hepatocytes and NPLCs are indicated by blue and red arrows, respectively. Single positive cells are indicated by black arrows. Scale bar (immunofluorescence) = 25 µm. Scale bar (immunohistochemistry) = 10 µm
Fig. 4 Co-expression of c-Jun with the HPC markers Sox9, CK-19 and Opn. a Representative double-immunofluorescence stainings for Opn (green) and Sox9 (red) (upper panel) or αSMA (red) (lower panel) of livers from mice with the indicated genotypes following 49 days of MCDD feeding. Double-positive cells are indicated by red arrows. b, c Representative immunohistochemistry of OPN (brown) and c-Jun (red) double-positive cells of mice of the indicated genotypes following 49 days of MCDD feeding (b) or liver sections of patients with NASH (c). d, e Representative immunohistochemistry of c-Jun (d = brown, e = red) and Sox9 (d = red) or CK-19 (e = brown) double-positive cells of mice of the indicated genotypes following 49 days of MCDD feeding. Double-positive hepatocytes and NPLCs are indicated by blue and red arrows, respectively. Single positive cells are indicated by black arrows. Scale bar (immunofluorescence) = 25 µm. Scale bar (immunohistochemistry) = 10 µmCC BY · PubMed Central
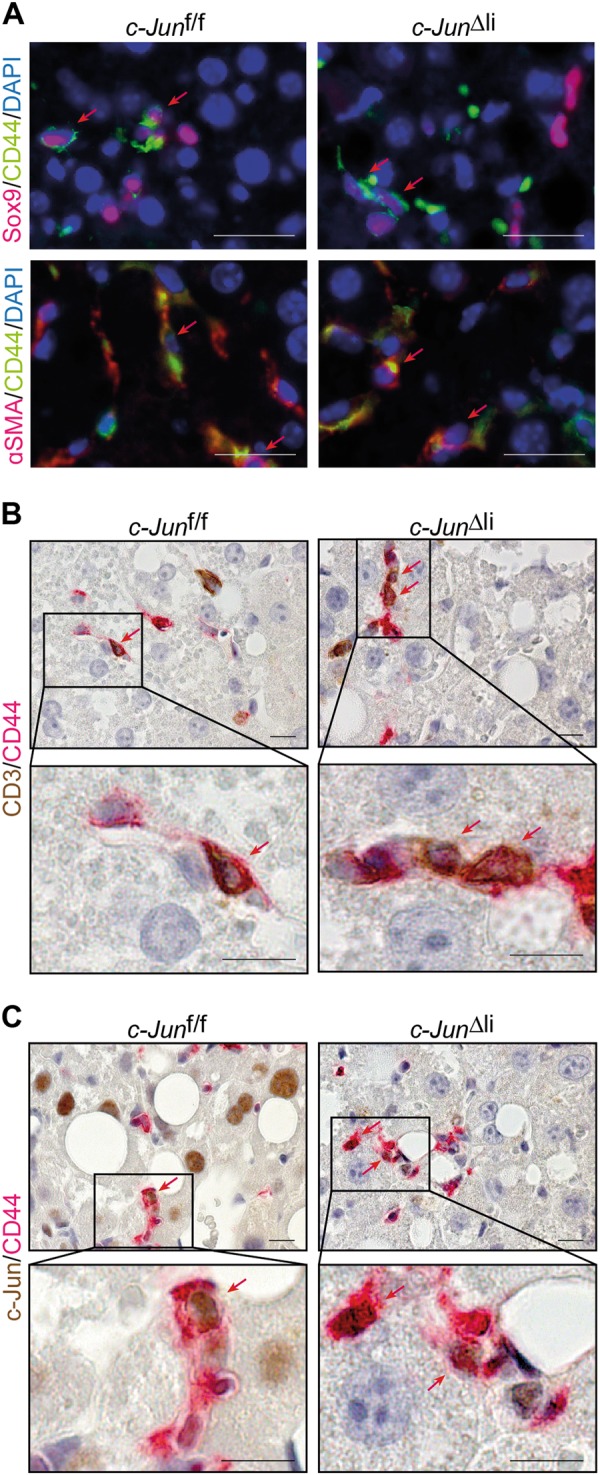
Fig. 5 Expression analysis of CD44-positive NPLCs. a Representative double-immunofluorescence stainings for CD44 (green) and Sox9 (red) (upper panel) or αSMA (red) (lower panel) of livers from mice with the indicated genotypes following 49 days of MCDD feeding. b, c Representative immunohistochemistry of CD44 (red) and CD3 (b = brown) or c-Jun (c = brown) double-positive cells of livers from mice with the indicated genotypes following 49 days of MCDD feeding. Double-positive cells are indicated by red arrows. Scale bar (immunofluorescence) = 25 µm. Scale bar (immunohistochemistry) = 10 µm
Fig. 5 Expression analysis of CD44-positive NPLCs. a Representative double-immunofluorescence stainings for CD44 (green) and Sox9 (red) (upper panel) or αSMA (red) (lower panel) of livers from mice with the indicated genotypes following 49 days of MCDD feeding. b, c Representative immunohistochemistry of CD44 (red) and CD3 (b = brown) or c-Jun (c = brown) double-positive cells of livers from mice with the indicated genotypes following 49 days of MCDD feeding. Double-positive cells are indicated by red arrows. Scale bar (immunofluorescence) = 25 µm. Scale bar (immunohistochemistry) = 10 µmCC BY · PubMed Central
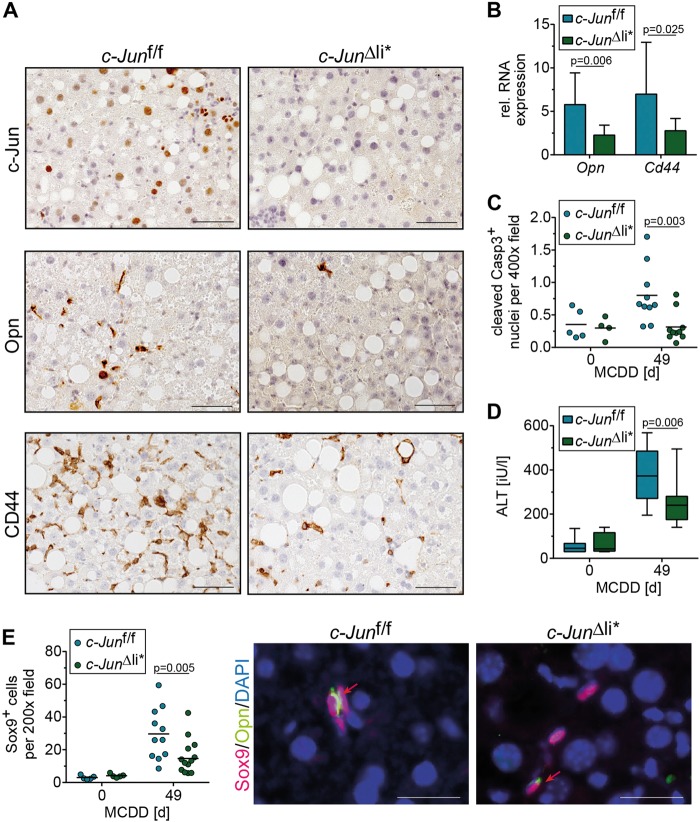
Fig. 6 c-Jun promotes Opn expression in NPLCs and the subsequent DR. a Representative immunohistochemical stainings for c-Jun, OPN and CD44 of liver sections from mice with the indicated genotype following 49 days of MCDD. b Hepatic Opn and Cd44 mRNA expression (n = 5–13/genotype and timepoint). mRNA expression is shown relative to untreated controls. c Caspase 3 cleavage was assessed by immunofluorescence (n = 4-10/genotype and timepoint). d Serum ALT concentrations (n = 4–12/genotype and timepoint). e Quantification of Sox9-positive cells by immunohistochemistry (left, n = 5–13/genotype and timepoint). Representative double-immunofluorescence stainings for Sox9 (red) and Opn (green) of livers from mice with the indicated genotype following 49 days of MCDD feeding are shown (right). Double-positive cells are indicated by red arrows. Significance was tested by Mann–Whitney test. P-values are indicated if significant. Scale bar (immunofluorescence) = 25 µm. Scale bar (immunohistochemistry) = 50 µm
Fig. 6 c-Jun promotes Opn expression in NPLCs and the subsequent DR. a Representative immunohistochemical stainings for c-Jun, OPN and CD44 of liver sections from mice with the indicated genotype following 49 days of MCDD. b Hepatic Opn and Cd44 mRNA expression (n = 5–13/genotype and timepoint). mRNA expression is shown relative to untreated controls. c Caspase 3 cleavage was assessed by immunofluorescence (n = 4-10/genotype and timepoint). d Serum ALT concentrations (n = 4–12/genotype and timepoint). e Quantification of Sox9-positive cells by immunohistochemistry (left, n = 5–13/genotype and timepoint). Representative double-immunofluorescence stainings for Sox9 (red) and Opn (green) of livers from mice with the indicated genotype following 49 days of MCDD feeding are shown (right). Double-positive cells are indicated by red arrows. Significance was tested by Mann–Whitney test. P-values are indicated if significant. Scale bar (immunofluorescence) = 25 µm. Scale bar (immunohistochemistry) = 50 µmCC BY · PubMed Central
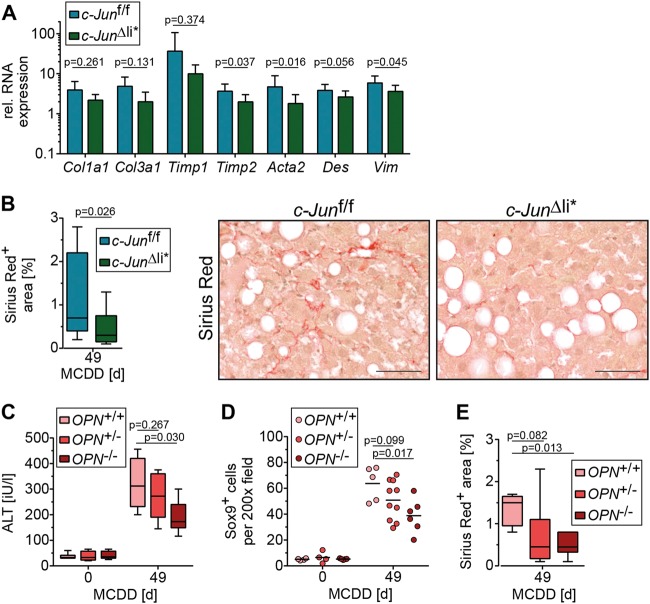
Fig. 7 c-Jun expression in NPLCs promotes fibrosis by regulating Opn expression. a Hepatic mRNA expression of the depicted genes following 49 days of MCDD (n = 5–13/genotype). mRNA expression is shown relative to untreated controls. b Quantification of Sirius red-stained area following 49 days of MCDD (left panel; n = 11–12/genotype) and representative stainings (right panel). c Serum ALT concentrations of mice with the indicated genotypes treated with CD or MCDD (n = 4–8/genotype and timepoint). d Quantification of Sox9-positive cells by immunohistochemistry (n = 4–10/genotype and timepoint). e Quantification of the Sirius red-positive area following 49 days of MCDD (n = 5–6/genotype). Significance was tested by Mann–Whitney test. P-values are indicated. Scale bar = 50 µm
Fig. 7 c-Jun expression in NPLCs promotes fibrosis by regulating Opn expression. a Hepatic mRNA expression of the depicted genes following 49 days of MCDD (n = 5–13/genotype). mRNA expression is shown relative to untreated controls. b Quantification of Sirius red-stained area following 49 days of MCDD (left panel; n = 11–12/genotype) and representative stainings (right panel). c Serum ALT concentrations of mice with the indicated genotypes treated with CD or MCDD (n = 4–8/genotype and timepoint). d Quantification of Sox9-positive cells by immunohistochemistry (n = 4–10/genotype and timepoint). e Quantification of the Sirius red-positive area following 49 days of MCDD (n = 5–6/genotype). Significance was tested by Mann–Whitney test. P-values are indicated. Scale bar = 50 µmCC BY · PubMed Central

Verification

Claims the paper makes

The claims and statistics of this paper haven’t been checked yet.

Run the check — free, no account needed. It reads the open-access text and checks the sources it cites.

A few free checks a day · papers already verified open instantly · results are public

Claims other papers make about this one

Each is checked against this paper’s own text: does it say what the citing paper says it does?

Self-check

Percentages, sums and reported differences re-computed from the paper’s own numbers.

The self-check needs the paper’s full text.

Citations

Cites

1 retracted

Show all 43 references

Cited by

Sorted by citations

See all 112

Metadata

Authors
Schulien, I., Hockenjos, B., Schmitt-Graeff, A., Perdekamp, M. G., Follo, M., Thimme, R., & Hasselblatt, P.
Affiliations
University of Freiburg (DE)
Corresponding author
Hasselblatt, Peter
Venue
Cell Death & Differentiation
Published
2019-02-18
Volume
26
Issue
9
Pages
1688-1699
ISSN
  • 1350-9047 (ISSN-L)
  • 1476-5403
OpenAlex
W2913699817
Cited by
111
References
43
Citations by year
2026: 12 · 2025: 26 · 2024: 16 · 2023: 12 · 2022: 11 · 2021: 24 · 2020: 9 · 2019: 1
FWCI
8.56
Type
journal article
Language
en
Open access
Locations
  • Cell Death and Differentiation (publishedVersion, cc-by)
  • PubMed Central (publishedVersion, cc-by)
  • PubMed (publishedVersion)
Funders
Deutsche Forschungsgemeinschaft (Ha4314/2-3)
Topics
  • Health Sciences › Medicine › Hepatology › Liver Disease Diagnosis and Treatment
  • Health Sciences › Medicine › Hepatology › Liver physiology and pathology
  • Health Sciences › Medicine › Hepatology › Liver Diseases and Immunity
Keywords
c-Jun, AP-1 transcription factor, nonalcoholic steatohepatitis, liver fibrosis, osteopontin, CD44, non-parenchymal liver cells, hepatocyte viability, steatosis, methionine-choline-deficient diet, SOX9
MeSH terms
Animals, Diet, Humans, Liver Cirrhosis, Male, Mice, Inbred C57BL, Regeneration, Proto-Oncogene Proteins c-jun, Mice, Knockout, Disease Progression, Hyaluronan Receptors, Hepatocytes, Cell Proliferation, Mice, Osteopontin, Non-alcoholic Fatty Liver Disease

About these checks

Registry, retraction, Cites and statistics results are computed, not judged, with one exception: a printed reference that no index lists is read once by a model before it counts as a citation error. Claims are extracted by a model and kept only when their quote appears verbatim in the text; each cited source is then checked, with a model’s help, for whether it says what the claim relies on. Those verdicts can be wrong — read the claim’s quote and the cited source before relying on one.

Statistics and arithmetic are recomputed, not judged.

Confidence bands are shown only for fields calibrated on our annotated test set. None is calibrated yet, so no band is shown.

What counts as a claim ›How we measure confidence ›How we check this ›

Are you an author, or do you see a problem with this page? Request a review