

The DOI matches its Crossref record; 50 of the 50 references it cites were found in a registry or an index.
Inhibition of cGAS-STING by JQ1 alleviates oxidative stress-induced retina inflammation and degeneration
Open accessAbstract
Atrophic (“dry”) form of age-related macular degeneration (AMD) is a leading cause of vision loss characterized by macular retinal pigment epithelium (RPE) and the ensuing photoreceptor degeneration. cGAS-STING signaling is a key cytosolic DNA sensor system in innate immunity and have recently been shown promotes RPE degeneration. However, expression regulation and therapeutic potential of cGAS and STING are not explored in retina under dry AMD pathogenic conditions. Our analysis shows upregulated STING RNA and increased chromatin accessibility around cGAS and STING promoters in macular retinas from dry AMD patients. cGAS-STING activation was detected in oxidative stress-induced mouse retina degeneration, accompanied with cytosolic leakage of damaged DNA in photoreceptors. Pharmaceutical or genetic approaches indicates STING promotes retina inflammation and degeneration upon oxidative damage. Drug screening reveals that BRD4 inhibitor JQ1 reduces cGAS-STING activation, inflammation and photoreceptor degeneration in the injured retina. BRD4 inhibition epigenetically suppresses STING transcription, and promotes autophagy-dependent cytosolic DNA clearance. Together, our results show that activation of cGAS-STING in retina may present pivotal innate immunity response in GA pathogenesis, whereas inhibition of cGAS-STING signaling by JQ1 could serve as a potential therapeutic strategy.
Overview
The claims and statistics of this paper haven’t been checked yet.
Run the check — free, no account needed. It reads the open-access text and checks the sources it cites.
Integrity signals
Registry
Cites
Statistics
Figures
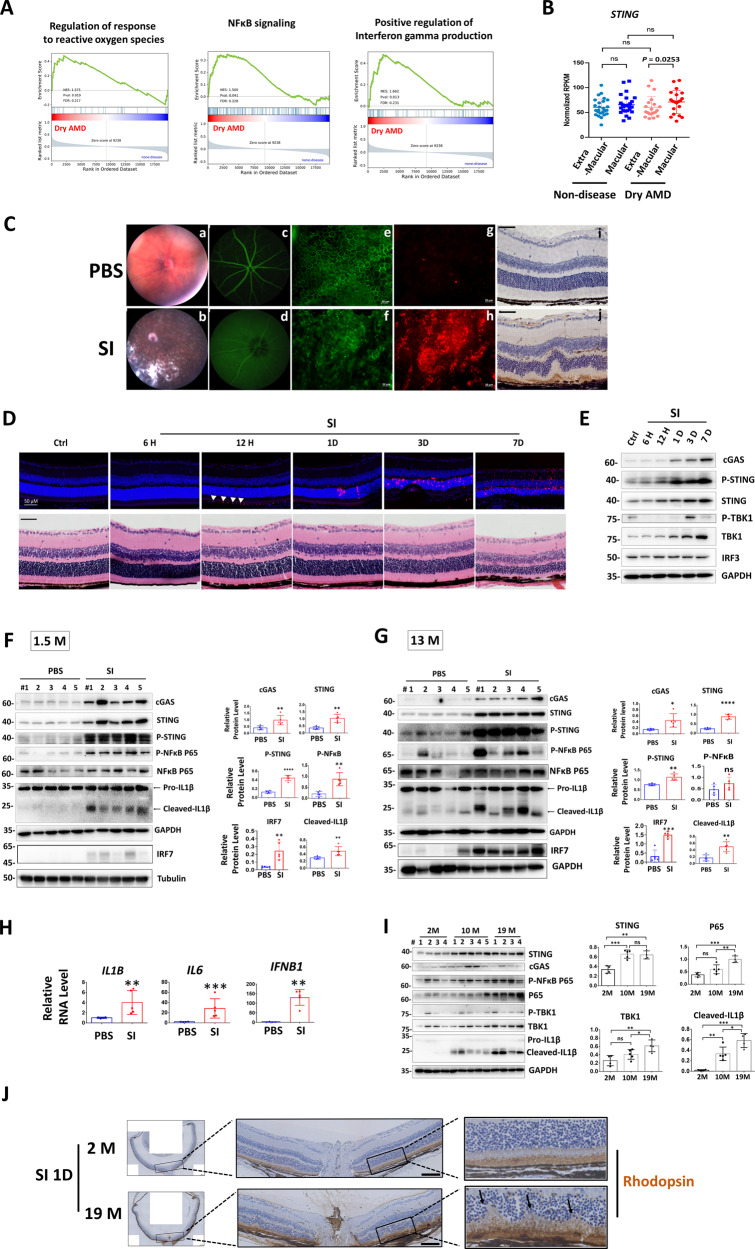
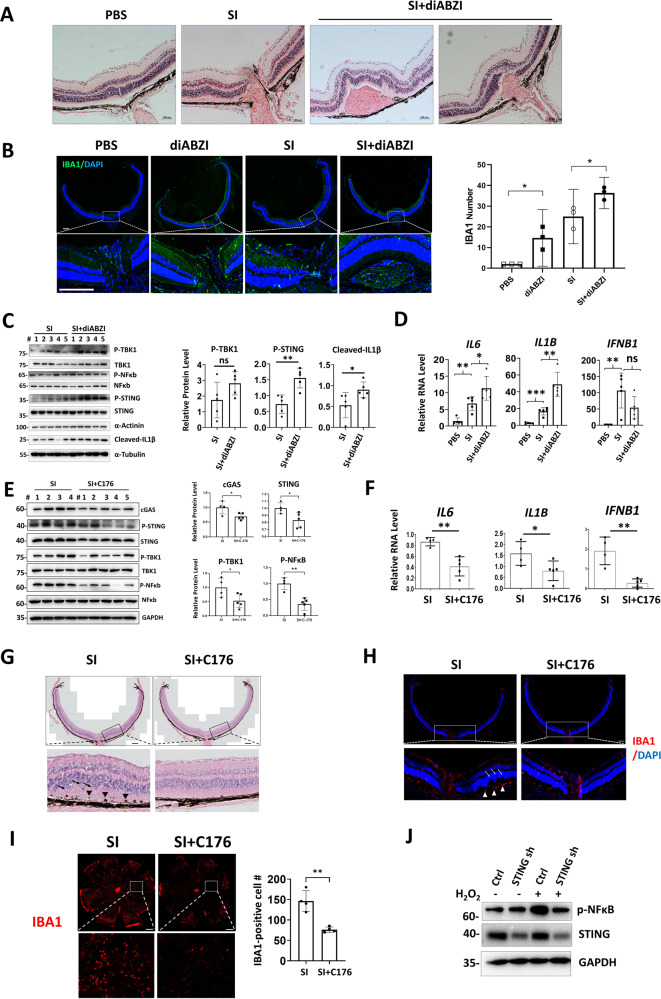
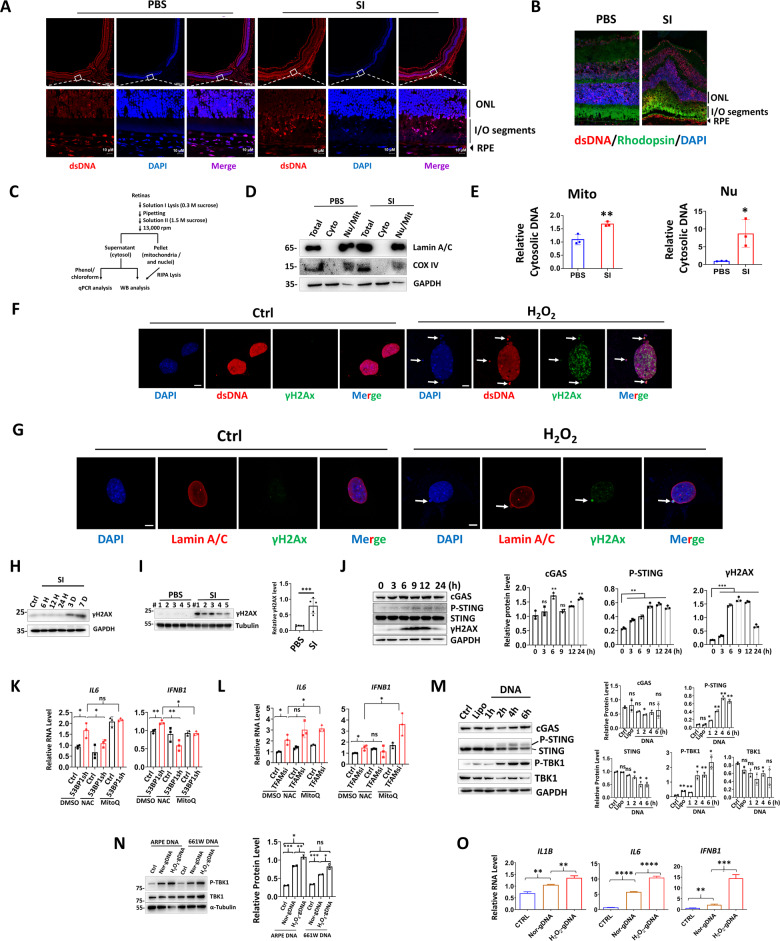
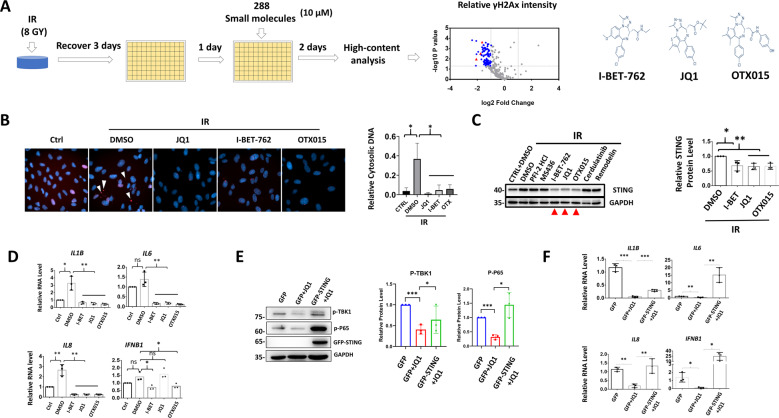
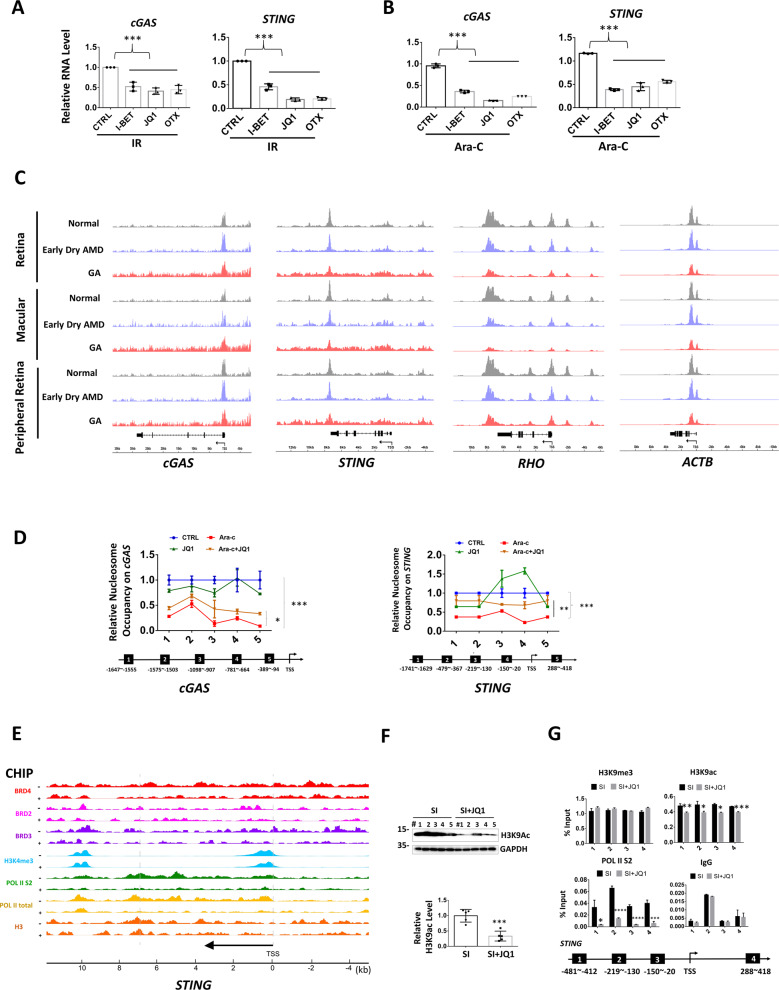
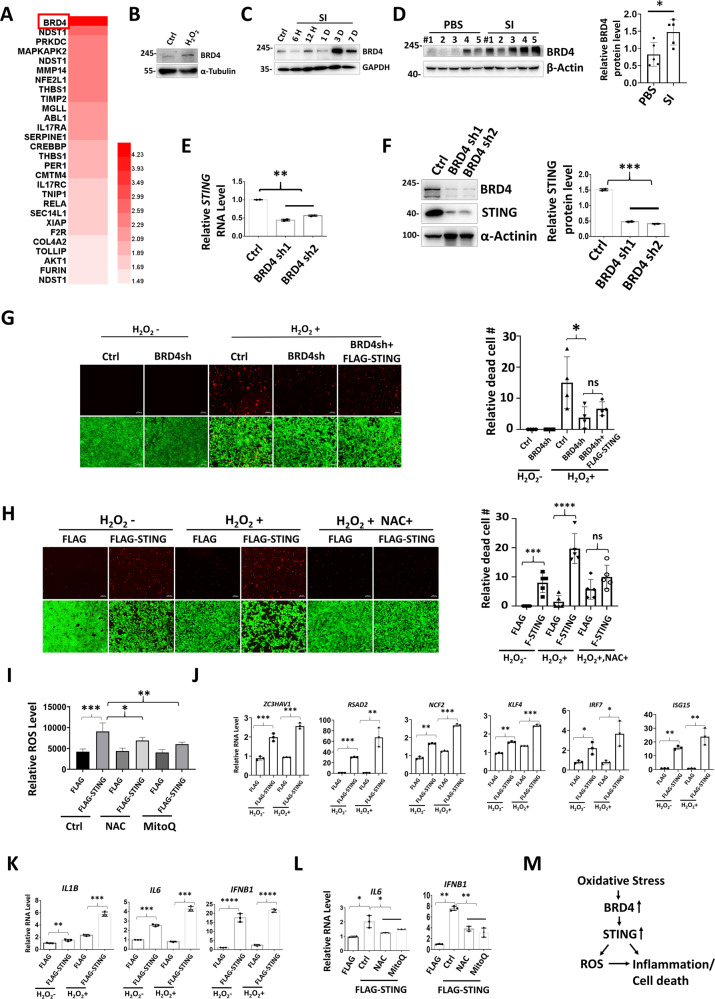
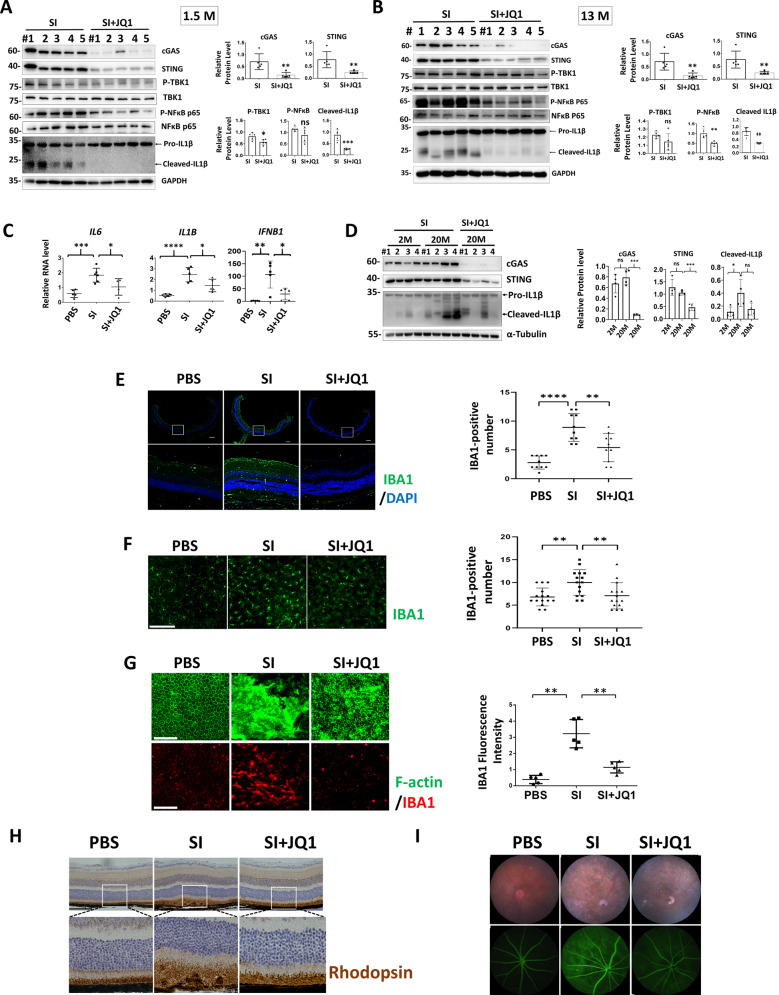
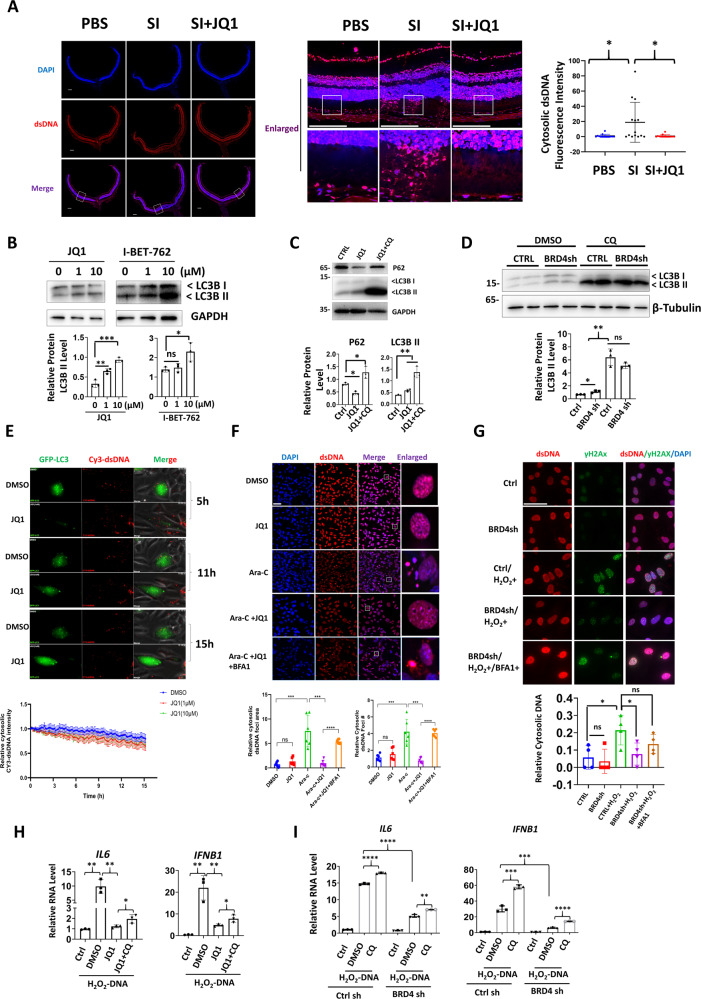
Verification
Claims the paper makes
The claims and statistics of this paper haven’t been checked yet.
Run the check — free, no account needed. It reads the open-access text and checks the sources it cites.
Claims other papers make about this one
Each is checked against this paper’s own text: does it say what the citing paper says it does?
In the citing paper
“The study demonstrated that cGAS-STING would be activated when cytosolic DNA is found in the retina, resulting in DNA clearance and local inflammation, which is likely to be a barrier for naked DNA delivery [71].”
From Immune responses to gene editing by viral and non-viral delivery vectors used in retinal gene therapy (2022) · cites this paper as [71]
In the citing paper
“DNA leakage was found in the retina after OS, which promoted the expression of cGAS and STING, which further promoted retinal inflammation, as an infiltration of microglial cells were observed.”
From Immune responses to gene editing by viral and non-viral delivery vectors used in retinal gene therapy (2022) · cites this paper as [71]
Self-check
Percentages, sums and reported differences re-computed from the paper’s own numbers.
The self-check needs the paper’s full text.
Citations
Cites
The Sequence Alignment/Map format and SAMtools
Li, H., Handsaker, B., Wysoker, A., Fennell, T., Ruan, J., Homer, N., Marth, G., Abecasis, G., Durbin, R., & 1000 Genome Project Data Processing Subgroup (2009) · Bioinformatics · doi:10.1093/bioinformatics/btp352 · Cited by 62,041
deepTools2: a next generation web server for deep-sequencing data analysis
Ramírez, F., Ryan, D. P., Grüning, B., Bhardwaj, V., Kilpert, F., Richter, A. S., Heyne, S., Dündar, F., & Manke, T. (2016) · Nucleic Acids Research · doi:10.1093/nar/gkw257 · Cited by 8,096
Cillà, S. D., Farruggio, S., Vujosevic, S., Raina, G., Filippini, D. A., Gatti, V., Clemente, N., Mary, D., Vezzola, D., Casini, G., et al. (2017) · Cellular Physiology and Biochemistry · doi:10.1159/000479441 · Cited by 5,154
Cyclic GMP-AMP Synthase Is a Cytosolic DNA Sensor That Activates the Type I Interferon Pathway
Sun, L., Wu, J., Du, F., Chen, X., & Chen, Z. J. (2013) · Science · doi:10.1126/science.1232458 · Cited by 4,996
STING is an endoplasmic reticulum adaptor that facilitates innate immune signalling
Ishikawa, H., & Barber, G. N. (2008) · Nature · doi:10.1038/nature07317 · Cited by 3,576
Cyclic GMP-AMP Is an Endogenous Second Messenger in Innate Immune Signaling by Cytosolic DNA
Wu, J., Sun, L., Chen, X., Du, F., Shi, H., Chen, C., & Chen, Z. J. (2012) · Science · doi:10.1126/science.1229963 · Cited by 2,628
Sambamba: fast processing of NGS alignment formats
Tarasov, A., Vilella, A. J., Cuppen, E. P. J. G., Nijman, I. J., & Prins, P. (2015) · Bioinformatics · doi:10.1093/bioinformatics/btv098 · Cited by 2,426
Regulation and function of the cGAS–STING pathway of cytosolic DNA sensing
Chen, Q., Sun, L., & Chen, Z. J. (2016) · Nature Immunology · doi:10.1038/ni.3558 · Cited by 2,333
The Role of Oxidative Stress in the Pathogenesis of Age-Related Macular Degeneration
Beatty, S., Koh, H.-H., Phil, M., Henson, D., & Boulton, M. (2000) · Survey of Ophthalmology · doi:10.1016/s0039-6257(00)00140-5 · Cited by 2,051
Suppression of inflammation by a synthetic histone mimic
Nicodeme, E., Jeffrey, K. L., Schaefer, U., Beinke, S., Dewell, S., Chung, C.-W., Chandwani, R., Marazzi, I., Wilson, P., Coste, H., et al. (2010) · Nature · doi:10.1038/nature09589 · Cited by 1,563
Cited by
Sorted by citations
Items 101–142 of 142
Dong, M., Xiao, Q., Liu, C., Fan, B., & Han, R. (2024) · Annali Italiani di Chirurgia · doi:10.62713/aic.3279 · Cited by 1
Tang, X., Liu, W., Liang, J., Zhu, X., Ge, X., Fang, D., Ling, L., Yuan, F., Zeng, K., Chen, Q., et al. (2024) · Inflammation · doi:10.1007/s10753-024-02152-w · Cited by 1
Self-citationWang, L., Wen, Y., Zhang, D., Yu, X., Zhang, L., Zhu, H., Tong, J., & Shen, Y. (2022) · SSRN Electronic Journal · doi:10.2139/ssrn.4170601
Dou, Y. (2022) · Research Square · doi:10.21203/rs.3.rs-2043096/v1
(2022) · Research Square · doi:10.21203/rs.3.rs-2043096/v2
PCR Array of Specific RNA Methylation-Associated Genes Involved in Oxidative Stress of RPE CellsPreprint
Chen, Y., & Mao, K. (2023) · SSRN Electronic Journal · doi:10.2139/ssrn.4602480
Bromodomain Proteins as New Drug Target for an Inborn Lysosomal DefectPreprint
Parente, M., Barthelemy, A., Tonini, C., Caputo, S., Sacchi, A., Leone, S., Segatto, M., Pfrieger, F. W., & Pallottini, V. (2023) · bioRxiv (Cold Spring Harbor Laboratory) · doi:10.1101/2023.12.19.572384
Qiu, W., Zheng, Z., Wang, J., Cai, Y., Zou, J., Yang, P., Ye, W., Jin, M., Huang, Z., Zhang, D., et al. (2024) · Research Square · doi:10.21203/rs.3.rs-5172358/v1
PPARα deficiency exacerbates retinal pathological changes and dysfunction in high-fat diet mice
Wang, X., Yu, C.-F., Xiao, D.-C., Tao, L.-M., & Jiang, Z. (2025) · International Journal of Ophthalmology · doi:10.18240/ijo.2025.06.03
Wang, H., Zhu, Y., Song, X., Pu, H., Song, J., Jiang, H., Yu, X., & Xu, Y. (2026) · Journal of Photochemistry and Photobiology B Biology · doi:10.1016/j.jphotobiol.2026.113524
Su, Z., Wang, J., Lai, Q., Wang, Z., Liu, P., Tang, Z., Yu, H., Chen, Y., Ma, X., & Hou, L. (2025) · bioRxiv (Cold Spring Harbor Laboratory) · doi:10.1101/2025.07.26.666839 · Cited by 1
Pavlovschi, E., Untila, A., Protopop, S., Ambros, A., & Tagadiuc, O. (2025) · Moldovan Journal of Health Sciences · doi:10.52645/mjhs.2025.3.07
The Role of Inflammation and Immune Responses in Age-Related Macular Degeneration
叶, 振. (2025) · Advances in Clinical Medicine · doi:10.12677/acm.2025.15113192
Zhu, X., Liu, W., Tang, X., Chen, Y., Ge, X., Ke, Q., Liang, X., Gan, Y., Zheng, Y., Zou, M., et al. (2024) · Figshare · doi:10.6084/m9.figshare.26590784
Self-citationZhu, X., Liu, W., Tang, X., Chen, Y., Ge, X., Ke, Q., Liang, X., Gan, Y., Zheng, Y., Zou, M., et al. (2024) · Figshare · doi:10.6084/m9.figshare.26590763
Self-citationNi, B., Yang, Z., Zhou, T., Zhou, H., Zhou, Y., Lin, S., Xu, H., Lin, X., Yi, W., He, C., et al. (2024) · Figshare · doi:10.6084/m9.figshare.26738847
Zhu, X., Liu, W., Tang, X., Chen, Y., Ge, X., Ke, Q., Liang, X., Gan, Y., Zheng, Y., Zou, M., et al. (2024) · Figshare · doi:10.6084/m9.figshare.26590769
Self-citationZhu, X., Liu, W., Tang, X., Chen, Y., Ge, X., Ke, Q., Liang, X., Gan, Y., Zheng, Y., Zou, M., et al. (2024) · Figshare · doi:10.6084/m9.figshare.26590790
Self-citationZhu, X., Liu, W., Tang, X., Chen, Y., Ge, X., Ke, Q., Liang, X., Gan, Y., Zheng, Y., Zou, M., et al. (2024) · Figshare · doi:10.6084/m9.figshare.26590772
Self-citationZhai, P., Chen, Q., Wang, X., Ouyang, X., Yang, M., Dong, Y., Li, J., Li, Y., Luo, S., Liu, Y., et al. (2024) · Figshare · doi:10.6084/m9.figshare.26686500
Self-citationZhu, X., Liu, W., Tang, X., Chen, Y., Ge, X., Ke, Q., Liang, X., Gan, Y., Zheng, Y., Zou, M., et al. (2024) · Figshare · doi:10.6084/m9.figshare.26590778
Self-citationZhu, X., Liu, W., Tang, X., Chen, Y., Ge, X., Ke, Q., Liang, X., Gan, Y., Zheng, Y., Zou, M., et al. (2024) · Figshare · doi:10.6084/m9.figshare.26590781
Self-citationNi, B., Yang, Z., Zhou, T., Zhou, H., Zhou, Y., Lin, S., Xu, H., Lin, X., Yi, W., He, C., et al. (2024) · Figshare · doi:10.6084/m9.figshare.26103972
Zhu, X., Liu, W., Tang, X., Chen, Y., Ge, X., Ke, Q., Liang, X., Gan, Y., Zheng, Y., Zou, M., et al. (2024) · Figshare · doi:10.6084/m9.figshare.26590766
Self-citationZhu, X., Liu, W., Tang, X., Chen, Y., Ge, X., Ke, Q., Liang, X., Gan, Y., Zheng, Y., Zou, M., et al. (2024) · Figshare · doi:10.6084/m9.figshare.26590787
Self-citationZhu, X., Liu, W., Tang, X., Chen, Y., Ge, X., Ke, Q., Liang, X., Gan, Y., Zheng, Y., Zou, M., et al. (2024) · Figshare · doi:10.6084/m9.figshare.26590775
Self-citationNi, B., Yang, Z., Zhou, T., Zhou, H., Zhou, Y., Lin, S., Xu, H., Lin, X., Yi, W., He, C., et al. (2024) · Figshare · doi:10.6084/m9.figshare.26103752
Zhai, P., Chen, Q., Wang, X., Ouyang, X., Yang, M., Dong, Y., Li, J., Li, Y., Luo, S., Liu, Y., et al. (2024) · Figshare · doi:10.6084/m9.figshare.26686503
Self-citationHe, X., Zeng, R., Wen, S., Wen, Z., Li, H., Ai, H., Gao, R., Fan, L., Zhou, L., Shi, G., et al. (2026) · Molecular Therapy — Nucleic Acids · doi:10.1016/j.omtn.2026.102847
Qiu, X., Fu, X.-W., Lei, X., Huang, W.-J., Tao, M.-L., Zheng, G.-L., Wei, Y.-Z., Chen, F., Luo, H.-Y., Xu, J.-W., et al. (2026) · Scientific Reports · doi:10.1038/s41598-026-38193-4
Li, X., Fan, N., Yan, Y., Ren, M., Wu, H., & Dong, K. (2026) · Journal of Neuroinflammation · doi:10.1186/s12974-026-03762-x
Jia, Z., Luan, F., Shi, J., Tao, Y., & Tian, Y. (2026) · Extracellular Vesicles and Circulating Nucleic Acids · doi:10.20517/evcna.2025.159
Mohamed, A. A., Eraky, S. M., Abdo, W., & Abdel‐Rahman, N. (2026) · International Immunopharmacology · doi:10.1016/j.intimp.2026.116649
Chen, Y., Li, F., He, Y., & Ling, Z. (2026) · Frontiers in Pharmacology · doi:10.3389/fphar.2026.1794994
Bai, J., Ren, H., Zhang, Y., & Li, X. (2026) · Frontiers in Medicine · doi:10.3389/fmed.2026.1789222
Inhibition of Pax6 sumoylation suppresses the tumorigenicity of pancreatic cancer cells
Xiao, Y., Wang, J., Shan, Y.-Y., Fu, J., Deng, M., Wang, Y., Zhang, J.-P., Zheng, S.-Y., Zou, M., Gan, Y., et al. (2026) · Cell Death and Differentiation · doi:10.1038/s41418-026-01789-4
Self-citationEffects of bromodomain protein inhibition in a mouse model of Niemann-Pick type C diseasePreprint
Parente, M., Barthelemy, A., Caputo, S., Charlery-Adele, N., Galmiche, C., Tonini, C., Lobasso, S., Prtvar, D., Tahirović, S., Reibel, S., et al. (2026) · bioRxiv (Cold Spring Harbor Laboratory) · doi:10.64898/2026.06.24.734200
Qu, H., Zhou, P., Yu, J., Deng, K., Zhou, Y., Wang, N., Chen, Y., & Xia, J. (2026) · IntechOpen eBooks · doi:10.5772/intechopen.1016269
Peng, Y., Jin, F., Bochen, Y., Fan, N., Deng, C., Ye, Z., & Dong, K. (2026) · American Journal Of Pathology · doi:10.1016/j.ajpath.2026.07.004
Grimaldi, R., Franco, F., & Vingolo, E. M. (2026) · Antioxidants · doi:10.3390/antiox15091110
Liao, Y., Zhu, C., Zhang, W., Cheng, L.-D., Liu, Y., Wang, Y., Zhou, T., Zhao, J.-X., Bian, J., Zou, Z., et al. (2026) · Pharmacological Research · doi:10.1016/j.phrs.2026.108454
Self-citationWen, Z., Yang, F., Zhao, Y., Sun, F., Wang, R., Zhang, H., Wang, Y., Song, L., Cao, J., & Li, B. (2026) · Chemical Engineering Journal · doi:10.1016/j.cej.2026.183407
Metadata
- Authors
- Zou, M., Ke, Q., Nie, Q., Qi, R., Zhu, X., Liu, W., Hu, X., Sun, Q., Fu, J.-L., Tang, X., Liu, Y., Li, D. W.-C., & Gong, L.
- Affiliations
- Sun Yat-sen University (CN)
- Corresponding author
- Li, David Wan-Cheng
- Gong, Lili
- ORCID
- Venue
- Cell Death & Differentiation
- Published
- 2022-03-28
- Volume
- 29
- Issue
- 9
- Pages
- 1816-1833
- ISSN
- 1350-9047 (ISSN-L)
- 1476-5403
- PMC
- PMC9433402
- OpenAlex
- W4220995455
- Cited by
- 138
- References
- 50
- Citations by year
- 2026: 28 · 2025: 37 · 2024: 45 · 2023: 20 · 2022: 8
- FWCI
- 9.30
- Type
- journal article
- Language
- en
- Open access
- hybrid
- doi.org
- Locations
- Cell Death and Differentiation (publishedVersion, cc-by)
- PubMed Central (publishedVersion, cc-by)
- PubMed (publishedVersion)
- Funders
- National Natural Science Foundation of China (81770910, 81970787, 82070969, 82000876, 81970784, 81970910)
- Natural Science Foundation of Guangdong Province (2019B1515120014)
- Sun Yat-sen University (3030901009090)
- Topics
- Health Sciences › Medicine › Ophthalmology › Retinal Development and Disorders
- Health Sciences › Medicine › Ophthalmology › Retinal Diseases and Treatments
- Life Sciences › Immunology and Microbiology › Immunology › interferon and immune responses
- Keywords
- cGAS-STING pathway, JQ1, BRD4 inhibition, dry age-related macular degeneration, retinal pigment epithelium degeneration, photoreceptor degeneration, oxidative stress, cytosolic DNA sensing, chromatin accessibility, autophagy, innate immunity
- MeSH terms
- STING Protein, Cyclic Guanosine Monophosphate-Adenosine Monophosphate Synthase, Animals, Inflammation, Membrane Proteins, Nuclear Proteins, Nucleotidyltransferases, Retina, Transcription Factors, Oxidative Stress, Mice, Retinal Pigment Epithelium
About these checks
Registry, retraction, Cites and statistics results are computed, not judged, with one exception: a printed reference that no index lists is read once by a model before it counts as a citation error. Claims are extracted by a model and kept only when their quote appears verbatim in the text; each cited source is then checked, with a model’s help, for whether it says what the claim relies on. Those verdicts can be wrong — read the claim’s quote and the cited source before relying on one.
Statistics and arithmetic are recomputed, not judged.
Confidence bands are shown only for fields calibrated on our annotated test set. None is calibrated yet, so no band is shown.
What counts as a claim ›How we measure confidence ›How we check this ›
Are you an author, or do you see a problem with this page? Request a review
