

The DOI matches its Crossref record; 53 of the 53 references it cites were found in a registry or an index; none of the 27 sources its claims cite is checked for support yet.
AMPK-dependent autophagy upregulation serves as a survival mechanism in response to Tumor Treating Fields (TTFields)
Open accessAbstract
Tumor Treating Fields (TTFields), an approved treatment modality for glioblastoma, are delivered via non-invasive application of low-intensity, intermediate-frequency, alternating electric fields. TTFields application leads to abnormal mitosis, aneuploidy, and increased cell granularity, which are often associated with enhancement of autophagy. In this work, we evaluated whether TTFields effected the regulation of autophagy in glioma cells. We found that autophagy is upregulated in glioma cells treated with TTFields as demonstrated by immunoblot analysis of the lipidated microtubule-associated protein light chain 3 (LC3-II). Fluorescence and transmission electron microscopy demonstrated the presence of LC3 puncta and typical autophagosome-like structures in TTFields-treated cells. Utilizing time-lapse microscopy, we found that the significant increase in the formation of LC3 puncta was specific to cells that divided during TTFields application. Evaluation of selected cell stress parameters revealed an increase in the expression of the endoplasmic reticulum (ER) stress marker GRP78 and decreased intracellular ATP levels, both of which are indicative of increased proteotoxic stress. Pathway analysis demonstrated that TTFields-induced upregulation of autophagy is dependent on AMP-activated protein kinase (AMPK) activation. Depletion of AMPK or autophagy-related protein 7 (ATG7) inhibited the upregulation of autophagy in response to TTFields, as well as sensitized cells to the treatment, suggesting that cancer cells utilize autophagy as a resistance mechanism to TTFields. Combining TTFields with the autophagy inhibitor chloroquine (CQ) resulted in a significant dose-dependent reduction in cell growth compared with either TTFields or CQ alone. These results suggest that dividing cells upregulate autophagy in response to aneuploidy and ER stress induced by TTFields, and that AMPK serves as a key regulator of this process.
Overview
AI snapshot
Written from the paper’s full text.
TL;DR
TTFields upregulate autophagy in glioma cells, especially in daughter cells that divide during treatment, via AMPK activation downstream of aneuploidy/ER stress and low ATP. This autophagy acts as a survival/resistance mechanism, and inhibiting it genetically or with chloroquine sensitizes glioma cells to TTFields.
Key findings
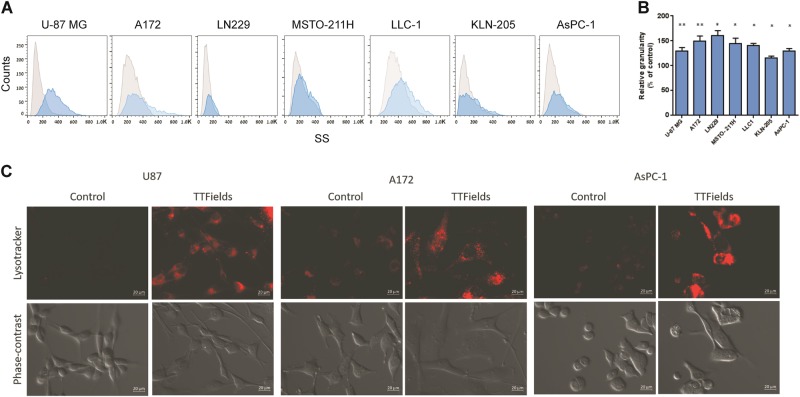
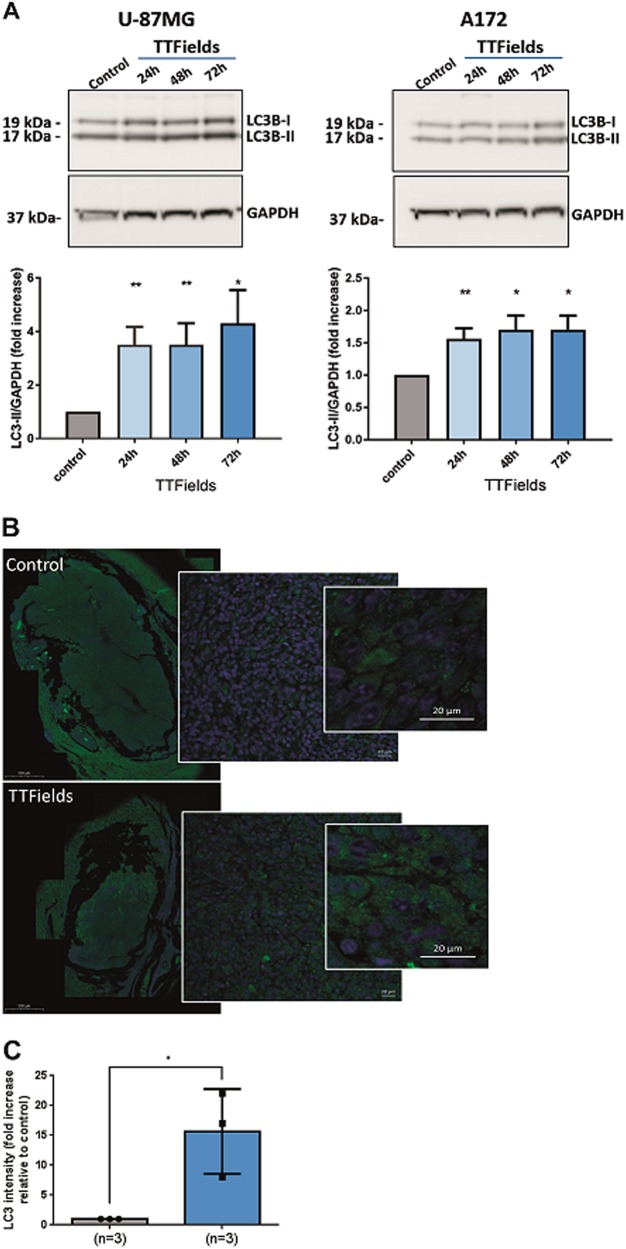
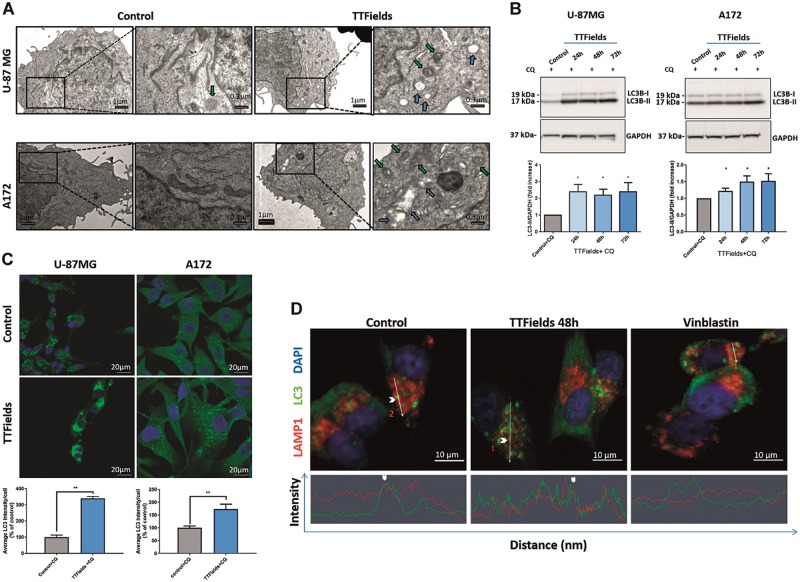
- TTFields increased cellular granularity across mesothelioma, glioma, lung, and pancreatic cancer cell lines and enlarged the acidic lysosomal pool; in U-87 MG and A172 glioma cells, TTFields increased LC3-II in a treatment-duration-dependent manner, with autophagosome-like and autolysosome structures on EM and increased LC3 staining in F98 rat gliomas in vivo.
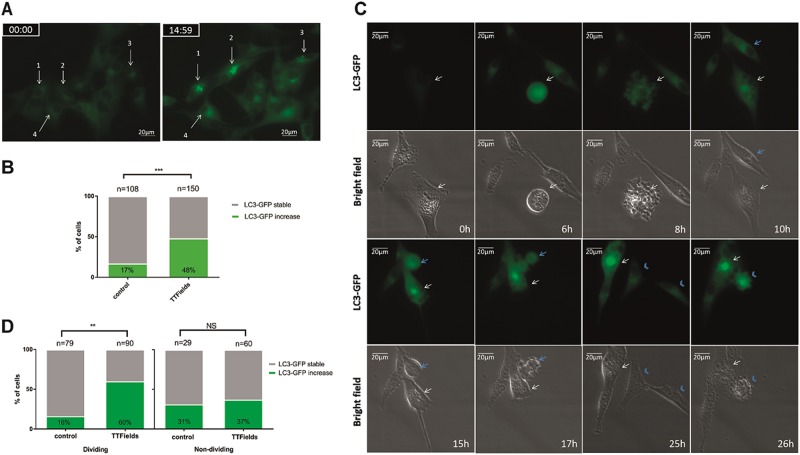
- Autophagy induction was specific to dividing cells: LC3-GFP puncta increased in 51% of TTFields-treated cells vs 17% of untreated cells, and among cells that divided, 60% vs 16% showed increased LC3-GFP; mitotic index was 60% vs 73%, and mitosis duration was 1.5 h vs 1 h (p < 0.05).
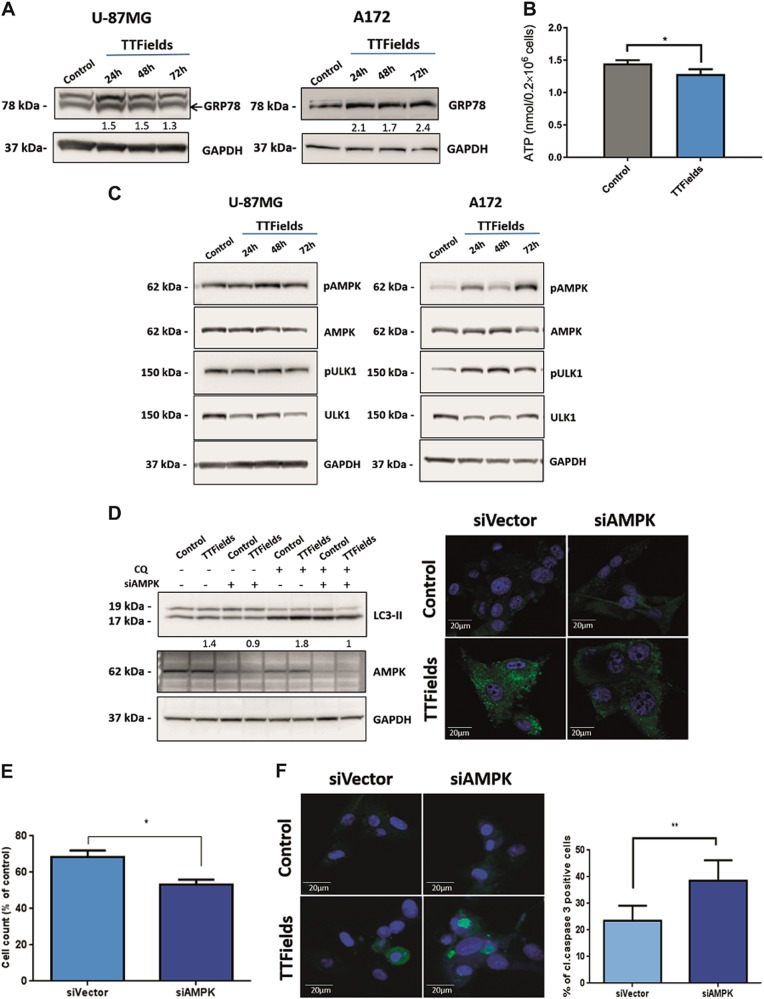
- TTFields increased GRP78 and reduced intracellular ATP by 18% (about 1.2 vs 1.5 nmol per 0.2 × 10^6 cells), activated AMPK/ULK1, and required AMPK for autophagy: siAMPK reduced AMPK protein by 80% and abrogated LC3-II upregulation; siAMPK cells showed 47% vs 32% reduction in cell number versus siVector.
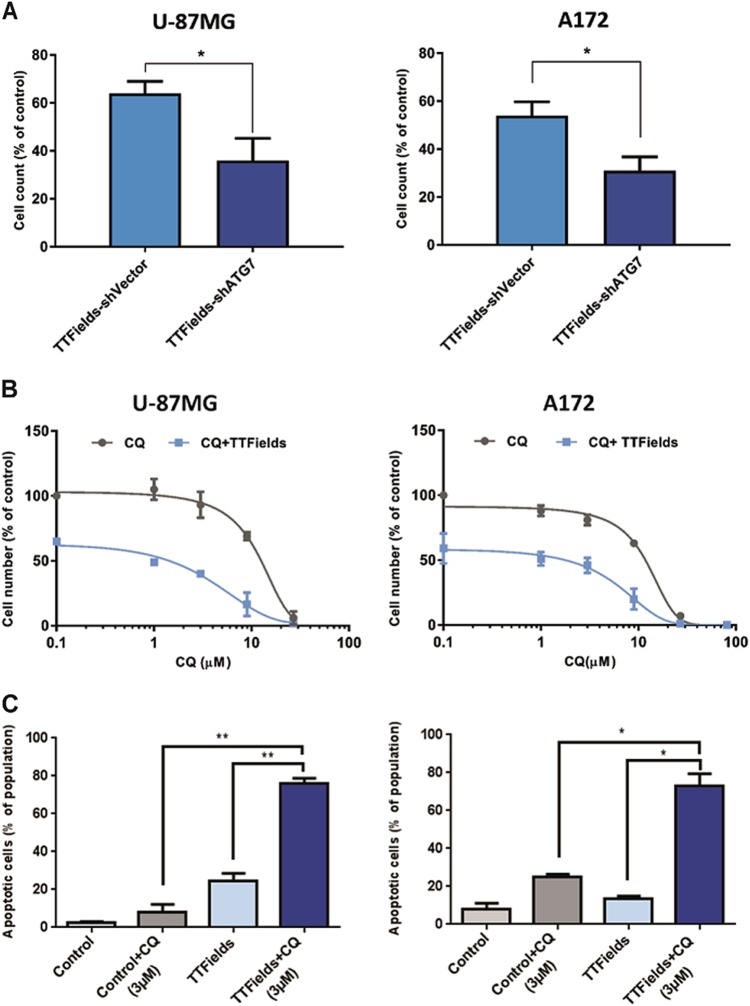
- Autophagy inhibition enhanced TTFields efficacy: shATG7 reduced cell numbers to 36% vs 64% in U-87 MG and 46% vs 62% in A172; TTFields plus low-dose CQ (3 µM) increased apoptosis to 75%, whereas CQ monotherapy increased apoptosis by 25% in A172 and 8% in U-87 MG.
Methods
- Glioma and other cancer cell lines were treated with TTFields using the inovitro system at optimal frequencies (150 or 200 kHz) and 1.75 V/cm RMS; assays included flow cytometry, LysoTracker staining, immunoblotting, immunocytochemistry, electron microscopy, ATP measurement, siRNA-mediated AMPK knockdown, shATG7 lentiviral knockdown, time-lapse microscopy of LC3-GFP, and F98 rat intracranial glioma immunohistochemistry.
- Statistical analysis used means ± SE, two-tailed Student’s t-test, and χ² analysis, with P < 0.05 considered significant; experiments were repeated at least three times with similar results.
Limitations
- The paper states that it did not examine whether TTFields-induced genotoxic stress pathways such as ATM or PARP1 activate AMPK/autophagy, and says future studies are needed.
- The paper states that CQ can have autophagy-independent effects, including Golgi and endo-lysosomal disorganization, so some enhanced efficacy of TTFields plus CQ may be unrelated to autophagy inhibition.
- Evident from the text: the mechanistic autophagy/AMPK and CQ combination experiments are largely in glioma cell lines, while in vivo evidence is limited to LC3 staining in F98 rat tumors without survival or tumor-growth outcomes.
Model-written summary. Check it against the paper before relying on it.
Integrity signals
Registry
Cites
Statistics
Figures
Verification
Claims the paper makes
31 Own result · 18 Not checked yet · 18 Own interpretation · 10 Own method · 1 No basis given
A result the paper reports from its own data — it cites no other source for it, so there is none to check. The quote shows it is in the paper.
In the paper
“Application of TTFields was associated with noticeable increase in autophagy (Fig. 2b, c).”
§ AMPK-dependent autophagy upregulation serves as a survival mechanism in response to Tumor Treating Fields (TTFields) > Results > TTFields increase autophagosome formation and autophagic flux
plaincorrelational- Asserted: passes — The authors put it forward as true.
- Checkable: passes — It can be checked against evidence.
- Load-bearing: passes — The paper’s conclusions depend on it.
- Based: passes — The paper gives a reason why it holds.
A result the paper reports from its own data — it cites no other source for it, so there is none to check. The quote shows it is in the paper.
In the paper
“We found that the mitotic index in TTFields-treated cells was somewhat lower than in control group (60% and 73% of cell population, respectively)”
§ AMPK-dependent autophagy upregulation serves as a survival mechanism in response to Tumor Treating Fields (TTFields) > Results > Stress response in daughter cells produced under TTFields application upregulate autophagy
plain- Asserted: passes — The authors put it forward as true.
- Checkable: passes — It can be checked against evidence.
- Load-bearing: unclear — It is unclear whether the paper’s conclusions depend on it.
- Based: passes — The paper gives a reason why it holds.
A result the paper reports from its own data — it cites no other source for it, so there is none to check. The quote shows it is in the paper.
In the paper
“The addition of CQ, which prevents LC3-II degradation and release back to the cytoplasm, resulted in a significant increase in the LC3-II levels in cells treated with TTFields relative to control cells, as shown by immunoblotting (Fig. 3b, Supplementary Figure 1), immunofluorescent staining for quantification of LC3 puncta (Fig. 3c), as well as autophagic vacuoles accumulation using EM (supplement”
§ AMPK-dependent autophagy upregulation serves as a survival mechanism in response to Tumor Treating Fields (TTFields) > Results > TTFields increase autophagosome formation and autophagic flux
plaindirect- Asserted: passes — The authors put it forward as true.
- Checkable: passes — It can be checked against evidence.
- Load-bearing: passes — The paper’s conclusions depend on it.
- Based: passes — The paper gives a reason why it holds.
A result the paper reports from its own data — it cites no other source for it, so there is none to check. The quote shows it is in the paper.
In the paper
“Upregulation in LC3-GFP signal was detected in cells that exhibited visible signs of abnormal mitosis such as polyploid nucleus following slippage events (Fig. 4c, white arrow).”
§ AMPK-dependent autophagy upregulation serves as a survival mechanism in response to Tumor Treating Fields (TTFields) > Results > Stress response in daughter cells produced under TTFields application upregulate autophagy
plaincorrelational- Asserted: passes — The authors put it forward as true.
- Checkable: passes — It can be checked against evidence.
- Load-bearing: passes — The paper’s conclusions depend on it.
- Based: passes — The paper gives a reason why it holds.
A result the paper reports from its own data — it cites no other source for it, so there is none to check. The quote shows it is in the paper.
In the paper
“Unlike vinblastine, a known inhibitor of autophagosome trafficking, which led to dispersed localization of the two markers, TTFields application did not perturb LC3 and LAMP1 colocalization (Fig. 3d).”
§ AMPK-dependent autophagy upregulation serves as a survival mechanism in response to Tumor Treating Fields (TTFields) > Results > TTFields increase autophagosome formation and autophagic flux
plain- Asserted: passes — The authors put it forward as true.
- Checkable: passes — It can be checked against evidence.
- Load-bearing: passes — The paper’s conclusions depend on it.
- Based: passes — The paper gives a reason why it holds.
A result the paper reports from its own data — it cites no other source for it, so there is none to check. The quote shows it is in the paper.
In the paper
“We found that autophagy is upregulated in glioma cells treated with TTFields as demonstrated by immunoblot analysis of the lipidated microtubule-associated protein light chain 3 (LC3-II).”
- Also stated in: § TTFields increase autophagosome formation and autophagic flux · plain
“Immunoblot assay revealed that LC3-II signal increased after TTFields application, and that this increase in autophagosome formation was dependent on treatment duration (Fig. 2a).”
§ AMPK-dependent autophagy upregulation serves as a survival mechanism in response to Tumor Treating Fields (TTFields) > Abstract
boosteddirect- Asserted: passes — The authors put it forward as true.
- Checkable: passes — It can be checked against evidence.
- Load-bearing: passes — The paper’s conclusions depend on it.
- Based: passes — The paper gives a reason why it holds.
- Also stated in: § TTFields increase autophagosome formation and autophagic flux · plain
A result the paper reports from its own data — it cites no other source for it, so there is none to check. The quote shows it is in the paper.
In the paper
“A robust increase in LC3-GFP puncta fluorescence was revealed in 51% of TTFields-treated cells relative to 17% in untreated cells (Fig. 4a, b).”
§ AMPK-dependent autophagy upregulation serves as a survival mechanism in response to Tumor Treating Fields (TTFields) > Results > Stress response in daughter cells produced under TTFields application upregulate autophagy
boostedcorrelational- Asserted: passes — The authors put it forward as true.
- Checkable: passes — It can be checked against evidence.
- Load-bearing: passes — The paper’s conclusions depend on it.
- Based: passes — The paper gives a reason why it holds.
A result the paper reports from its own data — it cites no other source for it, so there is none to check. The quote shows it is in the paper.
In the paper
“Utilizing time-lapse microscopy, we found that the significant increase in the formation of LC3 puncta was specific to cells that divided during TTFields application.”
- Also stated in: § Stress response in daughter cells produced under TTFields application upregulate autophagy · plain
“Most of the cells that divided during TTFields application showed increased LC3-GFP puncta (60%) relative to 16% of the dividing cells in the untreated culture (Fig. 4d, left).”
- Also stated in: § Discussion · boosted
“We exploited single-cell analysis to show for the first time that TTFields application specifically triggers autophagy in the progeny cells that divided during treatment.”
§ AMPK-dependent autophagy upregulation serves as a survival mechanism in response to Tumor Treating Fields (TTFields) > Abstract
boostedcorrelational- Asserted: passes — The authors put it forward as true.
- Checkable: passes — It can be checked against evidence.
- Load-bearing: passes — The paper’s conclusions depend on it.
- Based: passes — The paper gives a reason why it holds.
- Also stated in: § Stress response in daughter cells produced under TTFields application upregulate autophagy · plain
A result the paper reports from its own data — it cites no other source for it, so there is none to check. The quote shows it is in the paper.
In the paper
“An increased LC3-GFP signal was also detected in cells that had completed cytokinesis, but where the resulting daughter cells showed abnormal morphology (Fig. 4c, blue arrowhead).”
§ AMPK-dependent autophagy upregulation serves as a survival mechanism in response to Tumor Treating Fields (TTFields) > Results > Stress response in daughter cells produced under TTFields application upregulate autophagy
plaincorrelational- Asserted: passes — The authors put it forward as true.
- Checkable: passes — It can be checked against evidence.
- Load-bearing: unclear — It is unclear whether the paper’s conclusions depend on it.
- Based: passes — The paper gives a reason why it holds.
A result the paper reports from its own data — it cites no other source for it, so there is none to check. The quote shows it is in the paper.
In the paper
“and that the duration of mitosis was longer in treated cells than in control cells (1.5 h vs. 1 h, respectively, p < 0.05) (Supplementary Figure 3).”
§ AMPK-dependent autophagy upregulation serves as a survival mechanism in response to Tumor Treating Fields (TTFields) > Results > Stress response in daughter cells produced under TTFields application upregulate autophagy
plaincorrelational- Asserted: passes — The authors put it forward as true.
- Checkable: passes — It can be checked against evidence.
- Load-bearing: unclear — It is unclear whether the paper’s conclusions depend on it.
- Based: passes — The paper gives a reason why it holds.
- The quote only partly states this claim. 1
- It may state two separate claims as one. 10
- Probably not a substantial claim. 22
In the paper
“In all cell lines tested, TTFields application resulted in changes in cellular granularity (Fig. 1a, b)25.”
§ AMPK-dependent autophagy upregulation serves as a survival mechanism in response to Tumor Treating Fields (TTFields) > Results > Effects of TTFields on cellular granularity
What the sources say
- Not checked yetcites [25] Marina, O. C., Sanders, C. K. & Mourant, J. R. Correlating light scattering with internal cellular structures. Biomed. Opt. Express 3, 296–312 (2012). source
plaindirect- Asserted: passes — The authors put it forward as true.
- Checkable: passes — It can be checked against evidence.
- Load-bearing: unclear — It is unclear whether the paper’s conclusions depend on it.
- Based: passes — The paper gives a reason why it holds.
The quote only partly states this claim.
A result the paper reports from its own data — it cites no other source for it, so there is none to check. The quote shows it is in the paper.
In the paper
“Flow cytometry analysis revealed higher levels of apoptosis (75%) in cells treated with TTFields in combination with low dose CQ (3 µM), whereas CQ monotherapy resulted in only 25% increase in apoptosis in A172 cells and 8% in U-87 MG cells (Fig. 6c).”
§ AMPK-dependent autophagy upregulation serves as a survival mechanism in response to Tumor Treating Fields (TTFields) > Results > Inhibition of autophagy enhances TTFields efficacy
plaincorrelational- Asserted: passes — The authors put it forward as true.
- Checkable: passes — It can be checked against evidence.
- Load-bearing: passes — The paper’s conclusions depend on it.
- Based: passes — The paper gives a reason why it holds.
It may state two separate claims as one.
A result the paper reports from its own data — it cites no other source for it, so there is none to check. The quote shows it is in the paper.
In the paper
“Of note, this improvement in efficacy was observed even at low CQ concentrations (3 µM), whereas CQ monotherapy had no effect on cell counts (Fig. 6b).”
§ AMPK-dependent autophagy upregulation serves as a survival mechanism in response to Tumor Treating Fields (TTFields) > Results > Inhibition of autophagy enhances TTFields efficacy
plaindirect- Asserted: passes — The authors put it forward as true.
- Checkable: passes — It can be checked against evidence.
- Load-bearing: passes — The paper’s conclusions depend on it.
- Based: passes — The paper gives a reason why it holds.
It may state two separate claims as one.
A conclusion the paper draws from its own results — it cites no other source for it, so there is none to check. The quote shows it is in the paper.
In the paper
“Taken together, these results demonstrate that TTFields application lead to an increase in the autophagic flux in glioma cell lines with no substantial influence on the fusion degradation steps.”
§ AMPK-dependent autophagy upregulation serves as a survival mechanism in response to Tumor Treating Fields (TTFields) > Results > TTFields increase autophagosome formation and autophagic flux
boosteddirect- Asserted: passes — The authors put it forward as true.
- Checkable: passes — It can be checked against evidence.
- Load-bearing: passes — The paper’s conclusions depend on it.
- Based: passes — The paper gives a reason why it holds.
It may state two separate claims as one.
None of the sources cited for this claim have been checked yet.
In the paper
“TTFields application leads to abnormal mitosis, aneuploidy, and increased cell granularity, which are often associated with enhancement of autophagy.”
- Also stated in: § Stress response in daughter cells produced under TTFields application upregulate autophagy · plain
“Abnormal mitosis following TTFields application results in different cell fates including the formation of aneuploid daughter cells7,8.”
§ AMPK-dependent autophagy upregulation serves as a survival mechanism in response to Tumor Treating Fields (TTFields) > Abstract
What the sources say
- Not checked yetcites [7] Voloshin, T. et al. Alternating electric fields (TTFields) in combination with paclitaxel are therapeutically effective against ovarian cancer cells in vitro and in vivo. Int. J. Cancer 139, 2850–2858 (2016). source
- Not checked yetcites [8] Giladi, M. et al. Mitotic spindle disruption by alternating electric fields leads to improper chromosome segregation and mitotic catastrophe in cancer cells. Sci. Rep. 5, 18046 (2015). source
plaindirect- Asserted: passes — The authors put it forward as true.
- Checkable: passes — It can be checked against evidence.
- Load-bearing: passes — The paper’s conclusions depend on it.
- Based: passes — The paper gives a reason why it holds.
It may state two separate claims as one.
- Also stated in: § Stress response in daughter cells produced under TTFields application upregulate autophagy · plain
In the paper
“Another example is the DNA damage repair enzyme PARP1, which is associated with elevated AMP levels that activate AMPK37.”
§ AMPK-dependent autophagy upregulation serves as a survival mechanism in response to Tumor Treating Fields (TTFields) > Discussion
What the sources say
- Not checked yetcites [37] Rodriguez-Vargas, J. M. et al. ROS-induced DNA damage and PARP-1 are required for optimal induction of starvation-induced autophagy. Cell Res. 22, 1181–1198 (2012). source
plaincorrelational- Asserted: passes — The authors put it forward as true.
- Checkable: passes — It can be checked against evidence.
- Load-bearing: fails — The paper’s conclusions may not depend on it.
- Based: passes — The paper gives a reason why it holds.
Probably not a substantial claim. The paper’s conclusions may not depend on it.
None of the sources cited for this claim have been checked yet.
In the paper
“On the other hand, inhibition at late stages in autophagy (e.g., using bafilomycin or CQ) led to enhanced efficacy of the same treatment as reflected by increased cytotoxic effect, suggesting that accumulation of autolysosomes is necessary for cell death induction45,46.”
§ AMPK-dependent autophagy upregulation serves as a survival mechanism in response to Tumor Treating Fields (TTFields) > Discussion
What the sources say
- Not checked yetcites [45] Shingu, T. et al. Inhibition of autophagy at a late stage enhances imatinib-induced cytotoxicity in human malignant glioma cells. Int. J. Cancer 124, 1060–1071 (2009). source
- Not checked yetcites [46] Verschooten, L. et al. Autophagy inhibitor chloroquine enhanced the cell death inducing effect of the flavonoid luteolin in metastatic squamous cell carcinoma cells. PLoS One 7, e48264 (2012). source
hedgeddirect- Asserted: passes — The authors put it forward as true.
- Checkable: passes — It can be checked against evidence.
- Load-bearing: fails — The paper’s conclusions may not depend on it.
- Based: passes — The paper gives a reason why it holds.
Probably not a substantial claim. The paper’s conclusions may not depend on it.
In the paper
“A preclinical glioma model showed that autophagy upregulation in response to temozolomide confers resistance to treatment42.”
§ AMPK-dependent autophagy upregulation serves as a survival mechanism in response to Tumor Treating Fields (TTFields) > Discussion
What the sources say
- Not checked yetcites [42] Jawhari, S., Ratinaud, M. H. & Verdier, M. Glioblastoma, hypoxia and autophagy: a survival-prone ‘menage-a-trois’. Cell Death Dis. 7, e2434 (2016). source
plaindirect- Asserted: passes — The authors put it forward as true.
- Checkable: passes — It can be checked against evidence.
- Load-bearing: fails — The paper’s conclusions may not depend on it.
- Based: passes — The paper gives a reason why it holds.
Probably not a substantial claim. The paper’s conclusions may not depend on it.
A conclusion the paper draws from its own results — it cites no other source for it, so there is none to check. The quote shows it is in the paper.
In the paper
“and that pharmacological inhibition of autophagy circumvents this resistance and enhances the anti-mitotic effects of TTFields.”
§ AMPK-dependent autophagy upregulation serves as a survival mechanism in response to Tumor Treating Fields (TTFields) > Results > Inhibition of autophagy enhances TTFields efficacy
plaindirect- Asserted: passes — The authors put it forward as true.
- Checkable: passes — It can be checked against evidence.
- Load-bearing: passes — The paper’s conclusions depend on it.
- Based: passes — The paper gives a reason why it holds.
It may state two separate claims as one.
What the paper did — it cites no source for this, so there is none to check. The quote shows it is in the paper.
In the paper
“All experiments were repeated at least three times with similar results.”
§ AMPK-dependent autophagy upregulation serves as a survival mechanism in response to Tumor Treating Fields (TTFields) > Materials and methods > Statistical analysis
plain- Asserted: passes — The authors put it forward as true.
- Checkable: passes — It can be checked against evidence.
- Load-bearing: fails — The paper’s conclusions may not depend on it.
- Based: passes — The paper gives a reason why it holds.
Probably not a substantial claim. The paper’s conclusions may not depend on it.
In the paper
“It is noteworthy that Karanam et al.11 have recently shown that TTFields can potentially induce replication stress and reduction of BRCA1 pathway proteins, eventually leading to genotoxic stress.”
§ AMPK-dependent autophagy upregulation serves as a survival mechanism in response to Tumor Treating Fields (TTFields) > Discussion
What the sources say
- Not checked yetcites [11] Karanam, N. K. et al. Tumor-treating fields elicit a conditional vulnerability to ionizing radiation via the downregulation of BRCA1 signaling and reduced DNA double-strand break repair capacity in non-small cell lung cancer cell lines. Cell Death Dis. 8, e2711 (2017). source
hedgedconditional- Asserted: passes — The authors put it forward as true.
- Checkable: passes — It can be checked against evidence.
- Load-bearing: fails — The paper’s conclusions may not depend on it.
- Based: passes — The paper gives a reason why it holds.
Probably not a substantial claim. The paper’s conclusions may not depend on it. It may state two separate claims as one.
None of the sources cited for this claim have been checked yet.
In the paper
“Induction of autophagy in normal tissue may exert a detrimental effect and lead to autophagic cell death38,39.”
§ AMPK-dependent autophagy upregulation serves as a survival mechanism in response to Tumor Treating Fields (TTFields) > Discussion
What the sources say
hedgedconditional- Asserted: passes — The authors put it forward as true.
- Checkable: passes — It can be checked against evidence.
- Load-bearing: fails — The paper’s conclusions may not depend on it.
- Based: passes — The paper gives a reason why it holds.
Probably not a substantial claim. The paper’s conclusions may not depend on it. It may state two separate claims as one.
In the paper
“The combination of CQ with two additional drugs, 17-allylamino-17-demethoxy-geldanamycin and 5-aminoimidazole-4-carboxamide riboside, had been shown to promote proteotoxic and metabolic stress leading to the induction of apoptosis exclusively in aneuploid cells27.”
§ AMPK-dependent autophagy upregulation serves as a survival mechanism in response to Tumor Treating Fields (TTFields) > Discussion
What the sources say
- Not checked yetcites [27] Tang, Y. C., Williams, B. R., Siegel, J. J. & Amon, A. Identification of aneuploidy-selective antiproliferation compounds. Cell 144, 499–512 (2011). source
plaindirect- Asserted: passes — The authors put it forward as true.
- Checkable: passes — It can be checked against evidence.
- Load-bearing: fails — The paper’s conclusions may not depend on it.
- Based: passes — The paper gives a reason why it holds.
Probably not a substantial claim. The paper’s conclusions may not depend on it.
What the paper did — it cites no source for this, so there is none to check. The quote shows it is in the paper.
In the paper
“Three different areas of similar size from each image were chosen in a blinded manner to be analyzed by ImagJ software.”
§ AMPK-dependent autophagy upregulation serves as a survival mechanism in response to Tumor Treating Fields (TTFields) > Materials and methods > Immunohistochemistry
plain- Asserted: passes — The authors put it forward as true.
- Checkable: passes — It can be checked against evidence.
- Load-bearing: fails — The paper’s conclusions may not depend on it.
- Based: passes — The paper gives a reason why it holds.
Probably not a substantial claim. The paper’s conclusions may not depend on it.
What the paper did — it cites no source for this, so there is none to check. The quote shows it is in the paper.
In the paper
“Count of autophagic vacuoles was performed manually in a blinded manner.”
§ AMPK-dependent autophagy upregulation serves as a survival mechanism in response to Tumor Treating Fields (TTFields) > Materials and methods > Electron microscopy
plain- Asserted: passes — The authors put it forward as true.
- Checkable: passes — It can be checked against evidence.
- Load-bearing: fails — The paper’s conclusions may not depend on it.
- Based: passes — The paper gives a reason why it holds.
Probably not a substantial claim. The paper’s conclusions may not depend on it.
What the paper did — it cites no source for this, so there is none to check. The quote shows it is in the paper.
In the paper
“Control rats were treated by means of sham electrodes, which were geometrically matched to the TTFields group.”
§ AMPK-dependent autophagy upregulation serves as a survival mechanism in response to Tumor Treating Fields (TTFields) > Materials and methods > In-vivo application of TTFields
plain- Asserted: passes — The authors put it forward as true.
- Checkable: passes — It can be checked against evidence.
- Load-bearing: passes — The paper’s conclusions depend on it.
- Based: passes — The paper gives a reason why it holds.
Probably not a substantial claim.
In the paper
“3-MA is known to block class I and class III PI3K activity, thus exhibiting dual activity that could lead to either inhibition or upregulation of autophagy44.”
§ AMPK-dependent autophagy upregulation serves as a survival mechanism in response to Tumor Treating Fields (TTFields) > Discussion
What the sources say
- Not checked yetcites [44] Wu, Y. T. et al. Dual role of 3-methyladenine in modulation of autophagy via different temporal patterns of inhibition on class I and III phosphoinositide 3-kinase. J. Biol. Chem. 285, 10850–10861 (2010). source
hedgedconditional- Asserted: passes — The authors put it forward as true.
- Checkable: passes — It can be checked against evidence.
- Load-bearing: fails — The paper’s conclusions may not depend on it.
- Based: passes — The paper gives a reason why it holds.
Probably not a substantial claim. The paper’s conclusions may not depend on it. It may state two separate claims as one.
What the paper did — it cites no source for this, so there is none to check. The quote shows it is in the paper.
In the paper
“The Sham heat electrodes produced equal temperature changes to those produced by the field electrodes by means of a heating resistor incorporated within them.”
§ AMPK-dependent autophagy upregulation serves as a survival mechanism in response to Tumor Treating Fields (TTFields) > Materials and methods > In-vivo application of TTFields
plain- Asserted: passes — The authors put it forward as true.
- Checkable: passes — It can be checked against evidence.
- Load-bearing: passes — The paper’s conclusions depend on it.
- Based: passes — The paper gives a reason why it holds.
Probably not a substantial claim.
A conclusion the paper draws from its own results — it cites no other source for it, so there is none to check. The quote shows it is in the paper.
In the paper
“Therefore, in addition to aneuploidy, AMPK-dependent induction of autophagy can also be potentially triggered by such genotoxic stress.”
§ AMPK-dependent autophagy upregulation serves as a survival mechanism in response to Tumor Treating Fields (TTFields) > Discussion
hedgedconditional- Asserted: passes — The authors put it forward as true.
- Checkable: passes — It can be checked against evidence.
- Load-bearing: fails — The paper’s conclusions may not depend on it.
- Based: passes — The paper gives a reason why it holds.
Probably not a substantial claim. The paper’s conclusions may not depend on it.
What the paper did — it cites no source for this, so there is none to check. The quote shows it is in the paper.
In the paper
“The quantification of cleaved caspase-3-positive cells was done manually in a blinded manner.”
§ AMPK-dependent autophagy upregulation serves as a survival mechanism in response to Tumor Treating Fields (TTFields) > Materials and methods > Immunocytochemistry
plain- Asserted: passes — The authors put it forward as true.
- Checkable: passes — It can be checked against evidence.
- Load-bearing: fails — The paper’s conclusions may not depend on it.
- Based: passes — The paper gives a reason why it holds.
Probably not a substantial claim. The paper’s conclusions may not depend on it.
None of the sources cited for this claim have been checked yet.
In the paper
“For example, the serine/threonine kinase ATM, which is a major sensor of DNA double-strand breaks, can activate AMPK, thus leading to induction of autophagy35,36.”
§ AMPK-dependent autophagy upregulation serves as a survival mechanism in response to Tumor Treating Fields (TTFields) > Discussion
What the sources say
- Not checked yetcites [35] Alexander, A. et al. ATM signals to TSC2 in the cytoplasm to regulate mTORC1 in response to ROS. Proc. Natl Acad. Sci. USA 107, 4153–4158 (2010). source
- Not checked yetcites [36] Alexander, A., Kim, J. & Walker, C. L. ATM engages the TSC2/mTORC1 signaling node to regulate autophagy. Autophagy 6, 672–673 (2010). source
plaindirect- Asserted: passes — The authors put it forward as true.
- Checkable: passes — It can be checked against evidence.
- Load-bearing: fails — The paper’s conclusions may not depend on it.
- Based: passes — The paper gives a reason why it holds.
Probably not a substantial claim. The paper’s conclusions may not depend on it.
A conclusion the paper draws from its own results — it cites no other source for it, so there is none to check. The quote shows it is in the paper.
In the paper
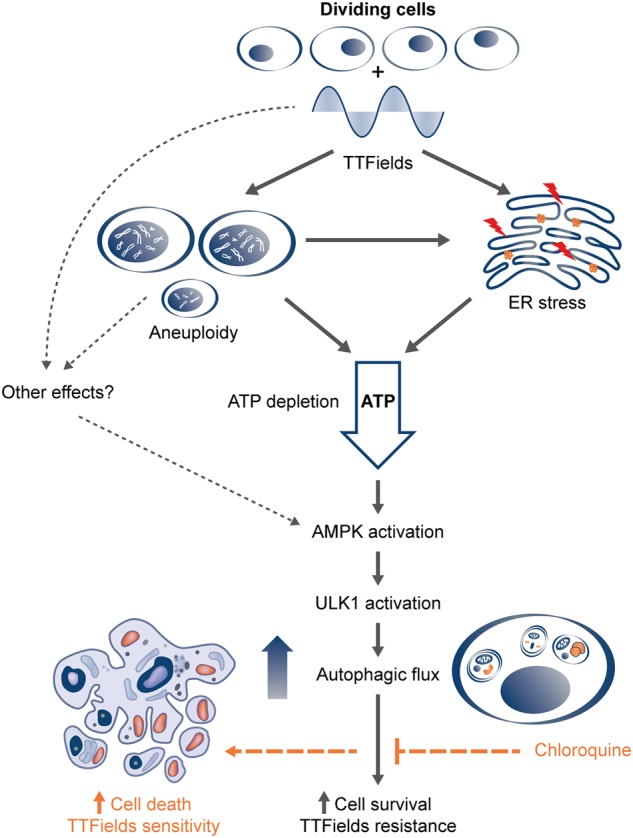
“In this study, we demonstrate that daughter cells surviving TTFields application upregulate autophagy in response to proteotoxic stress, thereby promoting resistance to treatment (Fig. 7).”
§ AMPK-dependent autophagy upregulation serves as a survival mechanism in response to Tumor Treating Fields (TTFields) > Discussion
boosteddirect- Asserted: passes — The authors put it forward as true.
- Checkable: passes — It can be checked against evidence.
- Load-bearing: passes — The paper’s conclusions depend on it.
- Based: passes — The paper gives a reason why it holds.
It may state two separate claims as one.
What the paper did — it cites no source for this, so there is none to check. The quote shows it is in the paper.
In the paper
“ATG7 protein levels in stable culture were further validated in western blot analysis with specific anti ATG7 (rabbit monoclonal, Cell Signaling) antibody.”
§ AMPK-dependent autophagy upregulation serves as a survival mechanism in response to Tumor Treating Fields (TTFields) > Materials and methods > shRNA lentiviral infection
plain- Asserted: passes — The authors put it forward as true.
- Checkable: passes — It can be checked against evidence.
- Load-bearing: fails — The paper’s conclusions may not depend on it.
- Based: passes — The paper gives a reason why it holds.
Probably not a substantial claim. The paper’s conclusions may not depend on it.
A conclusion the paper draws from its own results — it cites no other source for it, so there is none to check. The quote shows it is in the paper.
In the paper
“Targeting a complex process such as autophagy may lead to different consequences depending on the exact stage of autophagy being targeted.”
§ AMPK-dependent autophagy upregulation serves as a survival mechanism in response to Tumor Treating Fields (TTFields) > Discussion
hedgedconditional- Asserted: passes — The authors put it forward as true.
- Checkable: passes — It can be checked against evidence.
- Load-bearing: fails — The paper’s conclusions may not depend on it.
- Based: passes — The paper gives a reason why it holds.
Probably not a substantial claim. The paper’s conclusions may not depend on it.
None of the sources cited for this claim have been checked yet.
In the paper
“Extensive preclinical evidence for the involvement of autophagy in cancer cell survival has led to a rise in clinical trials, which are underway to evaluate the therapeutic potential of autophagy inhibitors in combination with chemotherapy18,40,41.”
§ AMPK-dependent autophagy upregulation serves as a survival mechanism in response to Tumor Treating Fields (TTFields) > Discussion
What the sources say
- Not checked yetcites [18] Towers, C. G. & Thorburn, A. Therapeutic targeting of autophagy. EBioMedicine 14, 15–23 (2016). source
- Not checked yetcites [40] Chen, S. et al. Autophagy is a therapeutic target in anticancer drug resistance. Biochim. Biophys. Acta 1806, 220–229 (2010).
- Not checked yetcites [41] Kumar, A., Singh, U. K. & Chaudhary, A. Targeting autophagy to overcome drug resistance in cancer therapy. Future Med. Chem. 7, 1535–1542 (2015). source
plaindirect- Asserted: passes — The authors put it forward as true.
- Checkable: passes — It can be checked against evidence.
- Load-bearing: fails — The paper’s conclusions may not depend on it.
- Based: passes — The paper gives a reason why it holds.
Probably not a substantial claim. The paper’s conclusions may not depend on it.
What the paper did — it cites no source for this, so there is none to check. The quote shows it is in the paper.
In the paper
“Single cells were followed manually by two independent investigators.”
§ AMPK-dependent autophagy upregulation serves as a survival mechanism in response to Tumor Treating Fields (TTFields) > Materials and methods > Time-lapse microscopy data analysis
plain- Asserted: passes — The authors put it forward as true.
- Checkable: passes — It can be checked against evidence.
- Load-bearing: fails — The paper’s conclusions may not depend on it.
- Based: passes — The paper gives a reason why it holds.
Probably not a substantial claim. The paper’s conclusions may not depend on it.
What the paper did — it cites no source for this, so there is none to check. The quote shows it is in the paper.
In the paper
“Mitotic events were recorded in a blinded manner.”
§ AMPK-dependent autophagy upregulation serves as a survival mechanism in response to Tumor Treating Fields (TTFields) > Materials and methods > Time-lapse microscopy data analysis
plain- Asserted: passes — The authors put it forward as true.
- Checkable: passes — It can be checked against evidence.
- Load-bearing: fails — The paper’s conclusions may not depend on it.
- Based: passes — The paper gives a reason why it holds.
Probably not a substantial claim. The paper’s conclusions may not depend on it.
In the paper
“CQ and its derivative hydroxychloroquine, a broadly used anti-malarial agent, are currently the only clinically available drugs to inhibit autophagy43.”
§ AMPK-dependent autophagy upregulation serves as a survival mechanism in response to Tumor Treating Fields (TTFields) > Discussion
What the sources say
- Not checked yetcites [43] Levy, J. M. M., Towers, C. G. & Thorburn, A. Targeting autophagy in cancer. Nat. Rev. Cancer 17, 528–542 (2017). source
plain- Asserted: passes — The authors put it forward as true.
- Checkable: passes — It can be checked against evidence.
- Load-bearing: fails — The paper’s conclusions may not depend on it.
- Based: passes — The paper gives a reason why it holds.
Probably not a substantial claim. The paper’s conclusions may not depend on it.
What the paper did — it cites no source for this, so there is none to check. The quote shows it is in the paper.
In the paper
“All animal studies were approved by the Novocure Internal Animal Care Committee in accordance with the Technion‐Israel Institute of Technology guidelines for the care of laboratory animals.”
§ AMPK-dependent autophagy upregulation serves as a survival mechanism in response to Tumor Treating Fields (TTFields) > Materials and methods > In-vivo application of TTFields
plain- Asserted: passes — The authors put it forward as true.
- Checkable: passes — It can be checked against evidence.
- Load-bearing: fails — The paper’s conclusions may not depend on it.
- Based: passes — The paper gives a reason why it holds.
Probably not a substantial claim. The paper’s conclusions may not depend on it.
A conclusion the paper draws from its own results — it cites no other source for it, so there is none to check. The quote shows it is in the paper.
In the paper
“This finding suggests that TTFields enhance autophagy in glioma cells as part of a cellular response to aberrant mitosis, with aneuploidy having a crucial role.”
§ AMPK-dependent autophagy upregulation serves as a survival mechanism in response to Tumor Treating Fields (TTFields) > Discussion
hedgeddirect- Asserted: passes — The authors put it forward as true.
- Checkable: passes — It can be checked against evidence.
- Load-bearing: passes — The paper’s conclusions depend on it.
- Based: passes — The paper gives a reason why it holds.
It may state two separate claims as one.
The paper relies on this without support.
Senescence is not detected in cells treated with TTFields.
“As senescence was not detected in cells treated with TTFields, we hypothesized that the origin of the observed granularity may be due to the accumulation of autophagosome vesicles8.”
The paper relies on this without support.
Effective TTFields intensities are present not just in the tumor but also in the surrounding tissues and may potentially affect normal bystander cells.
“Effective TTFields intensities are present not just in the tumor but also in the surrounding tissues and may potentially affect normal bystander cells.”
The paper relies on this without support.
Both preclinical and clinical evidence did not reveal adverse events in normal tissues.
“However, both preclinical and clinical evidence did not reveal adverse events in normal tissues.”
Claims other papers make about this one
Each is checked against this paper’s own text: does it say what the citing paper says it does?
In the citing paper
“For example, the application of alternating electric fields has been shown to disrupt the membranes of subcellular compartments [85] as well as the plasma membrane of human glioblastoma cells [27].”
From Permeabilizing Cell Membranes with Electric Fields (2021) · cites this paper as [85]
Self-check
Percentages, sums and reported differences re-computed from the paper’s own numbers.
Each contradiction between two passages listed here was confirmed by an independent check.
Rated major: it would touch a result — a value a result rests on, reported and recomputed p-values on opposite sides of the significance level, two passages that conflict with no sign which is right, or a cited work retracted before this paper was published.
In the paper
§ AMPK-dependent autophagy upregulation serves as a survival mechanism in response to Tumor Treating Fields (TTFields) > Results > TTFields-induced autophagy is mediated by AMPK activation
“Quantification of intracellular ATP levels in U-87 MG cells either left untreated or treated with TTFields for 72 h.”
§ AMPK-dependent autophagy upregulation serves as a survival mechanism in response to Tumor Treating Fields (TTFields) > Materials and methods > ATP measurement
“After 48 h of treatment, cells were collected and 1 × 10⁶ cells from each sample were resuspended in ATP lysis buffer.”
Rated minor: it would not touch a result — a value no result rests on, a p-value that stays on the same side of the significance level, or a conflict that is clerical, resolved elsewhere in the paper, or outside its own findings.
In the paper
§ AMPK-dependent autophagy upregulation serves as a survival mechanism in response to Tumor Treating Fields (TTFields) > Results > TTFields-induced autophagy is mediated by AMPK activation
“~1.2 nmol for 0.2 × 10⁶ cells) relative to untreated (~1.5 nmol for 0.2 × 10⁶ cells)”
§ AMPK-dependent autophagy upregulation serves as a survival mechanism in response to Tumor Treating Fields (TTFields) > Results > TTFields-induced autophagy is mediated by AMPK activation
“The results are presented as average ATP concentration (nmol/2 × 106 cells)”
Rated minor: it would not touch a result — a value no result rests on, a p-value that stays on the same side of the significance level, or a conflict that is clerical, resolved elsewhere in the paper, or outside its own findings.
In the paper
§ AMPK-dependent autophagy upregulation serves as a survival mechanism in response to Tumor Treating Fields (TTFields) > Results > TTFields-induced autophagy is mediated by AMPK activation
“(**P < 0.01, Student’s t-test, n = 2)”
§ AMPK-dependent autophagy upregulation serves as a survival mechanism in response to Tumor Treating Fields (TTFields) > Materials and methods > Statistical analysis
“All experiments were repeated at least three times with similar results.”
Citations
Cites
Repertoires of Autophagy in the Pathogenesis of Ocular Diseases
Li, Y., Jiang, Q. L., Cao, G.-F., Yao, J., & Yan, B. (2015) · Cellular Physiology and Biochemistry · doi:10.1159/000373980 · Cited by 16,351
AMPK and mTOR regulate autophagy through direct phosphorylation of Ulk1
Kim, J., Kundu, M., Viollet, B., & Guan, K.-L. (2011) · Nature Cell Biology · doi:10.1038/ncb2152 · Cited by 7,227
Autophagy: Renovation of Cells and Tissues
Mizushima, N., & Komatsu, M. (2011) · Cell · doi:10.1016/j.cell.2011.10.026 · Cited by 6,615
LC3, a mammalian homologue of yeast Apg8p, is localized in autophagosome membranes after processing.
Kabeya, Y., Mizushima, N., Ueno, T., Yamamoto, A., Kirisako, T., Noda, T., Kominami, E., Ohsumi, Y., & Yoshimori, T. (2000) · The EMBO Journal · doi:10.1093/emboj/19.21.5720 · Cited by 6,605
Cui, C., Cui, J., Jin, F., Cui, Y., Li, R., Jiang, X., Tian, Y., Wang, R. C., Jiang, P., & Gao, J. (2017) · Cellular Physiology and Biochemistry · doi:10.1159/000479571 · Cited by 5,214
AMPK: a nutrient and energy sensor that maintains energy homeostasis
Hardie, D. G., Ross, F. A., & Hawley, S. A. (2012) · Nature Reviews Molecular Cell Biology · doi:10.1038/nrm3311 · Cited by 4,602
Stupp, R., Taillibert, S., Kanner, A., Read, W., Steinberg, D. M., Lhermitte, B., Toms, S., Idbaih, A., Ahluwalia, M. S., Fink, K., et al. (2017) · JAMA · doi:10.1001/jama.2017.18718 · Cited by 2,644
Self-citationLevy, J. M. M., Towers, C. G., & Thorburn, A. (2017) · Nature Reviews Cancer · doi:10.1038/nrc.2017.53 · Cited by 2,526
Chloroquine inhibits autophagic flux by decreasing autophagosome-lysosome fusion
Mauthe, M., Orhon, I., Rocchi, C., Zhou, X., Luhr, M., Hijlkema, K.-J., Coppes, R. P., Engedal, N., Mari, M., & Reggiori, F. (2018) · Autophagy · doi:10.1080/15548627.2018.1474314 · Cited by 2,122
Autophagy Is Activated for Cell Survival after Endoplasmic ReticulumStress
Ogata, M., Hino, S.-I., Saito, A., Morikawa, K., Kondo, S., Kanemoto, S., Murakami, T., Taniguchi, M., Tanii, I., Yoshinaga, K., et al. (2006) · Molecular and Cellular Biology · doi:10.1128/mcb.01453-06 · Cited by 1,832
Cited by
Sorted by citations
Items 101–107 of 107
Effects of Multifrequency Electromagnetic Pulses on tumor growth in immunocompetent mice
Piredda, R., Martínez, L. G. R., Martínez-Ortega, J., Ferráz, A. L., Villatoro-Gómez, S., Martín-García, E., García‐Bermejo, L., Almendral, J. M., Stamatakis, K., & Revilla, Y. (2026) · Scientific Reports · doi:10.1038/s41598-026-49151-5
Hemmer, S., Henia, M., Schulz‐Schaeffer, W., Ketter, R., Landau, B., Oertel, J., & Urbschat, S. (2026) · Brain Tumor Pathology · doi:10.1007/s10014-025-00527-x
Lan, Y., Zheng, Y., Zhu, Y., Xie, X., Mou, H., Jin, W., Pan, Y., Chen, W., Zhang, S., Chen, G., et al. (2026) · Breast Cancer Targets and Therapy · doi:10.2147/bctt.s568389
Advances in tumor treating fields for solid tumors: Mechanism, evidence and future outlook
Chen, Y., Wu, H., Yang, L., Fang, C., & Zhang, H. (2026) · Critical Reviews in Oncology/Hematology · doi:10.1016/j.critrevonc.2026.105194
Limon, D., Bokstein, F., Blumenthal, D. T., Ram, Z., & Grossman, R. (2026) · Neuro-Oncology Advances · doi:10.1093/noajnl/vdag106
Ma, X., Zuo, Z., Sun, Y., & An, H. (2026) · Frontiers in Immunology · doi:10.3389/fimmu.2026.1782708
Donnini, F., Battaglia, G., Chibbaro, S., Marampon, F., Minniti, G., & Tini, P. (2026) · Cancers · doi:10.3390/cancers18132069
Metadata
- Authors
- Shteingauz, A., Porat, Y., Voloshin, T., Schneiderman, R. S., Munster, M., Zeevi, E., Kaynan, N., Gotlib, K., Giladi, M., Kirson, E. D., Weinberg, U., Kinzel, A., & Palti, Y.
- Corresponding author
- Giladi, Moshe
- Venue
- Cell Death & Disease
- Published
- 2018-10-19
- Volume
- 9
- Issue
- 11
- Pages
- 1074-1074
- ISSN
- 2041-4889 (ISSN-L)
- PMC
- PMC6195570
- OpenAlex
- W2897336072
- Semantic Scholar
- 0c9028c6bb3ef5d1625b9f88285f8d67f0509e07
- Cited by
- 107
- References
- 53
- Citations by year
- 2026: 8 · 2025: 13 · 2024: 18 · 2023: 16 · 2022: 23 · 2021: 12 · 2020: 9 · 2019: 7 · 2018: 1
- FWCI
- 5.66
- Type
- journal article
- Language
- en
- Open access
- gold
- doi.org
- Locations
- Cell Death and Disease (publishedVersion, cc-by)
- Europe PMC (PubMed Central) (publishedVersion, other-oa)
- PubMed Central (publishedVersion, cc-by)
- PubMed (publishedVersion)
- DOAJ (DOAJ: Directory of Open Access Journals) (submittedVersion)
- Funders
- Novocure Ltd
- Topics
- Life Sciences › Biochemistry, Genetics and Molecular Biology › Cell Biology › Autophagy in Disease and Therapy
- Health Sciences › Medicine › Oncology › Glioma Diagnosis and Treatment
- Life Sciences › Biochemistry, Genetics and Molecular Biology › Biophysics › Electromagnetic Fields and Biological Effects
- Keywords
- tumor treating fields, glioblastoma, autophagy, AMPK, ATG7, endoplasmic reticulum stress, GRP78, aneuploidy, chloroquine, tumor cell survival, LC3-II, AC electric field
- MeSH terms
- Autophagosomes, Autophagy-Related Protein 7, Endoplasmic Reticulum Chaperone BiP, Adenosine Triphosphate, Aneuploidy, Animals, Autophagy, Brain Neoplasms, Cell Survival, Electric Stimulation, Electric Stimulation Therapy, Glioblastoma, Heat-Shock Proteins, Humans, Lysosomes, Microtubule-Associated Proteins, Mitosis, Up-Regulation, Vascular Endothelial Growth Factor A, Cell Line, Tumor, Mice, Rats, AMP-Activated Protein Kinases, Endoplasmic Reticulum Stress
About these checks
Registry, retraction, Cites and statistics results are computed, not judged, with one exception: a printed reference that no index lists is read once by a model before it counts as a citation error. Claims are extracted by a model and kept only when their quote appears verbatim in the text; each cited source is then checked, with a model’s help, for whether it says what the claim relies on. Those verdicts can be wrong — read the claim’s quote and the cited source before relying on one.
A language model drew the claims from the paper on 2026-10-10, under version 3 of the claim definition (model deepseek-v4.1-flash, prompt extract-v3).
A second model labelled each claim on 2026-10-10 (model jev-1.13-20260917, definition revision gold-guideline-v0.2).
Statistics and arithmetic are recomputed, not judged.
Confidence bands are shown only for fields calibrated on our annotated test set. None is calibrated yet, so no band is shown.
What counts as a claim ›How we measure confidence ›How we check this ›
Are you an author, or do you see a problem with this page? Request a review
