

The DOI matches its Crossref record; 35 of the 35 references it cites were found in a registry or an index.
Nrf2 attenuates ferroptosis-mediated IIR-ALI by modulating TERT and SLC7A11
Open accessAbstract
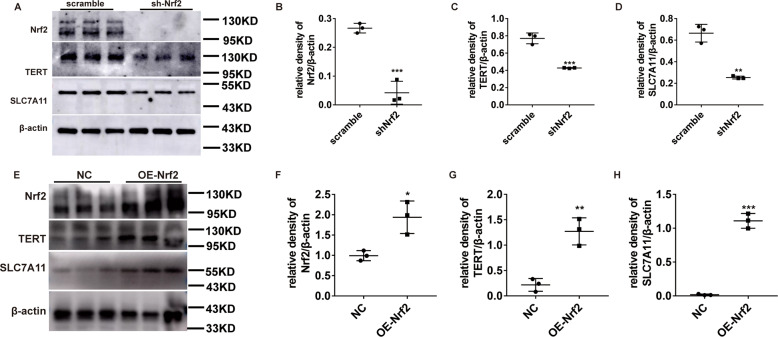
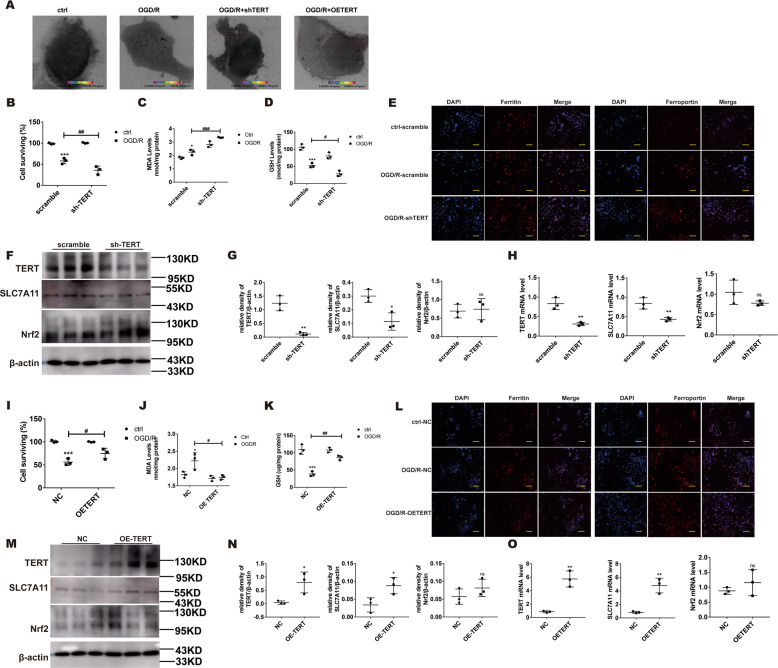
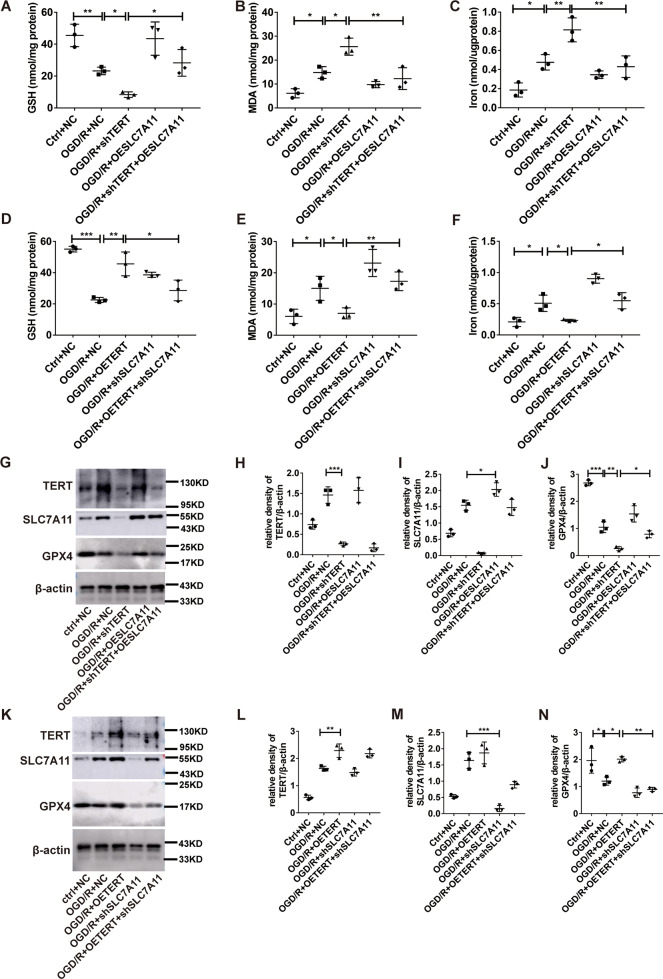
Acute lung injury (ALI) carries a mortality rate of ~50% and is a hot topic in the world of critical illness research. Nuclear factor erythroid 2-related factor 2 (Nrf2) is a critical modulator of intracellular oxidative homeostasis and serves as an antioxidant. The Nrf2-related anti-oxidative stress is strongly associated with ferroptosis suppression. Meanwhile, telomerase reverse transcriptase (TERT), the catalytic portion of the telomerase protein, is reported to travel to the mitochondria to alleviate ROS. In our study, we found that TERT was significantly reduced in lung tissue of Nrf2 −/− mice in the model of intestinal ischemia/reperfusion-induced acute lung injury (IIR-ALI). In addition, MDA levels showed marked increase, whereas GSH and GPX4 levels fell drastically in ALI models. Moreover, typical-related structural changes were observed in the type II alveolar epithelial cells in the IIR model. We further employed the scanning transmission X-ray microscopy (STXM) to examine Fe levels and distribution within cells. Based on our observations, massive aggregates of Fe were found in the MLE-12 cells upon OGD/R (oxygen and glucose deprivation/reperfusion) induction. Additionally, Nrf2 silencing dramatically reduced TERT and SLC7A11 levels, and further exacerbated cellular injuries. In contrast, TERT-overexpressing cells exhibited marked elevation in SLC7A11 levels and thereby inhibited ferroptosis. Collectively, these data suggest that Nrf2 can negatively regulate ferroptosis via modulation of TERT and SLC7A11 levels. The conclusion from this study brings insight into new candidates that can be targeted in future IIR-ALI therapy.
Overview
The claims and statistics of this paper haven’t been checked yet.
Run the check — free, no account needed. It reads the open-access text and checks the sources it cites.
Integrity signals
Registry
Cites
Statistics
Figures
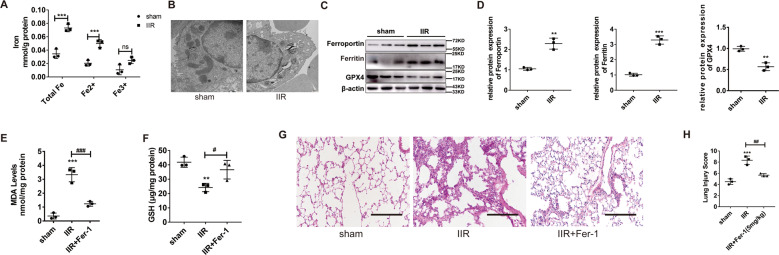
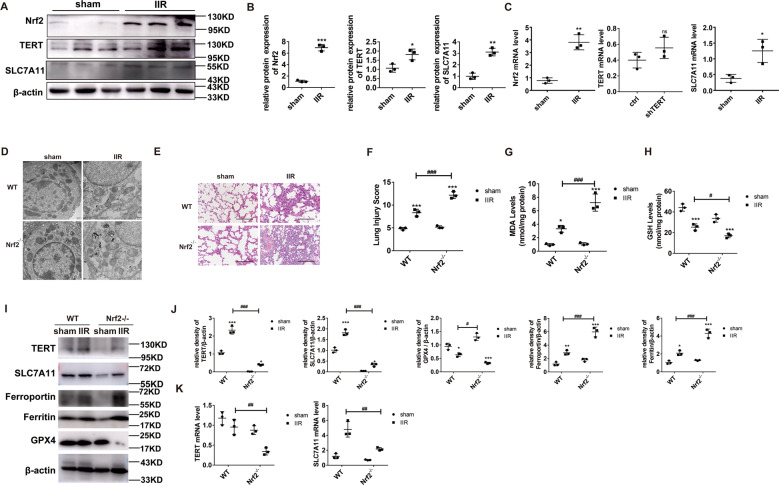
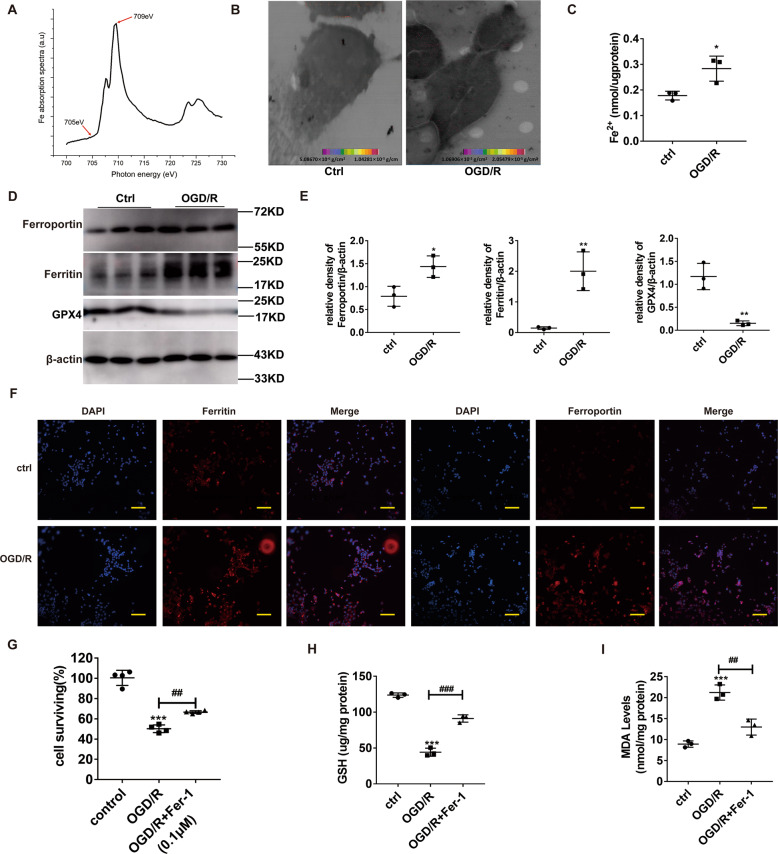
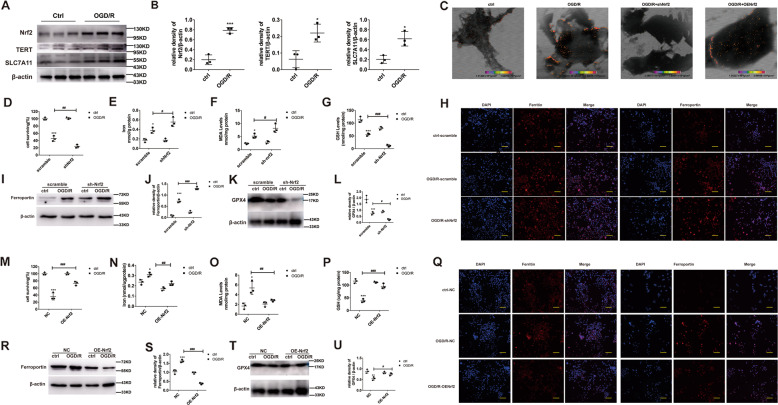
Verification
Claims the paper makes
The claims and statistics of this paper haven’t been checked yet.
Run the check — free, no account needed. It reads the open-access text and checks the sources it cites.
Claims other papers make about this one
Each is checked against this paper’s own text: does it say what the citing paper says it does?
The cited source says what the claim attributes to it.
In the citing paper
“and increased the expression of known target genes of this transcription factor including SLC7A11, AKR1C1, and FTH1 (fig. S5S) (41–45).”
From Secreted Apoe rewires melanoma cell state vulnerability to ferroptosis (2024) · cites this paper as [44]
Self-check
Percentages, sums and reported differences re-computed from the paper’s own numbers.
The self-check needs the paper’s full text.
Citations
Cites
Ferroptosis: An Iron-Dependent Form of Nonapoptotic Cell Death
Dixon, S. J., Lemberg, K. M., Lamprecht, M. R., Skouta, R., Zaitsev, E. M., Gleason, C. E., Patel, D. N., Bauer, A. J., Cantley, A. M., Yang, W. S., et al. (2012) · Cell · doi:10.1016/j.cell.2012.03.042 · Cited by 18,691
Ferroptosis: A Regulated Cell Death Nexus Linking Metabolism, Redox Biology, and Disease
Stockwell, B. R., Friedmann Angeli, J. P., Bayir, H., Bush, A. I., Conrad, M., Dixon, S. J., Fulda, S., Gascón, S., Hatzios, S. K., Kagan, V. E., et al. (2017) · Cell · doi:10.1016/j.cell.2017.09.021 · Cited by 7,695
Łoboda, A., Damulewicz, M., Pyza, E., Józkowicz, A., & Dulak, J. (2016) · Cellular and Molecular Life Sciences · doi:10.1007/s00018-016-2223-0 · Cited by 2,709
NRF2 plays a critical role in mitigating lipid peroxidation and ferroptosis
Dodson, M., Castro-Portuguez, R., & Zhang, D. D. (2019) · Redox Biology · doi:10.1016/j.redox.2019.101107 · Cited by 2,435
Sun, X., Ou, Z., Chen, R., Niu, X., Chen, D., Kang, R., & Tang, D. (2016) · Hepatology · doi:10.1002/hep.28251 · Cited by 2,012
Nrf2-Keap1 pathway promotes cell proliferation and diminishes ferroptosis
Fan, Z., Wirth, A.-K., Chen, D., Wruck, C. J., Rauh, M., Buchfelder, M., & Savaskan, N. E. (2017) · Oncogenesis · doi:10.1038/oncsis.2017.65 · Cited by 695
Roh, J.-L., Kim, E. H., Jang, H., & Shin, D. (2017) · Redox Biology · doi:10.1016/j.redox.2016.12.010 · Cited by 662
Non-transferrin bound iron: a key role in iron overload and iron toxicity
Brissot, P., Ropert, M., Le Lan, C., & Loréal, O. (2012) · Biochimica et Biophysica Acta (BBA) - General Subjects · doi:10.1016/j.bbagen.2011.07.014 · Cited by 654
Lipid Peroxidation-Dependent Cell Death Regulated by GPx4 and Ferroptosis
Imai, H., Matsuoka, M., Kumagai, T., Sakamoto, T., & Koumura, T. (2016) · Current topics in microbiology and immunology · doi:10.1007/82_2016_508 · Cited by 635
Regulated necrosis: disease relevance and therapeutic opportunities
Conrad, M., Angeli, J. P. F., Vandenabeele, P., & Stockwell, B. R. (2016) · Nature Reviews Drug Discovery · doi:10.1038/nrd.2015.6 · Cited by 630
Cited by
Sorted by citations
Items 101–199 of 199
Yang, Z., Han, T., Yang, R., Zhang, Y., Qin, Y., Hou, J., Huo, F., Feng, Z., Ding, Y., Yang, J., et al. (2025) · Frontiers in Immunology · doi:10.3389/fimmu.2025.1531874 · Cited by 10
Gao, X., Tang, M., Li, J., Ma, J., Liu, Z., & Liu, W. (2025) · Respiratory Research · doi:10.1186/s12931-025-03151-7 · Cited by 9
Paraquat-induced ferroptosis suppression via NRF2 expression regulation
Cai, Q., Shen, Q., Zhu, W., Zhang, S., Ke, J., & Lu, Z. (2023) · Toxicology in Vitro · doi:10.1016/j.tiv.2023.105655 · Cited by 9
Gu, Y., Dong, H., Wang, Y., Hu, B., Jiang, H., & Hu, R. (2025) · Biology Direct · doi:10.1186/s13062-025-00678-z · Cited by 8
Self-citationRole of Ferroptosis in Alveolar Epithelial Cells in Acute Respiratory Distress Syndrome
Sun, B., Wang, L., & Zhang, T. (2025) · Journal of Inflammation Research · doi:10.2147/jir.s528482 · Cited by 8
Ferroptosis in Cerebral Ischemia/Reperfusion Injury: Mechanistic Drivers and Therapeutic Frontiers
Song, C., Liu, Z., Tang, J., & Huang, Y. (2026) · Neuropsychiatric Disease and Treatment · doi:10.2147/ndt.s580170 · Cited by 13
Zhou, X., Ma, S., Xu, Y., Sun, C., Liao, J., Song, M., Li, G., Yuchen, L., Chen, P., Hu, Y., et al. (2024) · International Immunopharmacology · doi:10.1016/j.intimp.2024.112223 · Cited by 9
Self-citationInduction of Ferroptosis by Shikonin in Gastric Cancer via the DLEU1/mTOR/GPX4 Axis
Wang, Y.-Y., Xu, M.-D., Liu, C., Wang, X., Zhang, X.-Y., Sheng, W.-Q., & Wang, X.-Y. (2025) · Cell Biology International · doi:10.1002/cbin.70018 · Cited by 8
Self-citationFan, X., Ai, Y., Mu, G., Wang, F., Feng, J., Jia, J., Chen, Y., & Zhou, J. (2025) · Phytomedicine · doi:10.1016/j.phymed.2025.156865 · Cited by 7
He, X., Gu, Y., Lu, G., Zhang, L., Yang, X., Kan, Z., Li, Y., Liu, R., Zhu, X., Yang, Z., et al. (2025) · Life Sciences · doi:10.1016/j.lfs.2025.123965 · Cited by 7
Guo, Z., Zhang, N., Huang, J., Zhang, W., Hu, Y., Chen, S., Gong, M., zhou, J., Yang, J., & Wu, J. (2026) · BME Frontiers · doi:10.34133/bmef.0230 · Cited by 7
Liang, Y., Qiu, S., Zou, Y., Leung, E. L., & Luo, L. (2024) · Antioxidants and Redox Signaling · doi:10.1089/ars.2024.0556 · Cited by 7
Xuhong, J. (2024) · American Journal of Cancer Research · doi:10.62347/jzrn6919 · Cited by 7
Syzygium aromaticum Extract Mitigates Doxorubicin-Induced Hepatotoxicity in Male Rats
Alsirhani, A. M., Abu-Almakarem, A. S., Alwaili, M. A., Aljohani, S., Alali, I., ALrashidi, A. A., Abuzinadah, N. Y., Alkhodair, S. A., Mobasher, M. A., Alothaim, T., et al. (2024) · International Journal of Molecular Sciences · doi:10.3390/ijms252312541 · Cited by 8
Zhu, Z., Huang, Z., Zhang, C., Xu, B., Chen, H., Pei, S., Zhang, B., Jie, L., Shi, X., Liu, Y., et al. (2025) · Frontiers in Pharmacology · doi:10.3389/fphar.2025.1501725 · Cited by 7
Triterpenoids from Uncaria macrophylla as ferroptosis inhibitors
Liang, X., Wei, Y., Hou, X., Guo, Q., Liang, H., Zeng, K., Tu, P., & Zhang, Q. (2022) · Phytochemistry · doi:10.1016/j.phytochem.2022.113530 · Cited by 7
Xu, Y., Zhang, Y., Zhang, J., Liang, W., Wang, Y., Zeng, Z., Liang, Z., Ling, Z., Chen, Y., Deng, X.-M., et al. (2023) · Journal of Intensive Care · doi:10.1186/s40560-023-00689-w · Cited by 7
Self-citationTavkar, V., Goyal, A., Kansal, H., Chopra, V., Garg, K., & Sharma, S. (2025) · Metallomics · doi:10.1093/mtomcs/mfaf030 · Cited by 6
Sharma, A., Srivastava, Y., Prasad, S., Ghosh, S., Kumar, R. S., Bharti, A. C., Singh, R. P., & Nasare, V. D. (2025) · International Journal of Biological Macromolecules · doi:10.1016/j.ijbiomac.2025.149257 · Cited by 7
Ferroptosis: a novel pathogenesis and therapeutic strategies for Parkinson disease: A review
Jiao, D., Yang, Y., Wang, K., & Wang, Y. (2025) · Medicine · doi:10.1097/md.0000000000041218 · Cited by 8
Self-citationZhang, L. J., Kong, D., Zhao, X., Meng, Y., Li, J., Wang, Z., & Chai, W. (2024) · Toxicology · doi:10.1016/j.tox.2024.153866 · Cited by 6
Liu, W., Zou, H., You, D., Zhang, H., & Xu, L. (2024) · Antioxidants · doi:10.3390/antiox13091057 · Cited by 6
Tert‐butyl hydroperoxide induces trabecular meshwork cells injury through ferroptotic cell death
Yan, X., Liu, Q., Wu, S., Fan, X., Teng, Y., Wang, N., & Zhang, J. (2024) · Journal of Cell Communication and Signaling · doi:10.1002/ccs3.12050 · Cited by 5
Wang, Q., Han, C., Zheng, Y., Liu, X., Lv, Z., Du, Z., Liu, T., Hao, C., Meng, X., Li, T., et al. (2025) · Free Radical Biology and Medicine · doi:10.1016/j.freeradbiomed.2025.08.003 · Cited by 5
Guo, Y., Wang, Y., Ni, Y., Bo, B., He, J., Zhu, Y., Qin, A., Zhou, X.-Y., Du, H., Liu, Y., et al. (2025) · Advanced Science · doi:10.1002/advs.202507384 · Cited by 5
Self-citationRAB3IL1: a key regulator in the autophagy-ferroptosis axis of male infertility
Ma, B., Hong, Z., Gao, Y. J., Wan, Y., He, X., Wang, M., & Zhang, Y. (2025) · Biology of Reproduction · doi:10.1093/biolre/ioaf127 · Cited by 5
LncRNAs regulate ferroptosis to affect diabetes and its complications
Chen, Q., Ji, H., Lin, Y., Chen, Z., Liu, Y., Jin, L., & Peng, R. (2022) · Frontiers in Physiology · doi:10.3389/fphys.2022.993904 · Cited by 5
Ferroptosis in cancer: integrating multi-omics, AI-driven biomarkers, and translational challenges
Taki, A. G., Shareef, A., Arora, V., Oweis, R. J., Jyothi, S. R., Singh, U., Sahoo, S., Chauhan, A. S., Alimova, F., Sameer, H. N., et al. (2026) · Clinica Chimica Acta · doi:10.1016/j.cca.2026.121131 · Cited by 5
Yang, Y., Sun, L., Song, C., & Zhou, D. (2025) · Microbiology Spectrum · doi:10.1128/spectrum.02859-24 · Cited by 4
Mathew, D. M., & Gopalakrishnan, A. V. (2025) · Medical Oncology · doi:10.1007/s12032-025-03012-9 · Cited by 4
Deng, J., Li, N., Hao, L., Li, S., Nie, A., Zhang, J., & Hu, X. (2024) · PeerJ · doi:10.7717/peerj.17692 · Cited by 4
Zhou, S., Hu, Y., Liu, L., Li, L., Deng, F., Mo, L., Huang, H., & Liang, Q. (2024) · Journal of Ethnopharmacology · doi:10.1016/j.jep.2024.118831 · Cited by 4
Wu, H., Wu, J., Jiang, J., Qian, Z., Yang, S., Sun, Y., Cui, H., Li, S., Zhang, P., & Zhou, Z. (2024) · Molecular Medicine · doi:10.1186/s10020-024-00951-3 · Cited by 5
Shen, Q., Ma, S., Li, L., & Xia, Y. (2024) · Heliyon · doi:10.1016/j.heliyon.2024.e40549 · Cited by 4
Self-citationMeng, H., Xu, L., Li, P., Guo, D., Li, G., Gu, H., Wang, X., Lin, Y., Xu, Z., & Shen, T. (2025) · Chemistry & Biodiversity · doi:10.1002/cbdv.202500496 · Cited by 3
Yu, X., Xu, B., Zhang, M., Yao, X., Xu, K., Xie, X., Shen, X., & Gao, F. (2025) · The FASEB Journal · doi:10.1096/fj.202502335r · Cited by 3
Rezapour, M., Opoku, L. A., Trefry, S. V., Alili, A., Konadu, M., Dionisio, M. G., Gurcan, M. N., & Narayanan, A. (2025) · Frontiers in Genetics · doi:10.3389/fgene.2025.1722527 · Cited by 3
Wu, X., Liu, S., Zhao, Q. P., Xu, M., Jia, C., Shi, J., Yu, J., & Dong, S. (2026) · Inflammation · doi:10.1007/s10753-025-02433-y · Cited by 3
Ferroptosis and the eye: bridging the gap between cell death and vision preservation
Zhu, G., Lin, Y., Han, Z., Cao, H., Zhu, K., Shi, R., Deng, Y., Li, S., Yang, Q., & Lu, X. (2026) · Frontiers in Immunology · doi:10.3389/fimmu.2026.1791087 · Cited by 3
Zhao, Z.-Q., Yu, Z.-X., Liu, Z.-Q., Yu, T., & Fan, H. (2026) · Current Medical Science · doi:10.1007/s11596-026-00201-z · Cited by 3
Targeting Ferroptosis for Cerebral Neuroprotection in Ischemic Stroke: Pathophysiological Insights
Song, C., Tang, S., Huang, Y., Xie, G., & Tang, J. (2026) · International Journal of General Medicine · doi:10.2147/ijgm.s605531 · Cited by 4
Xie, Z., Guo, J., Deng, Y., Yu, P., Zhi, C., He, Y., Tan, X., Lin, X., Lin, X., Ma, W., et al. (2024) · Process Biochemistry · doi:10.1016/j.procbio.2024.05.007 · Cited by 3
Asiatic acid induces lung cancer toxicity by triggering SRC-mediated ferroptosis
Li, H., Fang, G., Tian, W., Liao, Y., Xiang, J., Hu, Y., & Luo, L. (2024) · Toxicology and Applied Pharmacology · doi:10.1016/j.taap.2024.117097 · Cited by 3
Yan, X., Yang, P., Chen, Y., Wang, Y., Feng, Z., Liu, T., Li, Y., Zhou, C., & Li, M. (2024) · Dose-Response · doi:10.1177/15593258241289829 · Cited by 3
Self-citationXu, M., Ruan, S., Sun, J., Li, J., Chen, D., Ma, Y., Qi, Y., Liu, Z., Ruan, Q., & Huang, Y. (2024) · PLoS Pathogens · doi:10.1371/journal.ppat.1012815 · Cited by 3
Zhang, Y., Chen, C., Li, D., Chen, P., Hang, L., Yang, J., & Xie, J. (2023) · Frontiers in Genetics · doi:10.3389/fgene.2023.1156467 · Cited by 3
Wang, K., Wang, Z., Wang, Z., Xie, X., Zang, L., Wang, L., & Che, F. (2022) · Frontiers in Oncology · doi:10.3389/fonc.2022.962970 · Cited by 3
Lu, L., Zhou, M., Zhang, X., & Qin, X. (2025) · Biochemical Genetics · doi:10.1007/s10528-025-11247-4 · Cited by 2
Mohammad, G. H., Kieswich, J. E., Kumar, A., McCafferty, K., Chakraborty, R., Thiemermann, C., & Yaqoob, M. M. (2025) · Frontiers in Cell and Developmental Biology · doi:10.3389/fcell.2025.1688753 · Cited by 2
Zhu, K., Zhang, K., Li, H., Shen, Y., Wang, L., Hu, Q., Xing, H., & Han, L. (2025) · Discover Oncology · doi:10.1007/s12672-025-04128-0 · Cited by 2
S-palmitoylation in ferroptosis: molecular mechanisms, modulators, and interplay with autophagy
Wang, L., Wang, C., & He, H. (2026) · APOPTOSIS · doi:10.1007/s10495-025-02227-5 · Cited by 2
The Interaction Between Ferroptosis and Necroptosis in Acute and Chronic Kidney Diseases
Song, C., Chen, F., Fang, Y., Ding, X., Han, Q., Duan, Y., Ren, Q., Zhang, D., & Zhu, H. (2026) · Journal of Inflammation Research · doi:10.2147/jir.s559198 · Cited by 2
Alanazi, M., Al-Kuraishy, H. M., Mustafa, A. M., Alruwaili, M., Alexiou, A. T., Papadakis, M., & Batiha, G. E. (2026) · Journal of Pharmacy and Pharmacology · doi:10.1093/jpp/rgag056 · Cited by 2
Delineation and authentication of ferroptosis genes in ventilator-induced lung injury
Huang, E., Han, H., Qin, K., & Du, X. (2024) · BMC Medical Genomics · doi:10.1186/s12920-024-01804-y · Cited by 2
PM2.5 induces ferroptosis in chronic obstructive pulmonary diseases via the GSK-3β/NRF2 pathway
Ye, D., Ou, J., Zhu, D., Bai, G., Guo, M., Zou, X., Lei, M., & Zou, W. (2025) · Experimental Lung Research · doi:10.1080/01902148.2025.2536484 · Cited by 1
Sun, X., Liu, F., Hu, B., Zhu, L., Yang, H., Zheng, J., Hu, H., & Liu, H. (2025) · International Journal of Molecular Sciences · doi:10.3390/ijms26189128 · Cited by 1
Tang, L., Chen, X., Chen, K., Zheng, X., Ye, M., Liu, Z., Li, W., & Liu, X. (2025) · Journal of Ginseng Research · doi:10.1016/j.jgr.2025.11.002 · Cited by 1
Liu, Z., Gao, Y., Cui, H., Mu-sen, L., Sun, Q., Li, Y., & Zhang, Y. (2025) · Toxicon · doi:10.1016/j.toxicon.2025.108930 · Cited by 1
Guan, X., Zhou, Y., Hong, S., Jiang, Y., Xiao, Y., Wang, C., Fu, M., Zhao, H., Chen, S., Fu, Y., et al. (2026) · Clinical Epigenetics · doi:10.1186/s13148-026-02053-9 · Cited by 1
Self-citationChen, Q., Quan, H., Wu, Q., Zhao, X., Tian, S., Guo, J., Liu, K., Zhang, L., Yan, S., Mao, C., et al. (2026) · Optics Express · doi:10.1364/oe.582286 · Cited by 1
Wang, X., Li, J., Wang, Y., Shi, J., Ren, P., Yin, Z., Fan, H., Yin, B., Cui, M., Geng, J., et al. (2026) · The FASEB Journal · doi:10.1096/fj.202503778r · Cited by 1
Self-citationHuang, R.-X., Lu, T., Liu, N.-N., Sun, J.-J., Zhu, J., Chen, M., Chen, D., Wu, Y., Weng, Y., & Wang, Z.-Q. (2026) · Inflammation · doi:10.1007/s10753-026-02499-2 · Cited by 1
Li, Y., Pan, L., Zhao, Q., Xiong, H., Fang, X., Guo, X., Wang, Y., Su, X., Liu, P., Hao, J., et al. (2025) · Microbial Pathogenesis · doi:10.1016/j.micpath.2025.107347 · Cited by 1
Self-citationZhou, Y., Sun, F., Zhang, C., & Li, Z. (2023) · Research Square · doi:10.21203/rs.3.rs-3339280/v1 · Cited by 1
Zhang, Y., Gu, W., Zhang, Y., Zhou, F., Zhao, F., Zeng, B., Wang, X., Lin, X., Liu, N., Yang, W., et al. (2023) · SSRN Electronic Journal · doi:10.2139/ssrn.4521577
Zhang, X., Man, X., Zhang, Q., Zhu, L., Chen, L., Zhu, C., Ci, X., & Yu, X. (2023) · SSRN Electronic Journal · doi:10.2139/ssrn.4587379
Potential Mechanisms of the Ferroptosis Pathway in Iohexol-Induced Renal Injury
Yang, G., Pan, W., Zu, Y., & Yang, X. (2023) · Journal of Biomedical Nanotechnology · doi:10.1166/jbn.2023.3719
Liu, X., Zhong, S., Qiu, K., Chen, X., Wu, W., Zheng, J., Liu, Y., Wu, H., Fan, S., Nie, D., et al. (2023) · Figshare · doi:10.6084/m9.figshare.22914686
Liu, X., Zhong, S., Qiu, K., Chen, X., Wu, W., Zheng, J., Liu, Y., Wu, H., Fan, S., Nie, D., et al. (2023) · Figshare · doi:10.6084/m9.figshare.22914683
Liu, X., Zhong, S., Qiu, K., Chen, X., Wu, W., Zheng, J., Liu, Y., Wu, H., Fan, S., Nie, D., et al. (2023) · Figshare · doi:10.6084/m9.figshare.22914680
Nrf2 Protects Against Acute Lung Injury by Inhibiting Ncoa4-Mediated Ferritinophagy Via Ube3bPreprint
Wang, Y., Dong, H., Gu, Y., Chen, H., Hu, B., Xue, X., Hu, R., & Jiang, H. (2024) · SSRN Electronic Journal · doi:10.2139/ssrn.4853190
Self-citationTokhtueva, M. D., & Melekhin, V. V. (2024) · Molekulyarnaya Meditsina (Molecular medicine) · doi:10.29296/24999490-2024-04-03
Wang, Y., Dong, H., Gu, Y., Chen, H., Hu, B., Xue, X., Hu, R., & Jiang, H. (2024) · Research Square · doi:10.21203/rs.3.rs-5229445/v1
Self-citationTuerxun, H., Zhao, Y., Li, Y., Liu, X., Wen, S., & Zhao, Y. (2024) · Research Square · doi:10.21203/rs.3.rs-5336310/v1
Tuerxun, H., Zhao, Y., Li, Y., Liu, X., Wen, S., & Zhao, Y. (2024) · Research Square · doi:10.21203/rs.3.rs-5336310/v2
Research Progress of Nrf2 Targeting Ferroptosis in Lung Diseases
汪, 珍. (2024) · Journal of Clinical Personalized Medicine · doi:10.12677/jcpm.2024.34380
Wei, W., Liu, C., Du, C., Tang, C., Tan, J., Du, Y., & Pei, S. (2025) · SSRN Electronic Journal · doi:10.2139/ssrn.5205612
Zhang, Y., Sun, J., Lin, Y., Jiang, R., Dong, N., Dong, H., Li, P., Feng, J., Zhu, Z., & Zhang, G. (2025) · Frontiers in Pharmacology · doi:10.3389/fphar.2025.1545111
Self-citationLi, X., Xu, Y., Liu, W., Li, S., Liu, C., Wen, C., Zhao, Q. P., Guo, H., & Wang, Y. (2025) · Research Square · doi:10.21203/rs.3.rs-7370812/v1
Self-citationLi, S., Xu, Y., He, S., Li, X., Shi, J., Zhang, B., Zhu, Y., Li, X., Wang, Y., Liu, C., et al. (2024) · Figshare · doi:10.6084/m9.figshare.26608992
Self-citationLiu, X., Zhong, S., Qiu, K., Chen, X., Wu, W., Zheng, J., Liu, Y., Wu, H., Fan, S., Nie, D., et al. (2023) · Figshare · doi:10.6084/m9.figshare.22914674
Li, S., Xu, Y., He, S., Li, X., Shi, J., Zhang, B., Zhu, Y., Li, X., Wang, Y., Liu, C., et al. (2024) · Figshare · doi:10.6084/m9.figshare.26608989
Self-citationLiu, X., Zhong, S., Qiu, K., Chen, X., Wu, W., Zheng, J., Liu, Y., Wu, H., Fan, S., Nie, D., et al. (2023) · Figshare · doi:10.6084/m9.figshare.22914692
Li, S., Xu, Y., He, S., Li, X., Shi, J., Zhang, B., Zhu, Y., Li, X., Wang, Y., Liu, C., et al. (2024) · Figshare · doi:10.6084/m9.figshare.26608995
Self-citationThe research progress of ferroptosis in acute lung injury
Bai, Y., Ma, Y., & Li, X. (2026) · Biochemistry and Biophysics Reports · doi:10.1016/j.bbrep.2025.102434
Chen, Y., Zhang, J., Cui, S., Zhang, W., Xu, C., Cheng, H., Zhang, L., Liu, Y., Zhang, X., Yin, Z., et al. (2026) · International Journal of Biological Macromolecules · doi:10.1016/j.ijbiomac.2026.151325
Blázquez-Moreno, A., Orgaz, L., Rodríguez-Moreno, E., Asensio, A., Marsal, M. F., Mantecón, L., Infante, C., Samper, E., & Flemetakis, E. (2026) · Nutrition and Health · doi:10.1177/02601060261431078
Di-2-ethylhexylphthalate-induced miR155-5P promotes placental ferroptosis
Gu, X., Sun, F., Li, Y., Yang, S., & Li, Y. (2026) · International Journal of Biological Macromolecules · doi:10.1016/j.ijbiomac.2026.151847
Sun, G., Dong, Y., Deng, J., Wang, Y., Cao, X., Lu, W., Chen, K., Xie, Y., Huang, B., & Chen, Y. (2026) · Advanced Functional Materials · doi:10.1002/adfm.202523503
Self-citationWei, S., Yu, R., Wu, L., Miao, Y., Yang, Z., Wei, B., Wang, Y. N., Shu, G., & Zhao, X. (2026) · Poultry Science · doi:10.1016/j.psj.2026.107315
Self-citationNrf2 signaling pathway and its molecular regulatory mechanism
Pan, Y., Zhang, X., Lu, Y., Qin, H., Chen, R., & Fan, H. (2026) · Journal of Zhejiang University SCIENCE B · doi:10.1631/jzus.b2500053
Quan, X., Xue, X., Ma, H., Yang, L., Chen, C., Liu, Y., Yao, K., Yang, H., Wang, R., Shi, L., et al. (2026) · Cells · doi:10.3390/cells15131220 · Cited by 1
Wang, Z., Ye, W., Wang, J., Ge, X., Zhu, Y., Liu, W. T., Ma, Q., Cai, W., & Rong, Y. (2026) · Burns & Trauma · doi:10.1093/burnst/tkag047
Hu, B., Zhang, Y., Wang, L., Bao, R., Ye, Y., Dai, X., Xue, X., Liu, C. H., Zhang, L. J., & Cao, Y. X. (2026) · Chemico-Biological Interactions · doi:10.1016/j.cbi.2026.112238
Wang, Y., Xia, X., Lu, Y., Zhang, C., Zhou, Y., & Fan, J. (2026) · PLoS ONE · doi:10.1371/journal.pone.0353525
Self-citationPACT Inhibits Malignant Biological Behavior of Ovarian Cancer Cells by Regulating TERT Expression
Yang, X. J., Zhang, Q., Yang, X., Yang, T., Zhang, J., Tian, X., & Han, Z. (2026) · Molecular Carcinogenesis · doi:10.1002/mc.70141
Chen, X., Wei, Z., Gu, M., Liu, P., Yang, Y., & 任凱蒂 (2026) · Genes & Diseases · doi:10.1016/j.gendis.2026.102469
Jie, G., Cao, Z., Wang, J., Lu, W., Zhu, X., Li, Z., Wang, Y., Lü, S., & Xia, L. (2026) · Journal for ImmunoTherapy of Cancer · doi:10.1136/jitc-2026-015974
Self-citationXu, T.-Y., Li, P., Qi, Z.-M., Wu, J.-Z., Li, S.-C., Liang, J.-L., Liu, J., & Yu, P. (2026) · Frontiers in Pharmacology · doi:10.3389/fphar.2026.1948777
Metadata
- Authors
- Dong, H., Xia, Y., Jin, S., Xue, C., Wang, Y., Hu, R., & Jiang, H.
- Affiliations
- Shanghai Jiao Tong University (CN)
- Chinese Academy of Sciences (CN)
- Corresponding author
- Hu, Rong
- Jiang, Hong
- Venue
- Cell Death & Disease
- Published
- 2021-10-29
- Volume
- 12
- Issue
- 11
- Pages
- 1027-1027
- ISSN
- 2041-4889 (ISSN-L)
- PMC
- PMC8556385
- OpenAlex
- W3209906264
- Cited by
- 196
- References
- 35
- Citations by year
- 2026: 29 · 2025: 40 · 2024: 65 · 2023: 36 · 2022: 26
- FWCI
- 21.10
- Type
- journal article
- Language
- en
- Open access
- gold
- doi.org
- Locations
- Cell Death and Disease (publishedVersion, cc-by)
- PubMed Central (publishedVersion, cc-by)
- PubMed (publishedVersion)
- DOAJ (DOAJ: Directory of Open Access Journals) (submittedVersion, cc-by-sa)
- Funders
- Science and Technology Commission of Shanghai Municipality (19ZR1476500)
- National Natural Science Foundation of China (81970065)
- Youth Innovation Promotion Association of the Chinese Academy of Sciences (2017306)
- the Incentive Project of High-level Innovation Team for Shanghai Jiao Tong University School of Medicine
- Topics
- Life Sciences › Biochemistry, Genetics and Molecular Biology › Cancer Research › Ferroptosis and cancer prognosis
- Life Sciences › Biochemistry, Genetics and Molecular Biology › Molecular Biology › Genomics, phytochemicals, and oxidative stress
- Health Sciences › Medicine › Hematology › Iron Metabolism and Disorders
- Keywords
- Nrf2, ferroptosis, telomerase reverse transcriptase, SLC7A11, telomerase, oxidative stress, iron accumulation, GPX4, glutathione, alveolar epithelial cells, Nrf2 knockout mice
- MeSH terms
- Ferroptosis, Animals, Cell Line, Transformed, Disease Models, Animal, Glucose, Intestines, Iron, Mice, Inbred C57BL, Oxygen, Signal Transduction, Reperfusion Injury, Mice, Knockout, Telomerase, Gene Silencing, Amino Acid Transport System y+, NF-E2-Related Factor 2, Mice, Acute Lung Injury, Alveolar Epithelial Cells
About these checks
Registry, retraction, Cites and statistics results are computed, not judged, with one exception: a printed reference that no index lists is read once by a model before it counts as a citation error. Claims are extracted by a model and kept only when their quote appears verbatim in the text; each cited source is then checked, with a model’s help, for whether it says what the claim relies on. Those verdicts can be wrong — read the claim’s quote and the cited source before relying on one.
Statistics and arithmetic are recomputed, not judged.
Confidence bands are shown only for fields calibrated on our annotated test set. None is calibrated yet, so no band is shown.
What counts as a claim ›How we measure confidence ›How we check this ›
Are you an author, or do you see a problem with this page? Request a review
