Cited by 30

The DOI matches its Crossref record; 3 of the 3 references it cites were found in a registry or an index.

miR-188-3p targets skeletal endothelium coupling of angiogenesis and osteogenesis during ageing

He, Wen-Zhen, Yang, Mi, Jiang, Yangzi, He, Chen, Sun, Yu-Chen, Liu, Ling, Huang, Mei, Jiao, Yu-Rui, Chen, Kai-Xuan, Hou, Jing, Huang, Min, Xu, Yi-Li, Feng, Xu, Liu, Ya, Guo, Qi, Peng, Hui, Huang, Yan, Su, Tian, Xiao, Ye, Li, Yusheng, Zeng, Chao, Lei, Guanghua, Luo, Xiang-Hang, Li, Chang-Jun·2022·Cell Death & Disease

Abstract

A specific bone capillary subtype, namely type H vessels, with high expression of CD31 and endomucin, was shown to couple angiogenesis and osteogenesis recently. The number of type H vessels in bone tissue declines with age, and the underlying mechanism for this reduction is unclear. Here, we report that microRNA-188-3p (miR-188-3p) involves this process. miRNA-188-3p expression is upregulated in skeletal endothelium and negatively regulates the formation of type H vessels during ageing. Mice with depletion of miR-188 showed an alleviated age-related decline in type H vessels. In contrast, endothelial-specific overexpression of miR-188-3p reduced the number of type H vessels, leading to decreased bone mass and delayed bone regeneration. Mechanistically, we found that miR-188 inhibits type H vessel formation by directly targeting integrin β3 in endothelial cells. Our findings indicate that miR-188-3p is a key regulator of type H vessel formation and may be a potential therapeutic target for preventing bone loss and accelerating bone regeneration.

Overview

The claims and statistics of this paper haven’t been checked yet.

Run the check — free, no account needed. It reads the open-access text and checks the sources it cites.

A few free checks a day · papers already verified open instantly · results are public

Integrity signals

Registry

Crossref · 10.1038/s41419-022-04902-w

Cites

3 of 3 references verified0 citation errors · 0 not checkable

Statistics

Figures

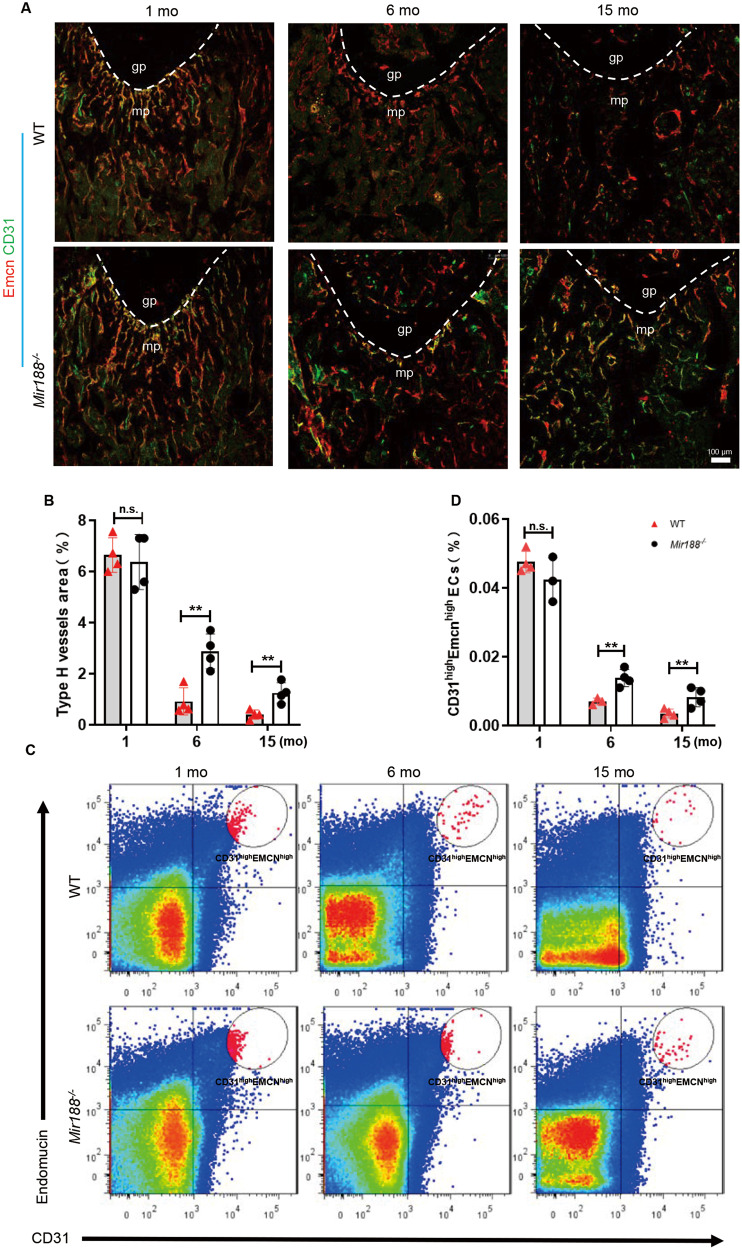
Fig. 1 miR-188 knockout mice showed an alleviated decline in type H vessels with age. A Representative images of coimmunostaining of Emcn (red) and CD31 (green) in femur sections from 1-month-, 6-month-, and 15-month-old WT and miR-188 knockout (Mir188−/−) mice. Scale bar = 100 µm. B Quantification of type H vessels in femur sections from 1-month-, 6-month-, and 15-month-old WT and Mir188−/− mice. n = 4 mice in each group. C Representative images of Flow-cytometry analysis dot plot from the long bones of 1-month-, 6-month-, and 15-month-old WT and Mir188−/− mice. D Quantitative flow-cytometry analysis of CD31high and Emcnhigh cells from the long bones of 1-month-, 6-month-, and 15-month-old WT and Mir188−/− mice. n = 3 (1-month Mir188−/− mice and 6-month WT mice), n = 4 (1-month WT mice, 6-month Mir188−/− mice, 15-month WT mice and 15-month Mir188−/− mice). gp growth plate, mp metaphysis, mo month. Data are shown as the mean ± SD. n.s. no significance; **P < 0.01 by Student’s t test.
Fig. 1 miR-188 knockout mice showed an alleviated decline in type H vessels with age. A Representative images of coimmunostaining of Emcn (red) and CD31 (green) in femur sections from 1-month-, 6-month-, and 15-month-old WT and miR-188 knockout (Mir188−/−) mice. Scale bar = 100 µm. B Quantification of type H vessels in femur sections from 1-month-, 6-month-, and 15-month-old WT and Mir188−/− mice. n = 4 mice in each group. C Representative images of Flow-cytometry analysis dot plot from the long bones of 1-month-, 6-month-, and 15-month-old WT and Mir188−/− mice. D Quantitative flow-cytometry analysis of CD31high and Emcnhigh cells from the long bones of 1-month-, 6-month-, and 15-month-old WT and Mir188−/− mice. n = 3 (1-month Mir188−/− mice and 6-month WT mice), n = 4 (1-month WT mice, 6-month Mir188−/− mice, 15-month WT mice and 15-month Mir188−/− mice). gp growth plate, mp metaphysis, mo month. Data are shown as the mean ± SD. n.s. no significance; **P < 0.01 by Student’s t test.CC BY · PubMed Central
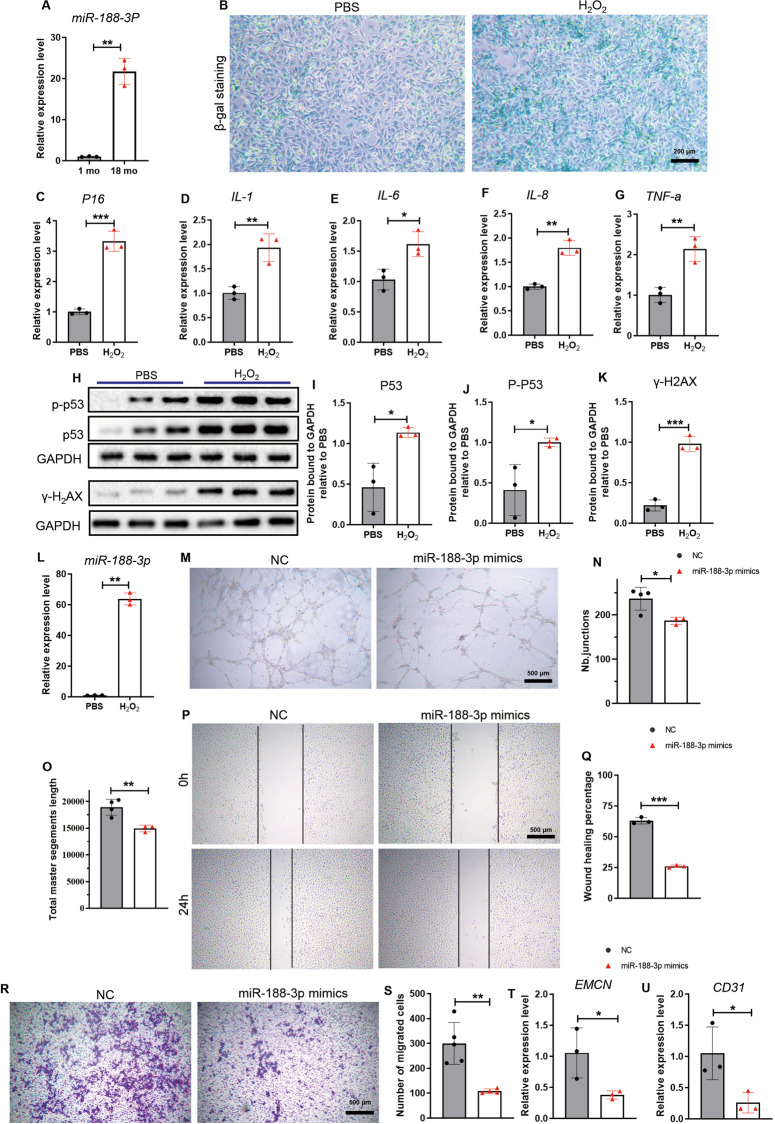
Fig. 2 miR-188-3p expression increased during senescence and inhibited angiogenesis in vitro. A The expression of miR-188-3p in primary endothelial progenitor cells from the age-indicated male C57BL/6 mice. n = 3 in each group. B Representative images of β-gal staining from HMEC-1 treated with PBS or H2O2. Scale bar = 200 µm. C–G The relative expression of Ink4a-p16 and SASP factors (IL-1, IL-6, IL-8, TNF-a) in the HMEC-1 cells treated with PBS or H2O2. n = 3 in each group. H–K Images of western blotting (H) and quantitative analysis of P53, P-P53, γ-H2AX protein expression levels (I–K) in the HMEC-1 cells treated with PBS or H2O2. n = 3 in each group. L The expression of miR-188-3p in HMEC-1 treated with PBS or H2O2. n = 3 in each group. M Representative images of tube formation assays from the groups transfected with miR-188-3p mimics or miRNA-NC. Scale bar = 500 μm. N, O Quantification of tube junction numbers (N) and total master segment length (O) in the tube formation assays of the indicated groups. n = 3 miR-188-3p mimic-treated groups, n = 4 miRNA-NC-treated groups. P, Q Representative images (P) and wound healing percentage (Q) of the endothelial cell line transfected with miR-188-3p or miRNA-NC in the wound healing assays. Scale bar = 500 μm. n = 3 in each group. R, S Representative images (R) and quantitative analysis (S) of the migrated cells from a Transwell migration assay. Scale bar = 500 μm. n = 4 miR-188-3p-treated group, n = 5 miRNA-NC-treated group. T, U The relative expression of Emcn (T) and CD31 (U) in the HMEC-1 cells transfected with miR-188-3p mimics or miRNA-NC. n = 3 in each group. NC: treated with miRNA-NC, miR-188-3p mimics: treated with miR-188-3p mimics. Data are shown as the mean ± SD. n.s. no significance; *P < 0.05; **P < 0.01; ***P < 0.001 by two-tailed Student’s t test or Welch’s t test.
Fig. 2 miR-188-3p expression increased during senescence and inhibited angiogenesis in vitro. A The expression of miR-188-3p in primary endothelial progenitor cells from the age-indicated male C57BL/6 mice. n = 3 in each group. B Representative images of β-gal staining from HMEC-1 treated with PBS or H2O2. Scale bar = 200 µm. C–G The relative expression of Ink4a-p16 and SASP factors (IL-1, IL-6, IL-8, TNF-a) in the HMEC-1 cells treated with PBS or H2O2. n = 3 in each group. H–K Images of western blotting (H) and quantitative analysis of P53, P-P53, γ-H2AX protein expression levels (I–K) in the HMEC-1 cells treated with PBS or H2O2. n = 3 in each group. L The expression of miR-188-3p in HMEC-1 treated with PBS or H2O2. n = 3 in each group. M Representative images of tube formation assays from the groups transfected with miR-188-3p mimics or miRNA-NC. Scale bar = 500 μm. N, O Quantification of tube junction numbers (N) and total master segment length (O) in the tube formation assays of the indicated groups. n = 3 miR-188-3p mimic-treated groups, n = 4 miRNA-NC-treated groups. P, Q Representative images (P) and wound healing percentage (Q) of the endothelial cell line transfected with miR-188-3p or miRNA-NC in the wound healing assays. Scale bar = 500 μm. n = 3 in each group. R, S Representative images (R) and quantitative analysis (S) of the migrated cells from a Transwell migration assay. Scale bar = 500 μm. n = 4 miR-188-3p-treated group, n = 5 miRNA-NC-treated group. T, U The relative expression of Emcn (T) and CD31 (U) in the HMEC-1 cells transfected with miR-188-3p mimics or miRNA-NC. n = 3 in each group. NC: treated with miRNA-NC, miR-188-3p mimics: treated with miR-188-3p mimics. Data are shown as the mean ± SD. n.s. no significance; *P < 0.05; **P < 0.01; ***P < 0.001 by two-tailed Student’s t test or Welch’s t test.CC BY · PubMed Central
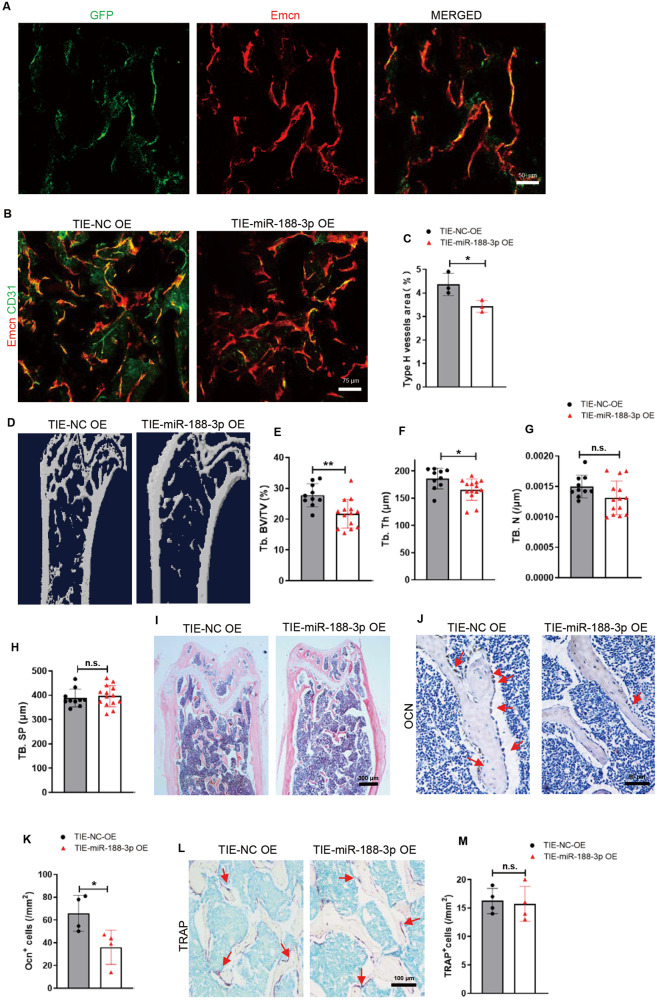
Fig. 3 Mice with endothelial cell-specific miR-188-3p overexpression showed reduced type H vessels and bone mass. A Representative images of Emcn (red) and GFP (green) immunostaining. Scale bar = 50 μm. B Representative images of Emcn (red) and CD31 (green) immunostaining of femur sections from the indicated groups. Scale bar = 75 μm. C Quantification of the type H vessels in femur sections. n = 3 in each group. D–H Representative microcomputed tomography (μCT) images (D) and quantitative μCT analysis (E–H) of trabecular bone microarchitecture in femora from the 3-month-old mice with endothelial cell-specific miR-188-3p or miRNA-NC overexpression. n = 10 mice with endothelial cell-specific miRNA-NC overexpression, n = 14 mice with endothelial cell-specific miR-188-3p overexpression. I Representative images of haematoxylin-eosin staining in femora of the 3-month-old mice with endothelial cell-specific miR-188-3p or miRNA-NC overexpression. Scale bar = 500 μm. J, K Representative images (J) and quantitative analysis (K) of osteocalcin immunohistochemical staining from the 3-month-old mice with endothelial cell-specific miR-188-3p or miRNA-NC overexpression. Scale bar = 50 μm. n = 4 in each group. L, M Representative images (L) and quantitative analysis (M) of TRAP staining from the 3-month-old mice with endothelial cell-specific miR-188-3p or miRNA-NC overexpression. Scale bar = 100 μm. n = 4 in each group. TIE-NC OE overexpression of miRNA-NC in endothelial cells, TIE-3P OE overexpression of miR-188-3p in endothelial cells. Data are shown as the mean ± SD. n.s. no significance; *P < 0.05; **P < 0.001 by two-tailed Student’s t test.
Fig. 3 Mice with endothelial cell-specific miR-188-3p overexpression showed reduced type H vessels and bone mass. A Representative images of Emcn (red) and GFP (green) immunostaining. Scale bar = 50 μm. B Representative images of Emcn (red) and CD31 (green) immunostaining of femur sections from the indicated groups. Scale bar = 75 μm. C Quantification of the type H vessels in femur sections. n = 3 in each group. D–H Representative microcomputed tomography (μCT) images (D) and quantitative μCT analysis (E–H) of trabecular bone microarchitecture in femora from the 3-month-old mice with endothelial cell-specific miR-188-3p or miRNA-NC overexpression. n = 10 mice with endothelial cell-specific miRNA-NC overexpression, n = 14 mice with endothelial cell-specific miR-188-3p overexpression. I Representative images of haematoxylin-eosin staining in femora of the 3-month-old mice with endothelial cell-specific miR-188-3p or miRNA-NC overexpression. Scale bar = 500 μm. J, K Representative images (J) and quantitative analysis (K) of osteocalcin immunohistochemical staining from the 3-month-old mice with endothelial cell-specific miR-188-3p or miRNA-NC overexpression. Scale bar = 50 μm. n = 4 in each group. L, M Representative images (L) and quantitative analysis (M) of TRAP staining from the 3-month-old mice with endothelial cell-specific miR-188-3p or miRNA-NC overexpression. Scale bar = 100 μm. n = 4 in each group. TIE-NC OE overexpression of miRNA-NC in endothelial cells, TIE-3P OE overexpression of miR-188-3p in endothelial cells. Data are shown as the mean ± SD. n.s. no significance; *P < 0.05; **P < 0.001 by two-tailed Student’s t test.CC BY · PubMed Central
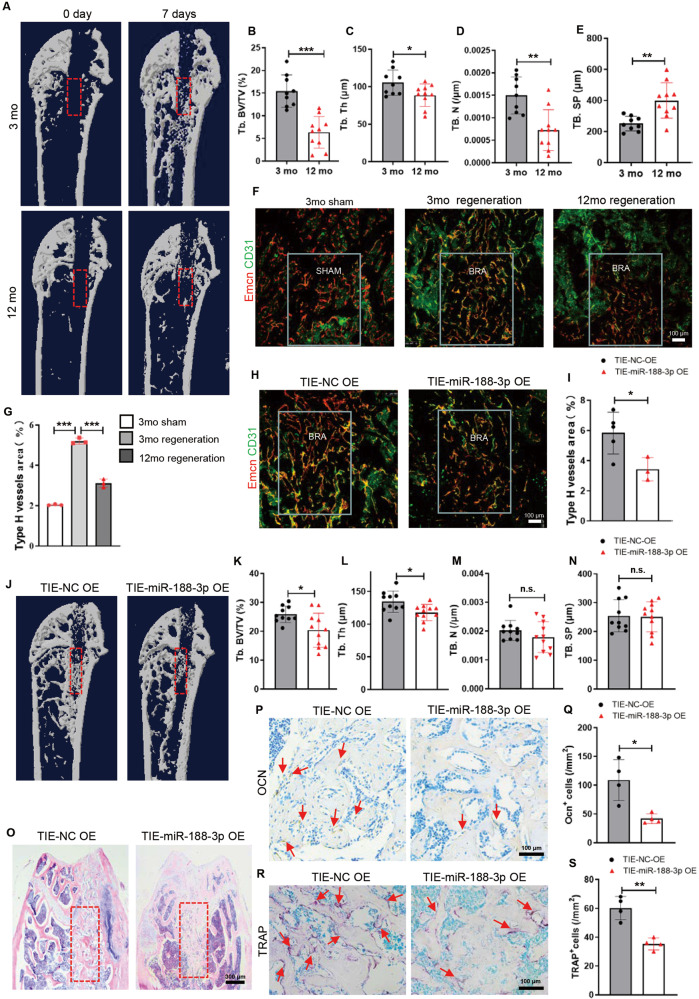
Fig. 4 Mice with endothelial cell-specific miR-188-3p overexpression showed reduced type H vessels and delayed bone regeneration during bone damage repair. A Representative μCT images of trabecular bone microarchitecture in the bone regeneration area from 3-month-old and 12-month-old mice 0 days and 7 days after surgery. B–E Quantification of the trabecular bone microarchitecture in the femora of the bone generation area from 3-month-old and 12-month-old mice. n = 9 (3-month-old mice), n = 10 (12-month-old mice). F, G Representative images (F) and quantitative analysis (G) of Emcn (red) and CD31 (green) immunostaining of the bone regeneration area in femur sections from the indicated mice. Scale bar = 100 μm. n = 3 in each group. H, I Representative images (H) and quantitative analysis (I) of Emcn (red) and CD31 (green) immunostaining of the bone regeneration area in femur sections from the 3-month-old mice with endothelial cell-specific miR-188-3p or miRNA-NC overexpression. Scale bar = 100 μm. n = 5 mice with endothelial cell-specific miRNA-NC overexpression, n = 3 mice with endothelial cell-specific miR-188-3p overexpression. J–N Representative μCT images (J) and quantification (K–N) of trabecular bone microarchitecture in the bone generation area from the 3-month-old mice with endothelial cell-specific miR-188-3p or miRNA-NC overexpression. n = 10 mice with endothelial cell-specific miRNA-NC overexpression, n = 11 mice with endothelial cell-specific miR-188-3p overexpression. O Representative images of haematoxylin-eosin staining in the bone generation area of the 3-month-old mice with endothelial cell-specific miR-188-3p or miRNA-NC overexpression. Scale bar = 500 μm. P, Q Representative images (P) and quantitative analysis (Q) of osteocalcin immunohistochemical staining in the bone generation area from the 3-month-old mice with endothelial cell-specific miR-188-3p or miRNA-NC overexpression. Scale bar = 100 μm. n = 4 in each group. R, S Representative images (R) and quantitative analysis (S) of TRAP staining in the bone generation area from the 3-month-old mice with endothelial cell-specific miR-188-3p or miRNA-NC overexpression. Scale bar = 100 μm. n = 4 in each group. TIE-NC OE overexpression of miRNA-NC in endothelial cells, TIE-3P OE overexpression of miR-188-3p in endothelial cells. BRA bone regeneration, mo month. Data are shown as the mean ± SD. n.s. no significance; *P < 0.05; **P < 0.01; ***P < 0.001 by one-way ANOVA in (G), and two-tailed Student’s t test or Welch’s t test in the rest panels.
Fig. 4 Mice with endothelial cell-specific miR-188-3p overexpression showed reduced type H vessels and delayed bone regeneration during bone damage repair. A Representative μCT images of trabecular bone microarchitecture in the bone regeneration area from 3-month-old and 12-month-old mice 0 days and 7 days after surgery. B–E Quantification of the trabecular bone microarchitecture in the femora of the bone generation area from 3-month-old and 12-month-old mice. n = 9 (3-month-old mice), n = 10 (12-month-old mice). F, G Representative images (F) and quantitative analysis (G) of Emcn (red) and CD31 (green) immunostaining of the bone regeneration area in femur sections from the indicated mice. Scale bar = 100 μm. n = 3 in each group. H, I Representative images (H) and quantitative analysis (I) of Emcn (red) and CD31 (green) immunostaining of the bone regeneration area in femur sections from the 3-month-old mice with endothelial cell-specific miR-188-3p or miRNA-NC overexpression. Scale bar = 100 μm. n = 5 mice with endothelial cell-specific miRNA-NC overexpression, n = 3 mice with endothelial cell-specific miR-188-3p overexpression. J–N Representative μCT images (J) and quantification (K–N) of trabecular bone microarchitecture in the bone generation area from the 3-month-old mice with endothelial cell-specific miR-188-3p or miRNA-NC overexpression. n = 10 mice with endothelial cell-specific miRNA-NC overexpression, n = 11 mice with endothelial cell-specific miR-188-3p overexpression. O Representative images of haematoxylin-eosin staining in the bone generation area of the 3-month-old mice with endothelial cell-specific miR-188-3p or miRNA-NC overexpression. Scale bar = 500 μm. P, Q Representative images (P) and quantitative analysis (Q) of osteocalcin immunohistochemical staining in the bone generation area from the 3-month-old mice with endothelial cell-specific miR-188-3p or miRNA-NC overexpression. Scale bar = 100 μm. n = 4 in each group. R, S Representative images (R) and quantitative analysis (S) of TRAP staining in the bone generation area from the 3-month-old mice with endothelial cell-specific miR-188-3p or miRNA-NC overexpression. Scale bar = 100 μm. n = 4 in each group. TIE-NC OE overexpression of miRNA-NC in endothelial cells, TIE-3P OE overexpression of miR-188-3p in endothelial cells. BRA bone regeneration, mo month. Data are shown as the mean ± SD. n.s. no significance; *P < 0.05; **P < 0.01; ***P < 0.001 by one-way ANOVA in (G), and two-tailed Student’s t test or Welch’s t test in the rest panels.CC BY · PubMed Central
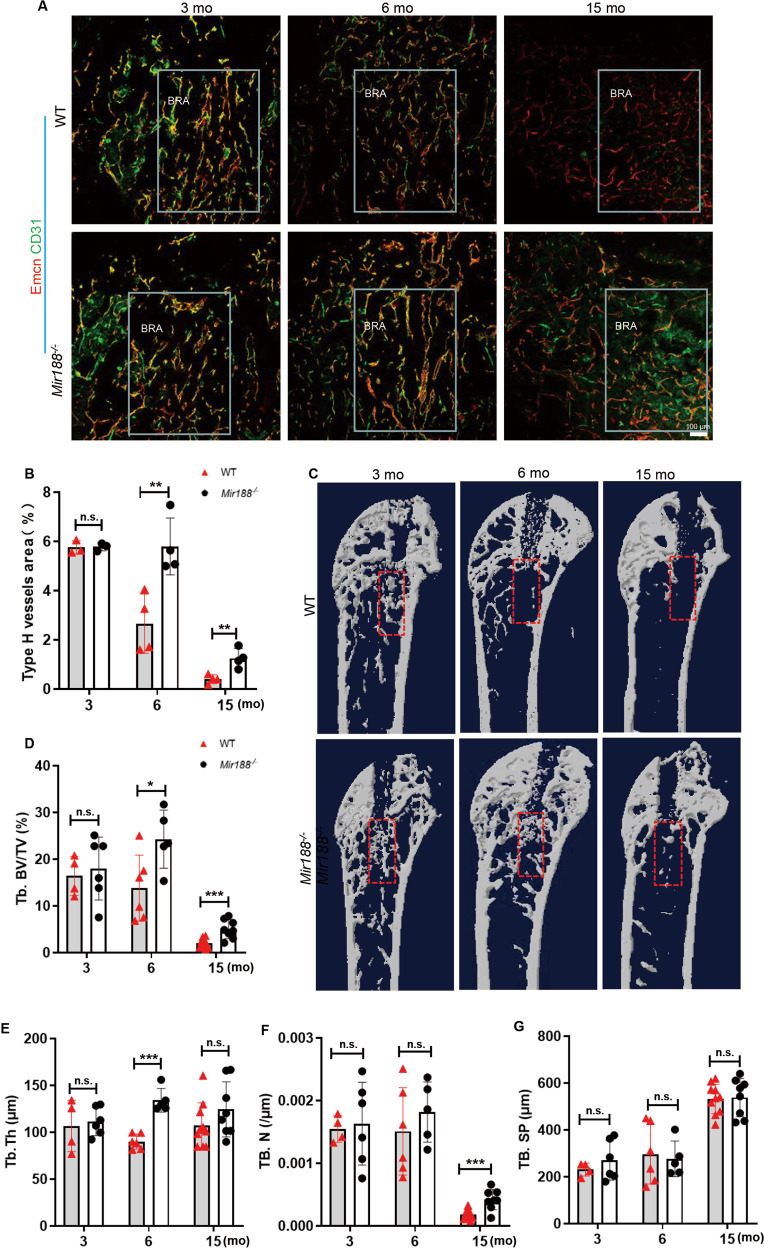
Fig. 5 Mice with knockout miR-188 showed more type H vessels and accelerated bone regeneration during bone damage repair. A Representative images of Emcn (red) and CD31 (green) immunostaining of the bone regeneration area in femur sections from the indicated mice. Scale bar = 100 μm. B Quantitative analysis of type H vessels in the bone regeneration area of femora from the indicated mice. n = 3 (3-month-old WT or miR188−/− mice), n = 4 (6-month-old and 15-month-old WT or miR188−/− mice). C Representative μCT images of trabecular bone microarchitecture in the bone regeneration area from 3-month-, 6-month-, and 15-month-old WT or miR188−/− mice 0 days and 7 days after surgery. D–G Quantitative analysis of trabecular bone microarchitecture in the bone generation area from the indicated mice. n = 4 (3-month WT mice), n = 6 (3-month miR188−/− mice and 6-month WT mice), n = 5 (6-month miR188−/− mice), n = 10 (15-month WT mice), n = 8 (15-month miR188−/− mice). BRA: bone regeneration; mo: month. Data are shown as the mean ± SD. n.s. no significance; *P < 0.05; **P < 0.01; ***P < 0.001 by two-tailed Student’s t test.
Fig. 5 Mice with knockout miR-188 showed more type H vessels and accelerated bone regeneration during bone damage repair. A Representative images of Emcn (red) and CD31 (green) immunostaining of the bone regeneration area in femur sections from the indicated mice. Scale bar = 100 μm. B Quantitative analysis of type H vessels in the bone regeneration area of femora from the indicated mice. n = 3 (3-month-old WT or miR188−/− mice), n = 4 (6-month-old and 15-month-old WT or miR188−/− mice). C Representative μCT images of trabecular bone microarchitecture in the bone regeneration area from 3-month-, 6-month-, and 15-month-old WT or miR188−/− mice 0 days and 7 days after surgery. D–G Quantitative analysis of trabecular bone microarchitecture in the bone generation area from the indicated mice. n = 4 (3-month WT mice), n = 6 (3-month miR188−/− mice and 6-month WT mice), n = 5 (6-month miR188−/− mice), n = 10 (15-month WT mice), n = 8 (15-month miR188−/− mice). BRA: bone regeneration; mo: month. Data are shown as the mean ± SD. n.s. no significance; *P < 0.05; **P < 0.01; ***P < 0.001 by two-tailed Student’s t test.CC BY · PubMed Central
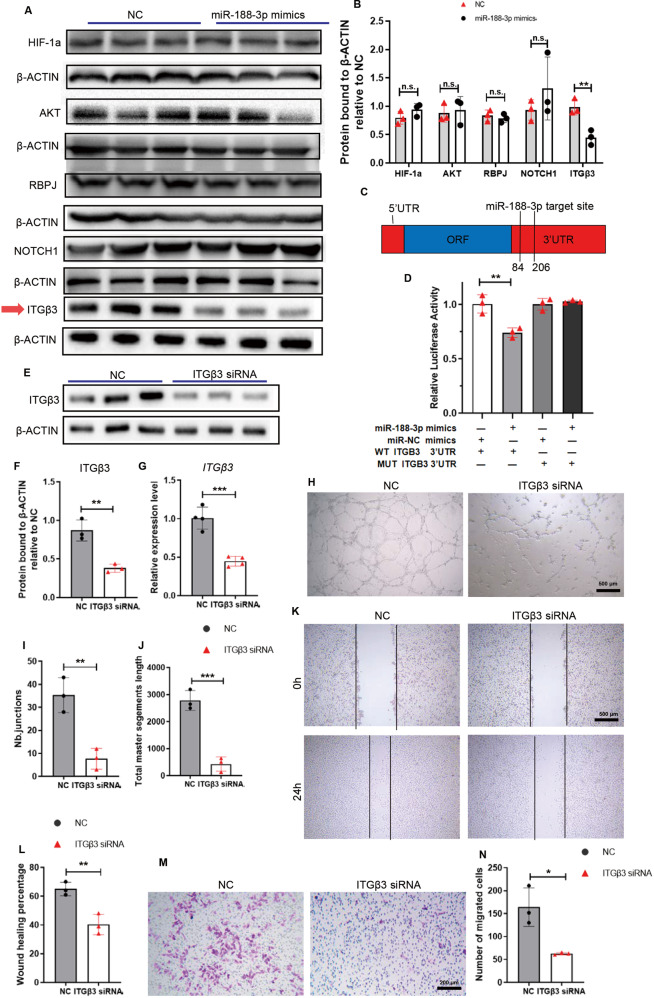
Fig. 6 miR-188-3p inhibited angiogenesis by targeting ITGβ3. A, B Western blotting analysis of the potential and angiogenesis-related targets of miR-188-3p expression in the HMEC-1 cells transfected with miR-188-3p mimics or miRNA-NC. n = 3 in each group. C Schematic of miR-188 targeting the 3′UTR of ITGβ3 mRNA. D The luciferase activity of luciferase reporter plasmids containing ITGβ3-WT 3′UTR and ITGβ3-MUT 3′UTR cotransfected with miR-188-3p mimics or miRNA-NC in HMEC-1 cells. n = 3 in each group. E, F Representative images of Western blotting (E) and quantitative analysis of ITGβ3 protein expression levels (F) in the HMEC-1 cells transfected with ITGβ3-siRNA or siRNA-NC. n = 3 in each group. G Quantitative analysis of ITGβ3 mRNA expression levels in the HMEC-1 cells transfected with ITGβ3-siRNA or siRNA-NC. n = 4 in each group. H–J Representative images (H) and quantification (I, J) of tube junction numbers and total master segments length of tube formation assay from the indicated groups. Scale bar = 400 μm. n = 3 in each group. K, L Representative images (K) and wound healing percentage (L) of the HMECs transfected with ITGβ3-siRNA or siRNA-NC in the wound healing assays. Scale bar = 500 μm. n = 3 in each group. M, N Representative images (M) and quantification (N) of migrated cells from a Transwell migration assay. Scale bar = 200 μm. n = 3 in each group. Data are shown as the mean ± SD. n.s. no significance; *P < 0.05; **P < 0.01; ***P < 0.001 by two-tailed Student’s t test.
Fig. 6 miR-188-3p inhibited angiogenesis by targeting ITGβ3. A, B Western blotting analysis of the potential and angiogenesis-related targets of miR-188-3p expression in the HMEC-1 cells transfected with miR-188-3p mimics or miRNA-NC. n = 3 in each group. C Schematic of miR-188 targeting the 3′UTR of ITGβ3 mRNA. D The luciferase activity of luciferase reporter plasmids containing ITGβ3-WT 3′UTR and ITGβ3-MUT 3′UTR cotransfected with miR-188-3p mimics or miRNA-NC in HMEC-1 cells. n = 3 in each group. E, F Representative images of Western blotting (E) and quantitative analysis of ITGβ3 protein expression levels (F) in the HMEC-1 cells transfected with ITGβ3-siRNA or siRNA-NC. n = 3 in each group. G Quantitative analysis of ITGβ3 mRNA expression levels in the HMEC-1 cells transfected with ITGβ3-siRNA or siRNA-NC. n = 4 in each group. H–J Representative images (H) and quantification (I, J) of tube junction numbers and total master segments length of tube formation assay from the indicated groups. Scale bar = 400 μm. n = 3 in each group. K, L Representative images (K) and wound healing percentage (L) of the HMECs transfected with ITGβ3-siRNA or siRNA-NC in the wound healing assays. Scale bar = 500 μm. n = 3 in each group. M, N Representative images (M) and quantification (N) of migrated cells from a Transwell migration assay. Scale bar = 200 μm. n = 3 in each group. Data are shown as the mean ± SD. n.s. no significance; *P < 0.05; **P < 0.01; ***P < 0.001 by two-tailed Student’s t test.CC BY · PubMed Central

Verification

Claims the paper makes

The claims and statistics of this paper haven’t been checked yet.

Run the check — free, no account needed. It reads the open-access text and checks the sources it cites.

A few free checks a day · papers already verified open instantly · results are public

Claims other papers make about this one

Each is checked against this paper’s own text: does it say what the citing paper says it does?

Self-check

Percentages, sums and reported differences re-computed from the paper’s own numbers.

The self-check needs the paper’s full text.

Citations

Cites

Show all 3 references

Research works printed but not linked: 43

  1. Long F, Ornitz DM. Development of the endochondral skeleton. Cold Spring Harb Perspect Biol. 2013;5:a008334. · DOI
  2. Berendsen AD, Olsen BR. Bone development. Bone. 2015;80:14–8. · DOI
  3. Xu R, Yallowitz A, Qin A, Wu Z, Shin DY, Kim JM, et al. Targeting skeletal endothelium to ameliorate bone loss. Nat Med. 2018;24:823–33. · DOI
  4. Yang P, Lv S, Wang Y, Peng Y, Ye Z, Xia Z, et al. Preservation of type H vessels and osteoblasts by enhanced preosteoclast platelet-derived growth factor type BB attenuates glucocorticoid-induced osteoporosis in growing mice. Bone. 2018;114:1–13. · DOI
  5. Yang M, Li CJ, Xiao Y, Guo Q, Huang Y, Su T, et al. Ophiopogonin D promotes bone regeneration by stimulating CD31(hi) EMCN(hi) vessel formation. Cell Prolif. 2020;53:e12784. · DOI
  6. Romeo SG, Alawi KM, Rodrigues J, Singh A, Kusumbe AP, Ramasamy SK. Endothelial proteolytic activity and interaction with non-resorbing osteoclasts mediate bone elongation. Nat Cell Biol. 2019;21:430–41. · DOI
  7. Ramasamy SK, Kusumbe AP, Wang L, Adams RH. Endothelial Notch activity promotes angiogenesis and osteogenesis in bone. Nature. 2014;507:376–80. · DOI · Paper page
  8. Xie H, Cui Z, Wang L, Xia Z, Hu Y, Xian L, et al. PDGF-BB secreted by preosteoclasts induces angiogenesis during coupling with osteogenesis. Nat Med. 2014;20:1270–8. · DOI · Paper page
  9. Ramasamy SK, Kusumbe AP, Schiller M, Zeuschner D, Bixel MG, Milia C, et al. Blood flow controls bone vascular function and osteogenesis. Nat Commun. 2016;7:13601. · DOI
  10. Yang M, Li CJ, Sun X, Guo Q, Xiao Y, Su T, et al. MiR-497 approximately 195 cluster regulates angiogenesis during coupling with osteogenesis by maintaining endothelial Notch and HIF-1alpha activity. Nat Commun. 2017;8:16003. · DOI
  11. Wang X, Li X, Li J, Zhai L, Liu D, Abdurahman A, et al. Mechanical loading stimulates bone angiogenesis through enhancing type H vessel formation and downregulating exosomal miR-214-3p from bone marrow-derived mesenchymal stem cells. FASEB J. 2021;35:e21150.
  12. Peng Y, Wu S, Li Y, Crane JL. Type H blood vessels in bone modeling and remodeling. Theranostics. 2020;10:426–36. · DOI
  13. Gibon E, Lu L, Goodman SB. Aging, inflammation, stem cells, and bone healing. Stem Cell Res Ther. 2016;7:44. · DOI
  14. Li CJ, Cheng P, Liang MK, Chen YS, Lu Q, Wang JY, et al. MicroRNA-188 regulates age-related switch between osteoblast and adipocyte differentiation. J Clin Investig. 2015;125:1509–22. · DOI
  15. Huang Y, Xiao Y, Liu Y, Guo M, Guo Q, Zhou F, et al. MicroRNA-188 regulates aging-associated metabolic phenotype. Aging Cell. 2020;19:e13077. · DOI
  16. Zhang J, Hu M, Teng Z, Tang YP, Chen C. Synaptic and cognitive improvements by inhibition of 2-AG metabolism are through upregulation of microRNA-188-3p in a mouse model of Alzheimer’s disease. J Neurosci. 2014;34:14919–33. · DOI
  17. Fafian-Labora J, Morente-Lopez M, Sanchez-Dopico MJ, Arntz OJ, van de Loo FAJ, De Toro J, et al. Influence of mesenchymal stem cell-derived extracellular vesicles in vitro and their role in ageing. Stem Cell Res Ther. 2020;11:13. · DOI
  18. Zheng Y, Liu H, Kong Y. miR-188 promotes senescence of lineage-negative bone marrow cells by targeting MAP3K3 expression. FEBS Lett. 2017;591:2290–8. · DOI
  19. Campbell ID, Humphries MJ. Integrin structure, activation, and interactions. Cold Spring Harb Perspect Biol. 2011;3:a004994. · DOI
  20. Humphries MJ. Integrin structure. Biochem Soc Trans. 2000;28:311–39. · DOI
  21. Semon JA, Nagy LH, Llamas CB, Tucker HA, Lee RH, Prockop DJ. Integrin expression and integrin-mediated adhesion in vitro of human multipotent stromal cells (MSCs) to endothelial cells from various blood vessels. Cell Tissue Res. 2010;341:147–58. · DOI
  22. Staunton DE, Lupher ML, Liddington R, Gallatin WM. Targeting integrin structure and function in disease. Adv Immunol. 2006;91:111–57. · DOI
  23. Fuentes P, Sese M, Guijarro PJ, Emperador M, Sanchez-Redondo S, Peinado H, et al. ITGB3-mediated uptake of small extracellular vesicles facilitates intercellular communication in breast cancer cells. Nat Commun. 2020;11:4261. · DOI
  24. Langen UH, Pitulescu ME, Kim JM, Enriquez-Gasca R, Sivaraj KK, Kusumbe AP, et al. Cell-matrix signals specify bone endothelial cells during developmental osteogenesis. Nat Cell Biol. 2017;19:189–201. · DOI
  25. Wu CH, Ko JL, Pan HH, Chiu LY, Kang YT, Hsiao YP. Ni-induced TGF-beta signaling promotes VEGF-a secretion via integrin beta3 upregulation. J Cell Physiol. 2019;234:22093–102. · DOI
  26. Gong Y, Yang X, He Q, Gower L, Prudovsky I, Vary CP, et al. Sprouty4 regulates endothelial cell migration via modulating integrin beta3 stability through c-Src. Angiogenesis 2013;16:861–75. · DOI
  27. Yougbare I, Lang S, Yang H, Chen P, Zhao X, Tai WS, et al. Maternal anti-platelet beta3 integrins impair angiogenesis and cause intracranial hemorrhage. J Clin Investig. 2015;125:1545–56. · DOI
  28. Bolduc JA, Collins JA, Loeser RF. Reactive oxygen species, aging and articular cartilage homeostasis. Free Radic Biol Med. 2019;132:73–82. · DOI
  29. Saxena S, Vekaria H, Sullivan PG, Seifert AW. Connective tissue fibroblasts from highly regenerative mammals are refractory to ROS-induced cellular senescence. Nat Commun. 2019;10:4400. · DOI
  30. Sikora E, Bielak-Zmijewska A, Mosieniak G. A common signature of cellular senescence; does it exist? Ageing Res Rev. 2021;71:101458. · DOI
  31. Jiang P, Du W, Mancuso A, Wellen KE, Yang X. Reciprocal regulation of p53 and malic enzymes modulates metabolism and senescence. Nature. 2013;493:689–93. · DOI · Paper page
  32. Wang J, Feng Y, Han P, Wang F, Luo X, Liang J, et al. Photosensitization of A2E triggers telomere dysfunction and accelerates retinal pigment epithelium senescence. Cell Death Dis. 2018;9:178. · DOI
  33. Gustafsson E, Brakebusch C, Hietanen K, Fssler R. Tie-1-directed expression of Cre recombinase in endothelial cells of embryoid bodies and transgenic mice. J Cell Sci. 2001;114:671–6. · DOI
  34. Garcia DM, Baek D, Shin C, Bell GW, Grimson A, Bartel DP. Weak seed-pairing stability and high target-site abundance decrease the proficiency of lsy-6 and other microRNAs. Nat Struct Mol Biol. 2011;18:1139–46. · DOI
  35. Betel D, Koppal A, Agius P, Sander C, Leslie C. Comprehensive modeling of microRNA targets predicts functional non-conserved and non-canonical sites. Genome Biol. 2010;11:R90. · DOI · Paper page
  36. Liang Z, Chi YJ, Lin GQ, Luo SH, Jiang QY, Chen YK. MiRNA-26a promotes angiogenesis in a rat model of cerebral infarction via PI3K/AKT and MAPK/ERK pathway. Eur Rev Med Pharmacol Sci. 2018;22:3485–92.
  37. Imamaki R, Ogawa K, Kizuka Y, Komi Y, Kojima S, Kotani N, et al. Glycosylation controls cooperative PECAM-VEGFR2-β3 integrin functions at the endothelial surface for tumor angiogenesis. Oncogene. 2018;37:4287–99. · DOI
  38. Chen H, Hu B, Lv X, Zhu S, Zhen G, Wan M, et al. Prostaglandin E2 mediates sensory nerve regulation of bone homeostasis. Nat Commun. 2019;10:181. · DOI · Paper page
  39. Fukuda T, Takeda S, Xu R, Ochi H, Sunamura S, Sato T, et al. Sema3A regulates bone-mass accrual through sensory innervations. Nature. 2013;497:490–3. · DOI
  40. Sekiguchi H, Ii M, Jujo K, Yokoyama A, Hagiwara N, Asahara T. Improved culture-based isolation of differentiating endothelial progenitor cells from mouse bone marrow mononuclear cells. PLoS ONE. 2011;6:e28639. · DOI
  41. Aday S, Zoldan J, Besnier M, Carreto L, Saif J, Fernandes R, et al. Synthetic microparticles conjugated with VEGF165 improve the survival of endothelial progenitor cells via microRNA-17 inhibition. Nat Commun. 2017;8:747. · DOI
  42. Deshane J, Chen S, Caballero S, Grochot-Przeczek A, Was H, Li Calzi S, et al. Stromal cell-derived factor 1 promotes angiogenesis via a heme oxygenase 1-dependent mechanism. J Exp Med. 2007;204:605–18. · DOI
  43. Chu DT, Phuong TNT, Tien NLB, Tran DK, Thanh VV, Quang TL, et al. An update on the progress of isolation, culture, storage, and clinical application of human bone marrow mesenchymal stem/stromal cells. Int J Mol Sci. 2020;21:708. · DOI

Cited by

Sorted by citations

See all 30

Metadata

Authors
He, W.-Z., Yang, M., Jiang, Y., He, C., Sun, Y.-C., Liu, L., Huang, M., Jiao, Y.-R., Chen, K.-X., Hou, J., Huang, M., Xu, Y.-L., Feng, X., Liu, Y., Guo, Q., Peng, H., Huang, Y., Su, T., Xiao, Y., Li, Y., Zeng, C., Lei, G., Luo, X.-H., & Li, C.-J.
Venue
Cell Death & Disease
Published
2022-05-25
Volume
13
Issue
5
ISSN
2041-4889
Cited by
30
References
3
Language
en

About these checks

Registry, retraction, Cites and statistics results are computed, not judged, with one exception: a printed reference that no index lists is read once by a model before it counts as a citation error. Claims are extracted by a model and kept only when their quote appears verbatim in the text; each cited source is then checked, with a model’s help, for whether it says what the claim relies on. Those verdicts can be wrong — read the claim’s quote and the cited source before relying on one.

Statistics and arithmetic are recomputed, not judged.

Confidence bands are shown only for fields calibrated on our annotated test set. None is calibrated yet, so no band is shown.

What counts as a claim ›How we measure confidence ›How we check this ›

Are you an author, or do you see a problem with this page? Request a review

How to cite

Cite CoChat for the checks on this page, and the paper for its own findings.

This page
CoChat. (2026). Citation check: miR-188-3p targets skeletal endothelium coupling of angiogenesis and osteogenesis during ageing. https://app.cochat.ai/papers/10.1038/s41419-022-04902-w
The paper
He, W.-Z., Yang, M., Jiang, Y., He, C., Sun, Y.-C., Liu, L., Huang, M., Jiao, Y.-R., Chen, K.-X., Hou, J., Huang, M., Xu, Y.-L., Feng, X., Liu, Y., Guo, Q., Peng, H., Huang, Y., Su, T., Xiao, Y., . . . Li, C.-J. (2022). miR-188-3p targets skeletal endothelium coupling of angiogenesis and osteogenesis during ageing. Cell Death & Disease. https://doi.org/10.1038/s41419-022-04902-w