

The DOI matches its Crossref record; 52 of the 54 references it cites were found in a registry or an index.
Fast-charging high-energy lithium-ion batteries via implantation of amorphous silicon nanolayer in edge-plane activated graphite anodes
Open accessAbstract
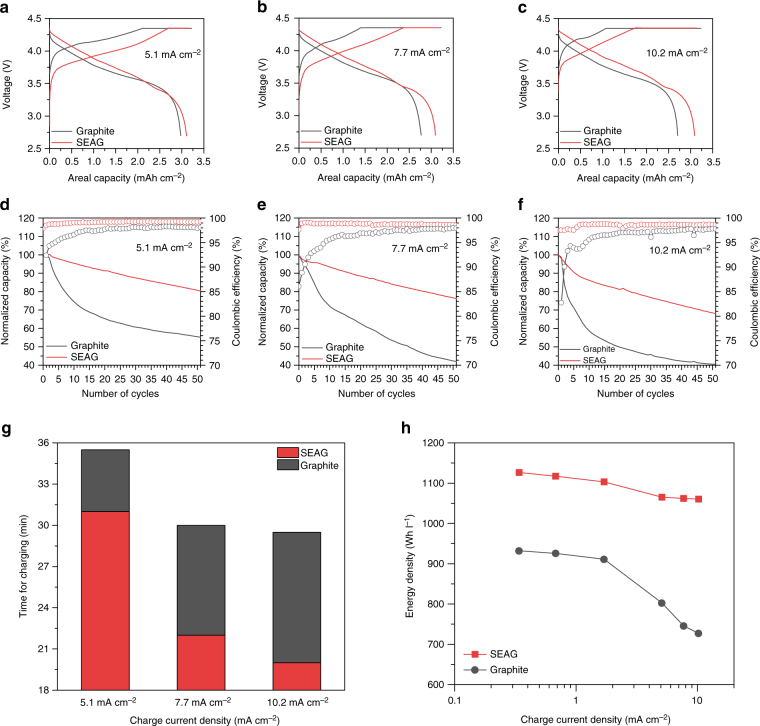
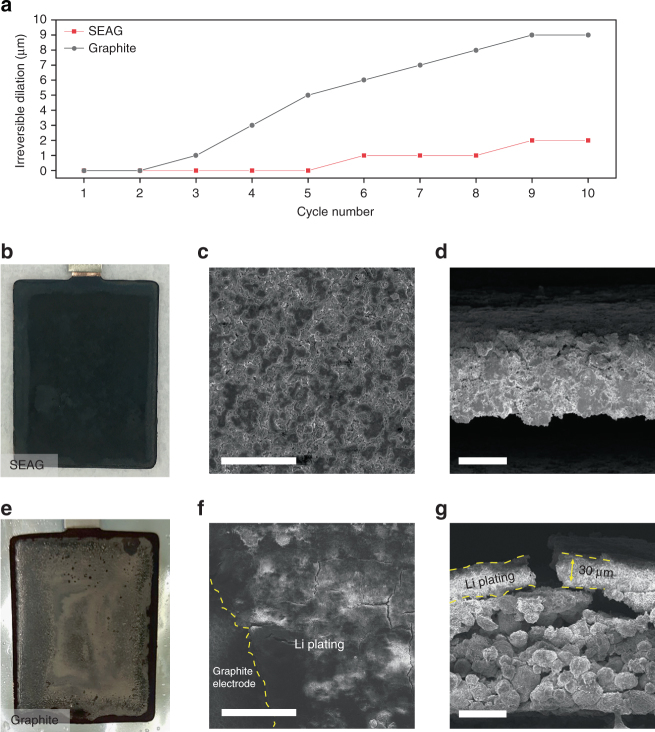
As fast-charging lithium-ion batteries turn into increasingly important components in forthcoming applications, various strategies have been devoted to the development of high-rate anodes. However, despite vigorous efforts, the low initial Coulombic efficiency and poor volumetric energy density with insufficient electrode conditions remain critical challenges that have to be addressed. Herein, we demonstrate a hybrid anode via incorporation of a uniformly implanted amorphous silicon nanolayer and edge-site-activated graphite. This architecture succeeds in improving lithium ion transport and minimizing initial capacity losses even with increase in energy density. As a result, the hybrid anode exhibits an exceptional initial Coulombic efficiency (93.8%) and predominant fast-charging behavior with industrial electrode conditions. As a result, a full-cell demonstrates a higher energy density (≥1060 Wh l −1 ) without any trace of lithium plating at a harsh charging current density (10.2 mA cm −2 ) and 1.5 times faster charging than that of conventional graphite.
Overview
The claims and statistics of this paper haven’t been checked yet.
Run the check — free, no account needed. It reads the open-access text and checks the sources it cites.
Integrity signals
Registry
Cites
Statistics
Figures
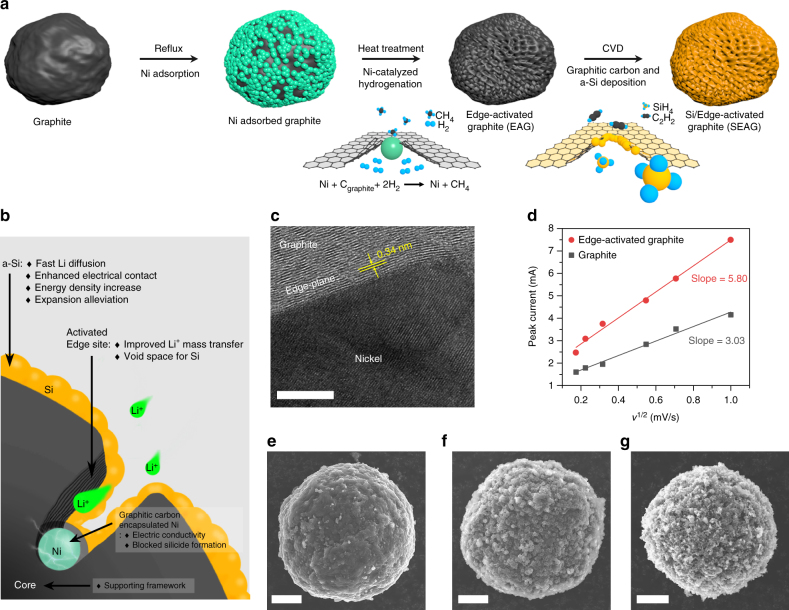
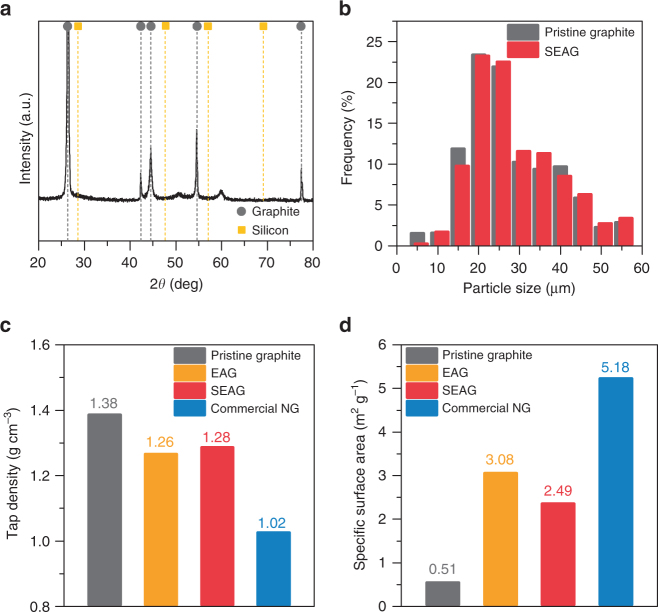
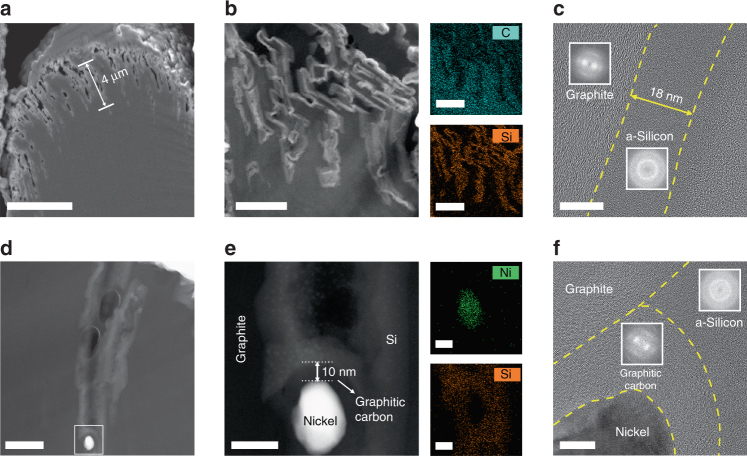
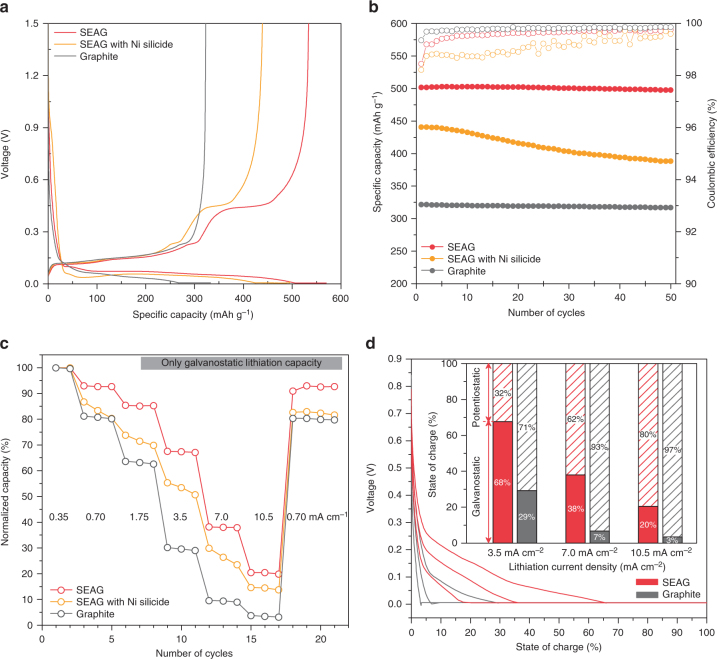
Verification
Claims the paper makes
The claims and statistics of this paper haven’t been checked yet.
Run the check — free, no account needed. It reads the open-access text and checks the sources it cites.
Claims other papers make about this one
Each is checked against this paper’s own text: does it say what the citing paper says it does?
The source backs part of the claim, not all of it — or backs it for a different population, condition or comparison.
In the citing paper
“Typically, surface coating with amorphous silicon nanolayer or doping with nanometal particles can improve initial Coulombic efficiency and Li + diffusion kinetics [168,169].”
From Review on Low-Temperature Electrolytes for Lithium-Ion and Lithium Metal Batteries (2023) · cites this paper as [168]
Experimental — accuracy not yet measured
Self-check
Percentages, sums and reported differences re-computed from the paper’s own numbers.
The self-check needs the paper’s full text.
Citations
Cites
A pomegranate-inspired nanoscale design for large-volume-change lithium battery anodes
Liu, N., Lu, Z., Zhao, J., McDowell, M. T., Lee, H., Zhao, W., & Cui, Y. (2014) · Nature Nanotechnology · doi:10.1038/nnano.2014.6 · Cited by 2,516
Nano- and bulk-silicon-based insertion anodes for lithium-ion secondary cells
Kasavajjula, U. S., Wang, C.-S., & Appleby, A. (2007) · Journal of Power Sources · doi:10.1016/j.jpowsour.2006.09.084 · Cited by 2,400
Alloy Negative Electrodes for Li-Ion Batteries
Obrovac, M. N., & Chevrier, V. L. (2014) · Chemical Reviews · doi:10.1021/cr500207g · Cited by 2,228
A review of the electrochemical performance of alloy anodes for lithium-ion batteries
Zhang, W. (2010) · Journal of Power Sources · doi:10.1016/j.jpowsour.2010.07.020 · Cited by 2,188
Wang, D.-W., Li, F., Liu, M., Lu, G., & Cheng, H.-M. (2008) · Angewandte Chemie · doi:10.1002/anie.200702721 · Cited by 1,999
Li-alloy based anode materials for Li secondary batteries
Park, C., Kim, J., Kim, H., & Sohn, H. (2010) · Chemical Society Reviews · doi:10.1039/b919877f · Cited by 1,721
Silicon‐Based Nanomaterials for Lithium‐Ion Batteries: A Review
Su, X., Wu, Q., Li, J., Xiao, X., Lott, A., Lu, W., Sheldon, B. W., & Wu, J. (2013) · Advanced Energy Materials · doi:10.1002/aenm.201300882 · Cited by 1,612
Aurbach, D., Zinigrad, E., Cohen, Y., & Teller, H. (2002) · Solid State Ionics · doi:10.1016/s0167-2738(02)00080-2 · Cited by 1,365
Temperature dependent ageing mechanisms in Lithium-ion batteries – A Post-Mortem study
Waldmann, T., Wilka, M. D., Kasper, M., Fleischhammer, M., & Wohlfahrt‐Mehrens, M. (2014) · Journal of Power Sources · doi:10.1016/j.jpowsour.2014.03.112 · Cited by 1,269
In Situ TEM of Two-Phase Lithiation of Amorphous Silicon Nanospheres
McDowell, M. T., Lee, S. W., Harris, J. T., Korgel, B. A., Wang, C., Nix, W. D., & Cui, Y. (2013) · Nano Letters · doi:10.1021/nl3044508 · Cited by 881
Research works printed but not linked: 1
- Wu, H. & Cui, Y. Designing nanostructured Si anodes for high energy lithium ion batteries. Nano Today 7, 414–429 (2012). · DOI
Cited by
Sorted by citations
Items 201–300 of 367
Fan, P., Lou, S., Sun, B.-Y., Wu, L., Qian, Z.-Y., Mu, T., Ma, Y.-L., Cheng, X.-Q., Gao, Y.-Z., Zuo, P.-J., et al. (2020) · Electrochimica Acta · doi:10.1016/j.electacta.2019.135507 · Cited by 20
Liu, L.-H., Li, M.-C., Chu, L.-H., Jiang, B., & Lin, R.-X. (2019) · Applications of Surface Science · doi:10.1016/j.apsusc.2019.01.075 · Cited by 20
Mahmood, S. A., Mobarak, N. N., Khudayberdieva, A., Doghmane, M., Chettibi, S., & Eid, K. (2025) · International Journal of Molecular Sciences · doi:10.3390/ijms26167757 · Cited by 19
“C/SiNW/GM showed better performance than the amorphous Si/graphite composite [109], Si/edge-site-activated graphite [110], and Si-embedded graphite/carbon [111] formed by via CVD.”
Face-to-face conducting mechanism enabled by Si-C bonds for binder free Si@CNTs electrode
Zhang, Z.-Y., Sun, Z.-F., Liu, Y., Liu, B., Luo, L., Su, P.-F., Lan, C.-F., Guo, S.-S., Zhang, Z.-Q., Han, X., et al. (2023) · Chemical Engineering Journal · doi:10.1016/j.cej.2023.146504 · Cited by 19
Cell Design for Improving Low-Temperature Performance of Lithium-Ion Batteries for Electric Vehicles
Zhan, J., Deng, Y., Ren, J., Gao, Y., Liu, Y., Rao, S., Li, W., & Gao, Z. (2023) · Batteries · doi:10.3390/batteries9070373 · Cited by 24
“[39] prepared a composite composition of edge-plane-activated graphite and an a-Si nanolayer (SEAG) as a hybrid anode with good low-temperature properties, and its initial coulombic efficiency reached 93.”
BackgroundMethodInfluentialOrdered-Range Tuning of Flash Graphene for Fast-Charging Lithium-Ion Batteries
Yang, H.-Y., Sun, L., Zhai, S.-L., Wang, X., Liu, C.-C., Wu, H., & Deng, W. (2023) · ACS Applied Nano Materials · doi:10.1021/acsanm.2c04717 · Cited by 19
Nitrogen Plasma-Assisted Functionalization of Silicon/Graphite Anodes to Enable Fast Kinetics.
Yeom, S. J., Wi, T.-U., Ko, S.-G., Park, C., Bayramova, K., Jin, S., Lee, S. W., & Lee, H.-W. (2022) · ACS Applied Materials and Interfaces · doi:10.1021/acsami.1c19879 · Cited by 19
Electrode Conditions of Lithium-Ion Cell for Achieving High Energy Density
Lee, C., An, M.-J., Kim, E., An, H., Park, J., Jo, C., & Son, Y. (2024) · Korean Journal of Chemical Engineering · doi:10.1007/s11814-023-00009-w · Cited by 18
Zhao, S., Chen, T.-R., Li, H., Liu, Y.-F., Huang, M., Xu, C., Cui, Y., Li, G., Lian, J.-B., & Wang, Y. (2023) · Chemical Engineering Journal · doi:10.1016/j.cej.2023.145115 · Cited by 18
Vertically-oriented zinc-doped γ-MnO2 nanowalls as high-rate anode materials for li-ion batteries
Wen, Y., Sitindaon, R. S., Lubis, A. L., Yang, Y.-R., Wang, H.-Y., Lin, S.-T., & Lin, K.-J. (2022) · Journal of Energy Storage · doi:10.1016/j.est.2022.105329 · Cited by 18
Paulraj, V., Saha, T., Vediappan, K., & Bharathi, K. (2021) · doi:10.1016/j.matlet.2021.130681 · Cited by 18
Huang, P., Liu, B., Zhang, J., Liu, M., & Xie, Z.-Y. (2021) · Ionics (Kiel) · doi:10.1007/s11581-021-03977-3 · Cited by 18
Liu, N., He, W., Liao, H., Li, Z., Jiang, J., Zhang, X., & Dou, H. (2021) · Journal of Materials Science · doi:10.1007/s10853-020-05658-4 · Cited by 18
Selective removal of nanopores by triphenylphosphine treatment on the natural graphite anode
Kim, J., Park, K., Woo, H., Gil, B., Park, Y., Kim, I., & Park, B. (2019) · doi:10.1016/j.electacta.2019.134993 · Cited by 18
Scalable Fast-Charging Aligned Battery Electrodes Enabled by Bidirectional Freeze-Casting.
Ju, Z.-Y., Zheng, T.-R., Calderon, J., Checko, S., Zhang, B., & Yu, G.-H. (2023) · Nano letters (Print) · doi:10.1021/acs.nanolett.3c03040 · Cited by 17
Anionic Activity in Fast-Charging Batteries: Recent Advances, Prospects, and Challenges
Xu, S., Peng, B., Pang, X., & Huang, F.-Q. (2022) · ACS Materials Letters · doi:10.1021/acsmaterialslett.2c00810 · Cited by 17
Zhang, Y.-G., Du, N., Jiang, J.-W., Chen, Y.-F., Lin, Y.-G., He, Y., Lei, Y., Zhu, S., & Yang, D.-R. (2019) · Journal of Alloys and Compounds · doi:10.1016/j.jallcom.2019.04.082 · Cited by 17
Wang, X., Zhou, J., Wang, H., Zhang, J., Ma, X.-W., Qiu, S.-S., & Chen, L. (n.d.) · Separation and Purification Technology · doi:10.1016/j.seppur.2024.129329 · Cited by 17
Yang, H., Xu, Z.-X., Wang, Y.-Y., Qu, D., Li, W., Chen, J.-Y., Li, Y., Cui, Z., Chen, J.-J., & Liu, D. (2025) · ACS Applied Energy Materials · doi:10.1021/acsaem.5c02856 · Cited by 16
Liu, X.-Q., Shi, Q.-T., Wang, J.-Q., Zhang, J., Zhang, C., Wang, Z.-P., Li, L.-W., Bachmatiuk, A., Shen, Y.-B., Yang, R.-Z., et al. (2025) · Small · doi:10.1002/smll.202504255 · Cited by 16
Yi, M., Cui, Z.-H., & Manthiram, A. (2024) · ACS Applied Materials and Interfaces · doi:10.1021/acsami.4c08929 · Cited by 16
Self-healing polymer binders for the Si and Si/carbon anodes of lithium-ion batteries
Wu, S., Di, F., Zheng, J.-G., Zhao, H.-W., Zhang, H., Li, L.-X., Geng, X., Sun, C., Yang, H.-M., Zhou, W.-M., et al. (2022) · New Carbon Materials · doi:10.1016/s1872-5805(22)60638-3 · Cited by 16
Metal nano-drills directionally regulate pore structure in carbon
Yang, C.-S., Sun, Z.-Z., Cui, C.-H., Yang, C., & Zhang, T. (2021) · doi:10.1016/j.carbon.2020.12.065 · Cited by 16
Graphit‐ und‐Silicium‐Anoden für Lithiumionen‐ Hochenergiebatterien
Chae, S., Choi, S.-W., Kim, N., Sung, J., & Cho, J. (2019) · Angewandte Chemie · doi:10.1002/ange.201902085 · Cited by 16
Self-citationBinder-free SnO2–TiO2 composite anode with high durability for lithium-ion batteries
Yoo, H., Lee, G., & Choi, J. (2019) · RSC Advances · doi:10.1039/c8ra10358e · Cited by 16
Sahu, A., Kumar, A., Dashairya, L., Saha, P., Bhuyan, S., Sen, S., & Mishra, S. (2023) · Diamond and related materials · doi:10.1016/j.diamond.2023.110053 · Cited by 15
Liu, B., Huang, P., Zhang, Q., Huang, Q., & Xie, Z.-Y. (2020) · Journal of Materials Science · doi:10.1007/s10853-020-04869-z · Cited by 15
Wang, F., Lu, A., Liu, Z., Zhang, W.-D., Gao, Y.-L., Zhao, Q., Sun, J.-G., Zhang, C.-Z., Liu, Q., Liu, H., et al. (2025) · Advances in Materials · doi:10.1002/adma.202509207 · Cited by 14
Wang, J., Gao, Y., He, Z., Feng, X., Lin, D., Kong, D., Zhang, X.-H., Hu, H., Guo, Z.-P., & Chen, D. (2024) · Journal of Power Sources · doi:10.1016/j.jpowsour.2024.235238 · Cited by 14
Ma, J., Zhang, H.-M., Yu, X., Xiang, Y., Qiu, J., Liu, S., Lin, H., Cao, G.-P., & Zhang, W.-F. (2023) · Energy Storage Materials · doi:10.1016/j.ensm.2023.102979 · Cited by 14
Self-citationScalable synthesis of silicon nanoplate-decorated graphite for advanced lithium-ion battery anodes
Li, H., Li, X., Wang, D., Zhang, S., Xu, W., Zhu, L., & Zhi, L. (2020) · Nanoscale · doi:10.1039/d0nr07216h · Cited by 23
GeTe-TiC-C Composite Anodes for Li-Ion Storage
Kim, W. S., Vo, T. N., & Kim, I. T. (2020) · Materials · doi:10.3390/ma13194222 · Cited by 18
Porous silicon layer overlaid graphite anode materials for fast-charging of lithium-ion batteries
Ma, D., Kim, D. H., Yu, M., Cho, Y. E., & Kim, H. (2025) · Journal of Power Sources · doi:10.1016/j.jpowsour.2025.237199 · Cited by 13
Han, Y., Chandio, Z. A., Soni, H. L., Francesco Ciucci, A., & Cheong, J. Y. (2025) · Journal of Energy Storage · doi:10.1016/j.est.2025.116981 · Cited by 13
“These deposits interact with the electrolyte, increasing internal resistance and decreasing the battery's energy density [102,103].”
Recent Strategies for Stabilizing Interfaces in All-solid-state Lithium Metal Batteries
Seol, Y.-J., & Kim, N. (2025) · Korean Journal of Chemical Engineering · doi:10.1007/s11814-025-00392-6 · Cited by 13
Self-citation12‐Ah‐Level Li‐Ion Pouch Cells Enabling Fast Charging at Temperatures between −20 and 50 °C
Wang, L., Yu, F.-D., Que, L., Zhang, X.-G., & Xie, K. (2024) · Advanced Functional Materials · doi:10.1002/adfm.202408422 · Cited by 13
Homogeneously dispersed silicon/graphite composite toward enhanced lithium-ion batteries
Li, Z.-J., Shi, C., Liu, P., Di, Y.-B., Zhang, D., Wang, Q.-J., Sun, H.-L., Sun, Q.-J., & Wang, B. (2024) · Journal of Energy Storage · doi:10.1016/j.est.2024.111673 · Cited by 13
Gong, K., Huang, C., Xu, X., Yao, Y., Chen, D.-S., Tong, Y., & Lei, P. (2024) · Chemical Engineering Journal · doi:10.1016/j.cej.2024.151632 · Cited by 13
Wang, X., Cheng, W., Hu, J., Su, Y., Kong, X.-G., Uemura, S., Kusunose, T., & Feng, Q. (2021) · ACS Applied Energy Materials · doi:10.1021/acsaem.1c02337 · Cited by 13
Mo, R., Rooney, D., & Sun, K.-N. (2020) · doi:10.1016/j.ensm.2020.04.031 · Cited by 13
Silicon Nanoparticles Preparation by Induction Plasma Technology for Li-ion Batteries Anode Material
Liu, W.-P., Xu, H.-R., Qin, H.-Q., Lv, Y., Zhu, G.-S., Lin, F., Lei, X.-X., Zhang, Z., & Wang, L.-H. (2019) · Silicon · doi:10.1007/s12633-019-00320-4 · Cited by 13
“This phenomenon is mainly due to the unstable SEI films, the pulverization of active material particles, the destruction of electrode structure and silicon nanoparticles gradually splits away from graphite carrier [41, 42].”
BackgroundHou, X.-Y., Dang, H.-G., Liu, M., Shang, X., Fu, Y.-J., & He, D.-Y. (2019) · Journal of Alloys and Compounds · doi:10.1016/j.jallcom.2019.151736 · Cited by 13
Nondestructive Electrochemical Identification of Lithium Plating in High-Energy Automotive Batteries
Abbas, S. M., Driessen, C., Sprenger, M., Ellersdorfer, C., Hanzu, I., & Gstrein, G. (2025) · ACS Omega · doi:10.1021/acsomega.4c10805 · Cited by 12
Hu, Z., Che, L., Lin, Z., Shen, C., Huang, H., Li, N., Jin, T., & Xie, K.-Y. (2025) · Nano Energy · doi:10.1016/j.nanoen.2025.110769 · Cited by 12
Tuning Proton Insertion Chemistry for Sustainable Aqueous Zinc-Ion Batteries.
Nam, G., Hwang, C., Jang, H., Kane, N., Ahn, Y., Kwak, M.-J., Luo, Z.-Y., Li, T.-T., Kim, M.-G., Liu, N., et al. (2023) · Small · doi:10.1002/smll.202306919 · Cited by 12
Lee, Y. A., Jang, K., Yoo, J., Yim, K., Jung, W., Jung, K.-N., Yoo, C.-Y., Cho, Y., Lee, J.-H., Ryu, M., et al. (2023) · Materials · doi:10.3390/ma16114016 · Cited by 12
Wu, P., Jia, Z., Liu, C., Guo, C.-Q., Xu, B., Liu, A.-H., & Li, L. (2023) · ACS Applied Nano Materials · doi:10.1021/acsanm.3c00942 · Cited by 12
Lipton, J., Ma, Y.-Y., Rohr, J. A., Zhu, J., Wang, H., Maclean, S. A., Johnson, C. S., & Taylor, A. D. (2022) · Cell Reports Physical Science · doi:10.1016/j.xcrp.2022.101051 · Cited by 12
Flexible Porous Silicon/Carbon Fiber Anode for High−Performance Lithium−Ion Batteries
Liu, G., Zhu, X.-Y., Li, X., Jia, D., Li, D., Ma, Z.-L., & Li, J.-J. (2022) · Materials · doi:10.3390/ma15093190 · Cited by 12
“However, the volume change (~400%) during the process of lithiation/delithiation [4] and the low electrical conductivity severely limit its commercial development.”
BackgroundLiu, B., Huang, P., Liu, M., & Xie, Z.-Y. (2021) · Journal of Materials Science · doi:10.1007/s10853-021-06369-0 · Cited by 12
Lee, Y., Lee, M.-W., Lee, G., Eom, K., Lee, M.-H., Lee, S.-H., & Joh, H.-I. (2020) · Applied Surface Science · doi:10.1016/j.apsusc.2020.145352 · Cited by 12
A perspective on R&D status of energy storage systems in South Korea
Sasikala, S. P., Jeong, G., Yun, T., & Kim, S. O. (2019) · doi:10.1016/j.ensm.2019.05.017 · Cited by 12
Cardenas, A., Beaudhuin, M., Nguyen, L. H., Herlin-Boime, N., Haon, C., & Monconduit, L. (2025) · Energy Storage Materials · doi:10.1016/j.ensm.2025.104086 · Cited by 11
Hiwase, S., Kumar, N., & Furquan, M. (2024) · Chemical Engineering Journal · doi:10.1016/j.cej.2024.155085 · Cited by 11
Copper Nitrate Enables High-performance Lithium-ion Batteries at Low Temperature
Lin, Y.-T., Su, F., Jiang, J., You, H.-P., Yao, M., Lian, C., Chen, L., Liu, H.-L., & Li, C.-Z. (2024) · Energy Storage Materials · doi:10.1016/j.ensm.2024.103484 · Cited by 11
Keller, C., Karuppiah, S., Raaen, M., Wang, J.-X., Perrenot, P., Aldakov, D., Reiss, P., Haon, C., & Chenevier, P. (2023) · ACS Applied Energy Materials · doi:10.1021/acsaem.3c00178 · Cited by 11
Chen, H.-D., Hu, W., Wang, D., Dong, M., Qiu, Y.-C., Liu, L., Qin, H.-Q., Wang, S., Songsiriritthigul, P., Chen, F.-M., et al. (2023) · Surfaces and Interfaces · doi:10.1016/j.surfin.2023.102958 · Cited by 11
Koo, J., Choi, H., Seo, J., Hwang, S., Lee, J., & Kim, Y.-J. (2022) · Ceramics International · doi:10.1016/j.ceramint.2022.07.119 · Cited by 11
Sanad, M., & Shenouda, A. (2021) · Journal of Materials Science: Materials in Electronics · doi:10.1007/s10854-021-06558-2 · Cited by 11
Huang, X., Guo, X.-Y., Ding, Y., Wei, R., Mao, S., Zhu, Y., & Bao, Z.-H. (2020) · doi:10.1016/j.cclet.2020.11.041 · Cited by 11
Cha, H., Kang, M.-S., Oh, S. H., Ha, J., Joo, J., Kwon, D. H., Kwak, S. K., Ahn, S., & Kang, S. J. (2025) · Advanced Functional Materials · doi:10.1002/adfm.202514795 · Cited by 10
Silicon-based anodes for solid-state batteries: challenges, opportunities, and multiscale strategies
Zhang, Z.-J., Xue, X.-Y., Mo, Z.-X., Lei, X.-X., Xie, X.-R., Qin, H.-Q., Wu, Y.-L., Jiang, H.-W., & Tang, H.-P. (2025) · RSC Advances · doi:10.1039/d5ra05126f · Cited by 10
A hierarchical carbon framework-derived Si/C composite for advanced lithium-ion batteries
Yang, L., Song, R.-F., Lv, D., Ding, M., Zhang, S., Liu, J., Hu, W.-B., & Zhong, C. (2025) · Materials Today Chemistry · doi:10.1016/j.mtchem.2025.102989 · Cited by 10
Liu, C., Zhou, H.-P., Zhou, H., Yang, B., Li, Z. K., Zhang, S., Feng, T. T., Xu, Z.-Q., Fang, Z., & Wu, M.-Q. (2025) · Journal of Energy Storage · doi:10.1016/j.est.2025.116083 · Cited by 10
Kim, E., An, H., Kang, I., Lee, C., An, M.-J., Chae, S., & Son, Y. (2025) · Journal of Power Sources · doi:10.1016/j.jpowsour.2025.236314 · Cited by 10
Self-citationResearch Progresses on Nano-Structured Silicon-Based Materials as Anode for Lithium-Ion Batteries
Chen, X., Cheng, W.-D., Liu, H.-Y., Chen, H.-Q., Ma, J.-H., Zhang, Y., Wu, Z.-J., Wang, C.-H., You, Y., Xing, X.-Q., et al. (2025) · Materials · doi:10.3390/ma18040830 · Cited by 10
“The reasonable combination of graphite and silicon materials can give full play to the advantages of both, and at the same time, it is necessary to avoid the adverse effects of their respective shortcomings, which puts forward the requirements for reasonable structural design.”
Self-citationAlgae‐Derived Precursors for Sustainable Electrochemical Energy Storage
Dongre, M., Varma, P., Parthasarathy, A., & Kandasubramanian, B. (2024) · Energy Technology · doi:10.1002/ente.202401465 · Cited by 10
Park, S. J., Hong, M., Ye, J.-H., Choi, J.-I., & Kim, K. J. (2024) · Science and Technology of Advanced Materials · doi:10.1080/14686996.2024.2327274 · Cited by 10
“To achieve this, Ni metal nanoparticles were initially precipitated onto the surface of the CF electrode, followed by etching the precipitated Ni nanoparticles on the CF electrode using sulfuric acid [32,33].”
MethodSuh, J. H., Choi, I., Park, S., Kim, D. K., Kim, Y., & Park, M.-S. (2024) · ACS Applied Materials and Interfaces · doi:10.1021/acsami.3c17816 · Cited by 10
New Emerging Fast Charging Microscale Electrode Materials
Wang, L., Zhong, Y., Wang, H., Malyi, O. I., Wang, F., Zhang, Y., Hong, G., & Tang, Y. (2023) · Small · doi:10.1002/smll.202307027 · Cited by 11
Yeo, T., Seo, B., Lee, J., Park, S., Kim, K., & Choi, W. (2021) · Nano Energy · doi:10.1016/j.nanoen.2021.106663 · Cited by 10
Wu, M.-M., Liu, C., Sun, R., Yu, T., Li, Y.-H., & Yang, G. (2020) · International Journal of Energy Research · doi:10.1002/er.5241 · Cited by 10
Kong, X.-G., Xing, W., Ma, D., Huang, J.-F., Li, J., Zhao, T., Yin, L.-X., & Feng, Q. (2018) · doi:10.1039/c8ce01303a · Cited by 10
Mitigating the Fast-Charging Limitations of Graphite Anodes via g-C3N4 Surface Engineering
Suh, J. H., Shin, H. R., Kim, T., Kim, D. K., Kim, K. J., Lee, J.-W., & Park, M. (2025) · Energy Storage Materials · doi:10.1016/j.ensm.2025.104596 · Cited by 9
3D Pathways Enabling Highly-Efficient Lithium Reservoir for Fast-Charging Batteries.
Han, S. A., Suh, J. H., Kim, J., Park, S., Jeong, W. U., Shimada, Y., Kim, J. H., Park, M.-S., & Dou, S. X. (2024) · Small · doi:10.1002/smll.202310201 · Cited by 9
Yu, Y.-K., Levine, M., Yang, Z.-Z., Jeon, S., Stach, E. A., & Xie, J. (2023) · ACS Applied Energy Materials · doi:10.1021/acsaem.3c02203 · Cited by 9
Chu, Z.-J., Zhao, X., Wang, Q., Bao, T., Li, H.-X., Cao, Y., Zhang, B., Cao, J., & Si, W.-M. (2023) · Crystals · doi:10.3390/cryst13030547 · Cited by 9
Lou, Y., Rao, X.-F., Zhao, J.-J., Chen, J., Li, B., Kuang, L., Wang, Q., Zhong, S.-W., Wang, H., & Wu, L.-J. (2021) · New Journal of Chemistry · doi:10.1039/d1nj02986j · Cited by 9
Hou, X., Cong, J., Gong, S., Li, Z., Shao, Y., He, A., Fan, Y., & Huang, Y. (2025) · Journal of Materials Chemistry A · doi:10.1039/d5ta00745c · Cited by 16
Silicon-based nanomaterials for energy storage
Ibraheem, S., Yasin, G., Iqbal, R., Saleem, A., Nguyen, T., & Ibrahim, S. (2022) · Silicon-Based Hybrid Nanoparticles · doi:10.1016/b978-0-12-824007-6.00002-2 · Cited by 9
Lv, D., Dong, Z.-Q., Wei, L., Ding, M., Zhao, N., Luan, J.-Y., Hu, W.-B., & Zhong, C. (2026) · ACS Sustainable Chemistry & Engineering · doi:10.1021/acssuschemeng.6c00747 · Cited by 8
Zhang, R., Zhu, L., Yu, Y., Chen, J., Liu, P., Lu, C., Zhang, Y.-M., Meng, Z., Hu, Y., Ji, Y., et al. (2025) · Rare Metals · doi:10.1007/s12598-025-03598-z · Cited by 8
A stable fast-charging TiNb2O7 anode material enabled by strong Ta-O bonds
Dong, F., Liu, Z., Jiang, Y., Liang, Z., Chu, X., Ma, C.-H., Sun, H., & Xie, H. (2025) · Rare Metals · doi:10.1007/s12598-025-03559-6 · Cited by 8
“Pursuing fast-charging LIBs has long been a hot topic [6], which can dramatically shorten the charging time and thus alleviate the charge anxiety of electric vehicles [7].”
Wang, B., Teng, X., Li, X., Fielding, A. J., Wang, W., Liu, H., Zhao, Z.-Q., Li, Y.-Q., Iamprasertkun, P., Yang, L.-J., et al. (2024) · Advanced Functional Materials · doi:10.1002/adfm.202407494 · Cited by 8
Singh, C. B., Bhattacharya, S., Prayogi, S., Patel, U., Bhargav, P. B., & Ahmed, N. (2024) · Optical materials (Amsterdam) · doi:10.1016/j.optmat.2024.115809 · Cited by 8
Design Considerations for Fast Charging Lithium Ion Cells for NMC/MCMB Electrode Pairs
Yourey, W., Fu, Y., Li, N., Battaglia, V., & Tong, W. (2021) · Batteries · doi:10.3390/batteries7010004 · Cited by 8
Determining Accelerated Charging Procedure from Half Cell Characterization
Yourey, W., Fu, Y., Li, N., Battaglia, V., & Tong, W. (2019) · Journal of the Electrochemical Society · doi:10.1149/2.0591908jes · Cited by 8
Qiu, S., Ji, K., Zhang, Y., Han, J., Xia, X., Zhang, J.-B., & Chen, M. (2026) · ACS Applied Materials and Interfaces · doi:10.1021/acsami.5c17133 · Cited by 7
Defect-tailored graphite recovery from spent LIBs using natural deep eutectic solvents
Wang, X., Wang, Q., Wang, H., Liu, J., Zhou, J., & Wang, W. (2025) · Materials Futures · doi:10.1088/2752-5724/ae17dd · Cited by 7
“…diffusion coefficient ( D Li + ) was evaluated according to the Randles–Sevcik equation (equation (1)) using CV plots with varying scanning speeds [35], comparing it with BG-4, as depicted in figures 5(a) and (b), where I p stands for the peak current in the CV profile, n represents the number of…”
Integrated Helical Fiber Electrode for Stable Ah-Level Fast-Charging Fiber Lithium-Ion Batteries.
Chang, Y.-F., Jiang, H.-B., Zhang, Y.-C., Sun, S.-Q., Gong, X.-C., Lu, C.-H., Zhao, C., Zhang, S.-L., Chen, P.-N., Peng, H.-S., et al. (2025) · Small · doi:10.1002/smll.202506922 · Cited by 7
High Areal Loading Silicon Nanoparticle-Based Lithium-Ion Batteries.
Thapa, A., & Gao, H. (2025) · ACS Applied Materials and Interfaces · doi:10.1021/acsami.4c17483 · Cited by 7
Park, S., Choi, M., Lee, J., Lee, S., Kim, J., Yun, T., Kim, N., Sung, J., Cho, J., Ko, M., et al. (2024) · Small · doi:10.1002/smll.202404949 · Cited by 7
Self-citationEdge Defect Protection of Graphitic Carbon Nanocages for Stable Potassium Storage at Low Voltage
Qiu, X., Shi, L.-L., Xu, Z., Qian, J., Song, M., Sun, L., Xu, X., Xu, Y., Fu, Y., Ren, J.-Z., et al. (2023) · Journal of Alloys and Compounds · doi:10.1016/j.jallcom.2023.172539 · Cited by 7
Kim, H.-E., Jang, S., Lim, H., Chung, W., Nam, I., & Jin, H.-B. (2023) · Applications of Surface Science · doi:10.1016/j.apsusc.2023.157161 · Cited by 7
Zhang, J., Liu, B., Zhang, R., Huang, P., Liu, M., & Xie, Z.-Y. (2021) · Ionics (Kiel) · doi:10.1007/s11581-021-04380-8 · Cited by 7
“75 mA cm−1, 500 mA h g−1 after 50 cycles [41]”
Liu, J., Ben, M., Liu, A., Liu, J.-W., Wang, S.-Q., & Zhang, J.-J. (2021) · doi:10.1016/j.cclet.2021.02.051 · Cited by 7
Kong, J.-H., & Wei, Y.-F. (2019) · Journal of the Electrochemical Society · doi:10.1149/2.1021910jes · Cited by 7
Recent Progress of Materials Design and Engineering of Aqueous Metal-Air Batteries
Park, J., & Son, Y. (2025) · Korean Journal of Chemical Engineering · doi:10.1007/s11814-025-00456-7 · Cited by 6
Farmakis, F., de Meatza, I., Subburaj, T., Tsiplakides, D., Argyropoulos, D., Balomenou, S., Landa-Medrano, I., Eguía-Barrio, A., Strataki, N., & Nestoridi, M. (2021) · Journal of Energy Storage · doi:10.1016/j.est.2021.102989 · Cited by 6
Yan, Y.-C., Wei, L., Su, X., Deng, S., Feng, J.-Z., Yang, J., Chi, M., Lei, H., Li, Z.-T., & Wu, M.-B. (2020) · doi:10.1002/cnma.201900642 · Cited by 6
Metadata
- Authors
- Kim, N., Chae, S., Ma, J., Ko, M., & Cho, J.
- Affiliations
- Ulsan National Institute of Science and Technology (KR)
- Corresponding author
- Ko, Minseong
- Cho, Jaephil
- Venue
- Nature Communications
- Published
- 2017-10-09
- Volume
- 8
- Issue
- 1
- Pages
- 812-812
- ISSN
- 2041-1723 (ISSN-L)
- PMC
- PMC5634447
- OpenAlex
- W2764301473
- Cited by
- 434
- References
- 54
- Citations by year
- 2026: 34 · 2025: 66 · 2024: 67 · 2023: 51 · 2022: 57 · 2021: 47 · 2020: 44 · 2019: 46 · 2018: 22
- FWCI
- 12.73
- Type
- journal article
- Language
- en
- Open access
- gold
- doi.org
- Locations
- Nature Communications (publishedVersion, cc-by)
- Europe PMC (PubMed Central) (publishedVersion, cc-by)
- PubMed Central (publishedVersion, cc-by)
- PubMed (publishedVersion)
- RePEc: Research Papers in Economics (submittedVersion)
- DOAJ (DOAJ: Directory of Open Access Journals) (submittedVersion)
- DOAJ (DOAJ: Directory of Open Access Journals) (submittedVersion, cc-by-sa)
- Scholarworks@UNIST (Ulsan National Institute of Science and Technology) (submittedVersion)
- Funders
- Samsung
- Topics
- Physical Sciences › Engineering › Electrical and Electronic Engineering › Advancements in Battery Materials
- Physical Sciences › Engineering › Automotive Engineering › Battery Modeling and Management
- Physical Sciences › Engineering › Electrical and Electronic Engineering › Advanced Battery Materials and Technologies
- Keywords
- lithium-ion batteries, fast charging, graphite anode, hybrid anode, Coulombic efficiency, lithium plating, energy density, lithium ion transport
About these checks
Registry, retraction, Cites and statistics results are computed, not judged, with one exception: a printed reference that no index lists is read once by a model before it counts as a citation error. Claims are extracted by a model and kept only when their quote appears verbatim in the text; each cited source is then checked, with a model’s help, for whether it says what the claim relies on. Those verdicts can be wrong — read the claim’s quote and the cited source before relying on one.
Statistics and arithmetic are recomputed, not judged.
Confidence bands are shown only for fields calibrated on our annotated test set. None is calibrated yet, so no band is shown.
What counts as a claim ›How we measure confidence ›How we check this ›
Are you an author, or do you see a problem with this page? Request a review
