

The DOI matches its Crossref record; 67 of the 69 references it cites were found in a registry or an index, and 1 are not checked yet.
Causal associations between risk factors and common diseases inferred from GWAS summary data
Open accessPublished version of a preprint
Abstract
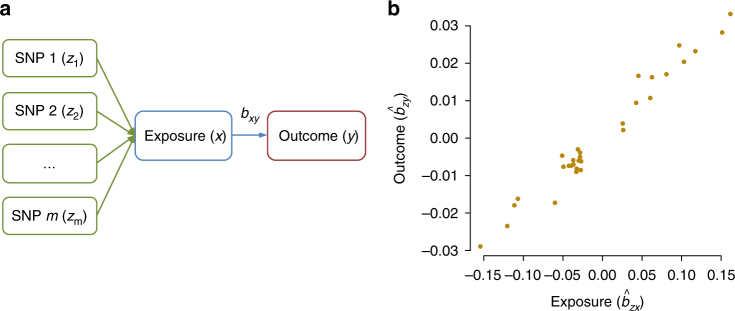
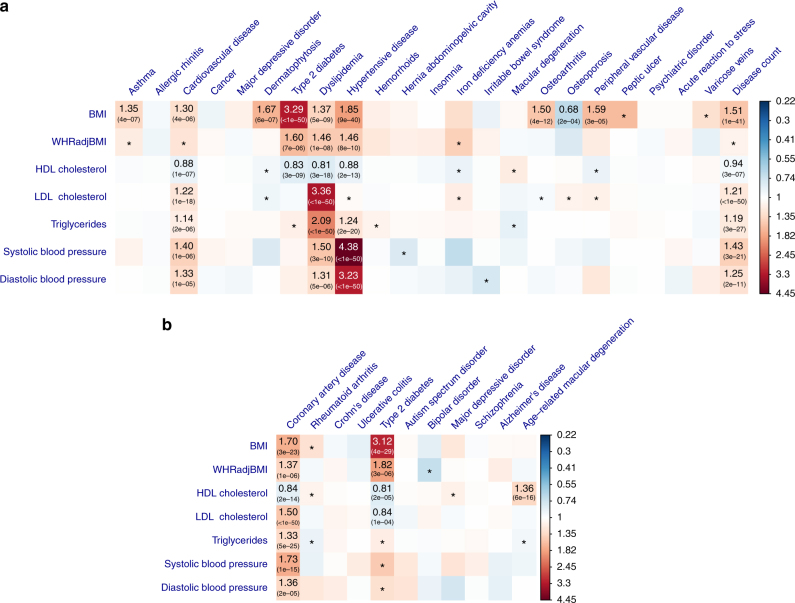
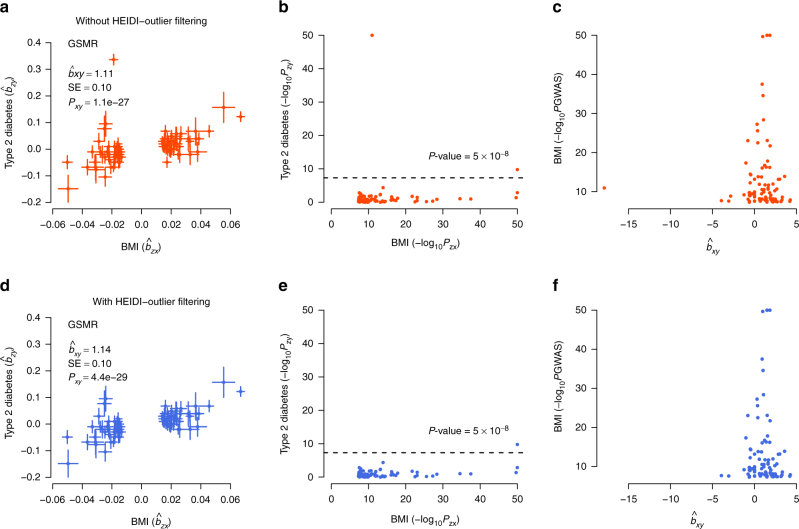
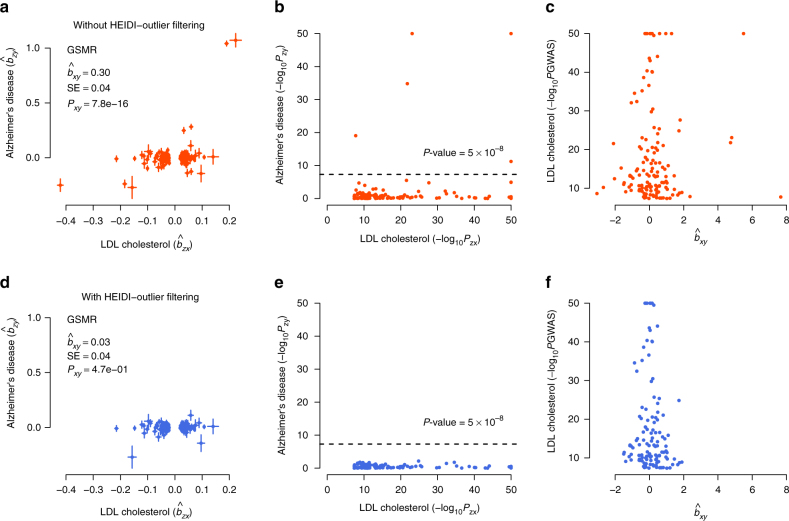
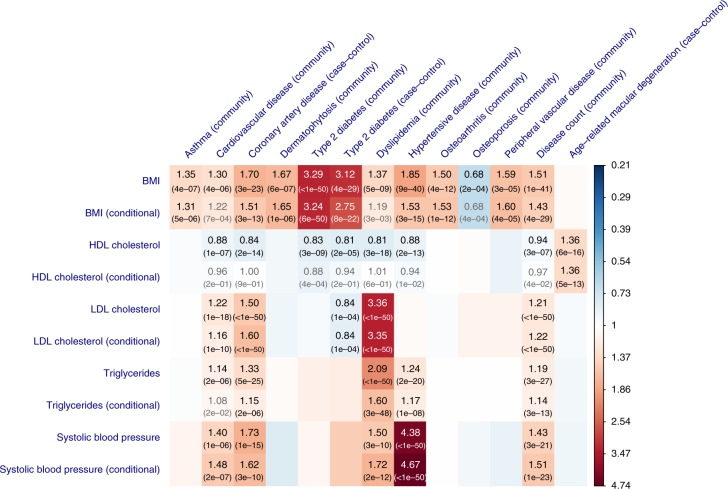
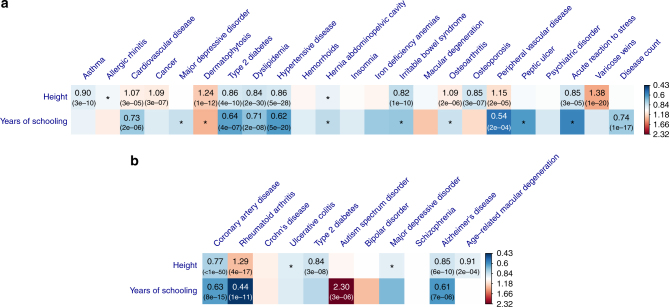
Health risk factors such as body mass index (BMI) and serum cholesterol are associated with many common diseases. It often remains unclear whether the risk factors are cause or consequence of disease, or whether the associations are the result of confounding. We develop and apply a method (called GSMR) that performs a multi-SNP Mendelian randomization analysis using summary-level data from genome-wide association studies to test the causal associations of BMI, waist-to-hip ratio, serum cholesterols, blood pressures, height, and years of schooling (EduYears) with common diseases (sample sizes of up to 405,072). We identify a number of causal associations including a protective effect of LDL-cholesterol against type-2 diabetes (T2D) that might explain the side effects of statins on T2D, a protective effect of EduYears against Alzheimer’s disease, and bidirectional associations with opposite effects (e.g., higher BMI increases the risk of T2D but the effect of T2D on BMI is negative).
Overview
The claims and statistics of this paper haven’t been checked yet.
Run the check — free, no account needed. It reads the open-access text and checks the sources it cites.
Integrity signals
Registry
Cites
Statistics
Figures
Verification
Claims the paper makes
The claims and statistics of this paper haven’t been checked yet.
Run the check — free, no account needed. It reads the open-access text and checks the sources it cites.
Claims other papers make about this one
Each is checked against this paper’s own text: does it say what the citing paper says it does?
The source backs part of the claim, not all of it — or backs it for a different population, condition or comparison.
In the citing paper
“This method can help differentiate the likely causal direction of association between two traits but cannot make any statement about the intermediate mechanisms involved in any potential causal process.”
From Genome-wide association meta-analysis in 269,867 individuals identifies new genetic and functional links to intelligence (2018) · cites this paper as [29]
Experimental — accuracy not yet measuredThe cited source says what the claim attributes to it.
In the citing paper
“The estimated causal effect coefficients (b xy ) are approximately equal to the natural log odds ratio (OR) for a case-control trait 29 .”
From Genome-wide association meta-analysis in 269,867 individuals identifies new genetic and functional links to intelligence (2018) · cites this paper as [29]
Self-check
Percentages, sums and reported differences re-computed from the paper’s own numbers.
The self-check needs the paper’s full text.
Citations
Cites
Introductory Econometrics: A Modern Approach
Wooldridge, J. M. (1999) · Cited by 14,354
Sudlow, C., Gallacher, J., Allen, N., Beral, V., Burton, P., Danesh, J., Downey, P., Elliott, P., Green, J., Landray, M., et al. (2015) · PLOS Medicine · doi:10.1371/journal.pmed.1001779 · Cited by 12,728
Second-generation PLINK: rising to the challenge of larger and richer datasets
Chang, C. C., Chow, C. C., Tellier, L. C., Vattikuti, S., Purcell, S. M., & Lee, J. J. (2015) · Gigascience · doi:10.1186/s13742-015-0047-8 · Cited by 12,709
Bowden, J., Davey Smith, G., & Burgess, S. (2015) · International Journal of Epidemiology · doi:10.1093/ije/dyv080 · Cited by 9,816
GCTA: a tool for genome-wide complex trait analysis
Yang, J., Lee, S. H., Goddard, M. E., & Visscher, P. M. (2011) · The American Journal of Human Genetics · doi:10.1016/j.ajhg.2010.11.011 · Cited by 8,279
Self-citationA map of human genome variation from population-scale sequencing.
The 1000 Genomes Project Consortium (2010) · Nature · doi:10.1038/nature09534 · Cited by 7,877
Mendelian Randomization Analysis With Multiple Genetic Variants Using Summarized Data
Burgess, S., Butterworth, A., & Thompson, S. G. (2013) · Genetic Epidemiology · doi:10.1002/gepi.21758 · Cited by 6,050
Davey Smith, G., & Ebrahim, S. (2003) · International Journal of Epidemiology · doi:10.1093/ije/dyg070 · Cited by 5,882
LD Score regression distinguishes confounding from polygenicity in genome-wide association studies
Schizophrenia Working Group of the Psychiatric Genomics Consortium, Bulik-Sullivan, B. K., Loh, P.-R., Finucane, H. K., Ripke, S., Yang, J., Patterson, N., Daly, M. J., Price, A. L., & Neale, B. M. (2015) · Nature Genetics · doi:10.1038/ng.3211 · Cited by 5,559
Self-citation
Cited by
Sorted by citations
Items 601–700 of 959
Adlam, D., Berrandou, T.-E., Georges, A. B., Nelson, C. P., Giannoulatou, E., Henry, J., Ma, L., Blencowe, M., Turley, T. N., Yang, M., et al. (2022) · medRxiv · doi:10.1101/2022.07.05.22277238 · Cited by 5
Lu, H., Chou, C.-H., Lin, Y.-J., Uchiyama, S., Terao, C. C., Wang, Y., Yang, J., Liu, T., Wong, H. S.-C., Chen, S. C.-C., et al. (2023) · doi:10.22541/au.169145877.79923926/v1 · Cited by 5
Self-citationQi, M., Zhang, H., Xiu, X., He, D., Cooper, D. N., Yang, Y., & Zhao, H. (2024) · Human Genetics · doi:10.1007/s00439-024-02661-6 · Cited by 4
Review: Recent advances in unraveling the genetic architecture of kernel row number in maize
Wang, Y., Shaw, R. K., & Fan, X. (2024) · Plant Science · doi:10.1016/j.plantsci.2024.112366 · Cited by 4
Norton, S. A., Gorelik, A. J., Paul, S. E., Johnson, E. C., Baranger, D. A. A., Siudzinski, J. L., Li, Z. A., Bondy, E., Modi, H., Karcher, N. R., et al. (2024) · Brain Behavior and Immunity · doi:10.1016/j.bbi.2025.04.012 · Cited by 4
Davis, C. N., Khan, Y., Toikumo, S., Jinwala, Z., Boomsma, D. I., Levey, D. F., Gelernter, J. E., Kember, R. L., & Kranzler, H. R. (2025) · Psychological Medicine · doi:10.1017/s0033291725000819 · Cited by 4
Genetic characterization of preschool wheeze phenotypes
Fischer‐Rasmussen, K., Granell, R., Eliasen, A. U., KREINER, E. B., Pedersen, C. T., Luo, Y., Chawes, B., Stokholm, J., Schoos, A. M., Kumar, A., et al. (2025) · Journal of Allergy and Clinical Immunology · doi:10.1016/j.jaci.2025.07.015 · Cited by 4
Genome-wide association study of susceptibility to acute respiratory distress syndrome
Guillén‐Guío, B., Suarez-Pajes, E., Tosco-Herrera, E., Hernández-Beeftink, T., Lorenzo-Salazar, J. M., Chang, D., González‐Montelongo, R., Rubio‐Rodríguez, L. A., Leavy, O. C., Allen, R. J., et al. (2025) · EBioMedicine · doi:10.1016/j.ebiom.2025.105951 · Cited by 4
Liu, T., Yao, Y., Hu, Y., Sun, L., & Zhang, G. (2025) · European Journal of Pharmacology · doi:10.1016/j.ejphar.2025.178335 · Cited by 4
Integrating Multi-Omics Summary Data Identifies Candidate Molecular Mechanisms for Major Depression
Nisbet, L., Wu, Y., Adams, M. J., Lynall, M.-E., Hjerling‐Leffler, J., Wray, N. R., McIntosh, A. M., & Shen, X. (2025) · Biological Psychiatry · doi:10.1016/j.biopsych.2025.11.024 · Cited by 4
Self-citationTaylor‐Bateman, V., Bothongo, P. L., Walker, V. M., Kehoe, P. G., Nordestgaard, L. T., Ben‐Shlomo, Y., Davies, N. M., Williams, D. M., & Anderson, E. L. (2026) · Nature Aging · doi:10.1038/s43587-026-01106-1 · Cited by 6
An Energy Autonomous Microneedle Array‐Based Sensing System for Continuous Biomarker Monitoring
Pal, A., Fan, K., Hung, S.-C., Chowdhury, J. R., Chung, J., Ray, M., Hsu, H.-Y., Kao, F., Liu, K.-L., & Lin, Z. (2026) · Advanced Science · doi:10.1002/advs.75789 · Cited by 4
Skelton, M., Mitchell, B. L., Assary, E., Li, D., Morneau‐Vaillancourt, G., Murphy, A. E., ter Kuile, A., Wang, R., Adams, M. J., Byrne, E. M., et al. (2026) · Nature Human Behaviour · doi:10.1038/s41562-026-02476-7 · Cited by 4
Al‐Soufi, L., & Costas, J. (2023) · Psychological Medicine · doi:10.1017/s0033291723000326 · Cited by 4
Wang, F., Wang, G., Yuan, Y., Han, B., Qiu, S., Hu, Y., & Zang, T. (2023) · Frontiers in Genetics · doi:10.3389/fgene.2023.1243879 · Cited by 5
Lin, Y.-C., Tu, H., & Wang, T. (2023) · Journal of Endocrinological Investigation · doi:10.1007/s40618-023-02209-x · Cited by 4
Genetic estimation of correlations between circulating glutamine and cancer.
Zhang, K., & Liang, H. (2023) · PubMed Central · Cited by 4
Chen, M., Xu, X., Wang, F., & Xu, X. (2024) · Frontiers in Aging Neuroscience · doi:10.3389/fnagi.2024.1466799 · Cited by 4
Air pollution is the risk factor for psychiatric disorders: a two-step Mendelian randomization study
Zhou, J., Lu, Z., Xu, K., Zhao, G., Zhu, Y., Yuan, R., Sun, Y., Zhang, Y., & Yue, W. (2025) · Journal of Affective Disorders · doi:10.1016/j.jad.2025.119475 · Cited by 4
Privacy Preserving Fisher’s Exact Test on Genomic Data
Poon, A., Jankly, S., & Chen, T. (2018) · IEEE International Conference on Big Data (BigData) · doi:10.1109/bigdata.2018.8622575 · Cited by 4
Pehkonen, J., Viinikainen, J., Böckerman, P., Pitkänen, N., Lehtimäki, T. J., & Raitakari, O. T. (2019) · SSM - Population Health · doi:10.1016/j.ssmph.2019.100379 · Cited by 4
Analysing Risk of Coronary Heart Disease through Discriminative Neural Networks
Khaneja, A., Srivastava, S., Rai, A., Cheema, A. S., & Srivastava, P. K. (2020) · International Conference on Pattern Recognition Applications and Methods · doi:10.5220/0009190106150620 · Cited by 4
Human Genetics Clarifies the Relationship Between Depression and Alzheimer’s Disease
Yang, H. (2022) · Biological Psychiatry · doi:10.1016/j.biopsych.2022.04.014 · Cited by 4
Zhang, Z., & Sun, L. (2023) · Bioinformatics · doi:10.1093/bioinformatics/btad139 · Cited by 4
Lu, Z., Zhang, H., Yang, Y., & Zhao, H. (2023) · Human Genetics · doi:10.1007/s00439-023-02573-x · Cited by 4
Liao, Q., Shen, J., Chen, Y., & Shu, Y. (2023) · Journal of Medical Virology · doi:10.1002/jmv.29266 · Cited by 4
Approximate conditional phenotype analysis based on genome wide association summary statistics
Wu, P., Wang, B., Lubitz, S. A., Benjamin, E. J., Meigs, J. B., & Dupuis, J. (2021) · Scientific Reports · doi:10.1038/s41598-021-82000-1 · Cited by 4
Systematic Evaluation of Cross Population Polygenic Risk Score on Colorectal Cancer
Mahesworo, B., Budiarto, A., & Pardamean, B. (2021) · Procedia Computer Science · doi:10.1016/j.procs.2021.01.015 · Cited by 4
Meng, X., Shen, H., Chen, X., Xiao, H., & Deng, H. (2018) · Human Genetics · doi:10.1007/s00439-018-1876-1 · Cited by 4
Using multiple measurements of tissue to estimate subject- and cell-type-specific gene expressionPreprint
Wang, J., Devlin, B., & Roeder, K. (2018) · bioRxiv (Cold Spring Harbor Laboratory) · doi:10.1101/379099 · Cited by 4
Genetic, lifestyle and environmental risk factors for chronic pain revealed through GWASPreprint
Lundberg, M., Campos, A. I., Farrell, S. F., Wang, G., Sterling, M. M., Rentería, M. E., Ngô, T. T., & Cuéllar-Partida, G. (2020) · bioRxiv (Cold Spring Harbor Laboratory) · doi:10.1101/2020.05.26.115568 · Cited by 5
Computational Tools for Causal Inference in GeneticsPreprint
Richardson, T. G., Zheng, J., & Gaunt, T. R. (2020) · Cold Spring Harbor Perspectives in Medicine · doi:10.1101/cshperspect.a039248 · Cited by 4
Reay, W. R., Geaghan, M. P., & Cairns, M. J. (2021) · medRxiv · doi:10.1101/2021.01.24.21250424 · Cited by 3
Wang, H., Xie, F., Wang, M., Ji, J., Song, Y., Dai, Y., Wang, L., Zheng, K., & Cao, L. (2025) · International Journal of Molecular Sciences · doi:10.3390/ijms26136201 · Cited by 3
Chen, Y., Wang, K., Zhang, X., Yang, F., Liu, T., Cheng, A., Guan, Y., Zhong, J., Meng, J., Zhang, X., et al. (2025) · Renal Failure · doi:10.1080/0886022x.2025.2584751 · Cited by 3
Zhang, W., Lan, F., Han, Y., Cai, R., Zhang, J., Wu, G., Li, G., Yan, Y., Yang, N., Yin, H., et al. (2026) · Journal of Advanced Research · doi:10.1016/j.jare.2026.03.021 · Cited by 3
Zhao, J. V., Sarsani, V., Chen, B., Yun, H., Hu, J., & Liang, L. (2026) · npj Cardiovascular Health · doi:10.1038/s44325-026-00113-w · Cited by 3
Ayalew, W., Li, G., Liu, Y., Teng, J., Cai, X., Lin, Q. C., Gao, Y., Li, J., & Zhang, Z. (2026) · Journal of Animal Science and Biotechnology/Journal of animal science and biotechnology · doi:10.1186/s40104-026-01363-5 · Cited by 4
Metabolically and epigenetically reprogrammed splenic TRNP1hiCD8+ T cells exacerbate liver fibrosis
Zhang, L.-Y., Wang, Y., Wei, K., Nie, W., Feng, Y., Shi, Z.-W., Xiao, H., Xie, W.-F., Lin, Y., Zeng, X., et al. (2026) · Nature Genetics · doi:10.1038/s41588-026-02660-5 · Cited by 3
Park, K., Ra, A., Chung, Y., Kim, M. J., Rhee, S. J., Yoon, D. H., Choi, S. H., Cho, S. J., Kim, H., Ahn, Y. M., et al. (2024) · Translational Psychiatry · doi:10.1038/s41398-024-02777-3 · Cited by 3
Wu, S., Chen, Z., Zhao, Y., He, Q., Yin, Z., Yao, H., Liu, H., & Yan, L. (2024) · Frontiers in Genetics · doi:10.3389/fgene.2024.1395219 · Cited by 3
Han, Y., Du, Q., Dai, Y., Gu, S., Lei, M., Liu, W., Zhang, W., Zhu, M., Feng, L., Si, H., et al. (2025) · Plant Communications · doi:10.1016/j.xplc.2025.101293 · Cited by 3
Huang, H., Chen, B., Feng, C., Chen, W., & Wu, D. (2025) · Virulence · doi:10.1080/21505594.2025.2473631 · Cited by 3
Henry, J., Berrandou, T.-E., Brewster, L. M., & Bouatia‐Naji, N. (2025) · Journal of the American Heart Association · doi:10.1161/jaha.124.036697 · Cited by 3
Dube, L., Mills, N. T., Le, T. D., Hyppönen, E., & Lee, S. (2025) · Human Genetics · doi:10.1007/s00439-025-02739-9 · Cited by 3
Feng, C., Li, H., Zhou, Y., Zhang, C., Yang, J., & Wang, H. (2025) · Microbes and Infection · doi:10.1016/j.micinf.2025.105529 · Cited by 3
Self-citationUsing Mendelian randomization analyses in osteoarthritis: state of art and future perspectives
Liu, H., Zhu, J., Jiang, H., Cai, B., Yang, C., Sun, L., Wang, J., & Li, Y. (2025) · Annals of Medicine · doi:10.1080/07853890.2025.2533428 · Cited by 4
Faquih, T. O., Potts, K. S., Nagarajan, P., Yu, B., Kaplan, R. C., Isasi, C. R., Qi, Q., Taylor, K. D., Liu, P. Y., Strausz, S. J., et al. (2025) · EBioMedicine · doi:10.1016/j.ebiom.2025.105881 · Cited by 4
Chen, L. (2025) · DNA Research · doi:10.1093/dnares/dsaf024 · Cited by 4
Liu, X., Wang, X., & Wang, L. (2025) · Ecotoxicology and Environmental Safety · doi:10.1016/j.ecoenv.2025.119237 · Cited by 3
Sørensen, H. J., Antonsen, S., Benros, M. E., Erlangsen, A., Albiñana, C., Nordentoft, M., Børglum, A. D., Mors, O. N., Werge, T. M., Mortensen, P. B., et al. (2022) · Nordic Journal of Psychiatry · doi:10.1080/08039488.2022.2078998 · Cited by 3
Genome-Wide Screening Identifies DNA Methylation Sites that Regulate the Blood Proteome
Nikpay, M., Ravati, S., & McPherson, R. (2022) · Epigenomics · doi:10.2217/epi-2022-0119 · Cited by 3
Lin, X., Yang, Y., Ngwa, V. F., Yin, X., Simpson, S., van der Mei, I. A. F., Broadley, S., Ponsonby, A., Ausimmune/ AusLong Investigators Group, Burdon, K. P., et al. (2023) · Journal of Neurology Neurosurgery & Psychiatry · doi:10.1136/jnnp-2022-330259 · Cited by 3
Rare and Common Variants in GALNT3 May Affect Bone Mass Independently of Phosphate Metabolism
Hassan, N., Gregson, C. L., Tang, H., van der Kamp, M. W., Leo, P., McInerney-Leo, A. M., Zheng, J., Brandi, M. L., TANG, J. C. Y., Fraser, W. D., et al. (2020) · Journal of Bone and Mineral Research · doi:10.1002/jbmr.4795 · Cited by 4
Jiang, Y., Zhang, Y., Ju, C., Zhang, R., Li, H., Chen, F., Zhu, Y., Shen, S., & Wei, Y. (2023) · iScience · doi:10.1016/j.isci.2023.108238 · Cited by 3
Wang, Y., Shen, O., Xu, Q., Sun, L., Jia, Y., Liu, Y., He, Y., Chang, X., Guo, D., Shi, M., et al. (2023) · Cerebral Cortex · doi:10.1093/cercor/bhad496 · Cited by 3
Self-citationAssociations of hyperthyroidism with epilepsy: a Mendelian randomization study
Liu, J., Yu, H., Wang, Q., Zhong, J., Yao, C., Chen, J., & Diao, L. (2024) · Scientific Reports · doi:10.1038/s41598-024-54933-w · Cited by 3
Chen, X., Zheng, Y., Wang, J., Yue, B., Zhang, X., Nakai, K., & Yan, L. L. (2024) · PeerJ · doi:10.7717/peerj.17073 · Cited by 3
Timmins, I. R., Zaccardi, F., Yates, T. E., & Dudbridge, F. (2024) · Scientific Reports · doi:10.1038/s41598-024-60398-8 · Cited by 3
Wu, X.-P., Niu, P., & Liu, H. (2024) · Frontiers in Genetics · doi:10.3389/fgene.2024.1272599 · Cited by 2
Gelernter, J. E., Levey, D. F., Galimberti, M., Harrington, K. M., Zhou, H., Adhikari, K., Gupta, P., Gaziano, J. M., Eliott, D., & Stein, M. B. (2024) · Cell Genomics · doi:10.1016/j.xgen.2024.100582 · Cited by 3
Wang, F., Bian, S., Zhou, W., Liu, S. M., Shu, Y., & Chen, Y. (2024) · Journal of Medical Virology · doi:10.1002/jmv.29736 · Cited by 3
Wan, S.-C., Wang, S., Zhang, X., Li, H., Sun, M., Chen, G., Wang, J., & Li, X. (2025) · Neurological Sciences · doi:10.1007/s10072-024-07976-w · Cited by 3
Wu, S., Meena, D., Smith, A., Huang, J., Otto, G., Ko, Y.-H., Yarmolinsky, J., Gill, D., Rohatgi, A. K., Dehghan, A., et al. (2025) · The Lancet Regional Health - Southeast Asia · doi:10.1016/j.lansea.2025.100621 · Cited by 4
Ma, M., Liang, X., Cheng, S., Zhang, L., Cheng, B., Yang, J., Ding, M., Zhao, Y., Li, P., Du, Y., et al. (2018) · Behavioural Brain Research · doi:10.1016/j.bbr.2018.07.008 · Cited by 3
Self-citationYu, M., Du, Y., Liu, K., Liang, X., Huang, C., He, R., Lei, W., Chen, J., Chen, J., Tan, Y., et al. (2021) · Journal of Affective Disorders · doi:10.1016/j.jad.2021.04.038 · Cited by 3
Axelsen, T. M., Bager, C. L., Bihlet, A. R., Karsdal, M. A., Henriksen, K., & Tang, M. E. (2023) · The Journal of Prevention of Alzheimer s Disease · doi:10.14283/jpad.2023.36 · Cited by 3
Dissecting the genetic overlap of education, socioeconomic status, and mental healthPreprint
Wendt, F. R., Pathak, G. A., Lencz, T., Krystal, J. H., Gelernter, J. E., & Polimanti, R. A. (2020) · medRxiv · doi:10.1101/2020.01.09.20017079 · Cited by 3
Xiang, Y., Qiu, J., Zhang, R., Chau, C. K., Rao, S., & So, H. (2021) · medRxiv · doi:10.1101/2021.06.29.21259609 · Cited by 3
Evolving pinna-like surfaces for a biomimetic sonar head
Kampchen, N. (2000) · Cited by 3
Sadhu, N., Dalan, R., Jain, P., Lee, C. J. M., Pakkiri, L. S., Tay, K. Y., Mina, T. H., Low, D. Y., Min, Y., Ackers-Johnson, M. A., et al. (2024) · medRxiv · doi:10.1101/2024.05.14.24307316 · Cited by 3
Trans-ancestry Genome-Wide Analyses in UK Biobank Yield Novel Risk Loci for Major DepressionPreprint
Singh, M., Chatzinakos, C., Barr, P. B., Gentry, A. E., Bigdeli, T. B., Webb, B. T., & Peterson, R. E. (2025) · medRxiv · doi:10.1101/2025.02.22.25322721 · Cited by 4
Wang, C., Pu, Q., Mo, X., Han, X., Wang, F., Li, W., Chen, C., Xue, Y., Xin, J., Shen, C., et al. (2025) · Journal of Affective Disorders · doi:10.1016/j.jad.2025.01.093 · Cited by 3
Chen, W., Liu, Y., Zhang, S., Jiang, Z., Wang, T., Huang, S., & Zeng, P. (2025) · Prevention Science · doi:10.1007/s11121-025-01781-3 · Cited by 2
Chen, Z., Yang, Q., Zhang, S., & Peng, T. (2025) · Scientific Reports · doi:10.1038/s41598-025-91715-4 · Cited by 2
Zhang, S., Yao, Y., Li, Y., Zhang, X., & Wu, Y. (2025) · Molecular Neurobiology · doi:10.1007/s12035-025-04985-4 · Cited by 2
Self-citationSong, X., Ma, J., Zou, T., Lu, R. X., Ji, W., Huang, F., & Yin, M. (2025) · Diabetology & Metabolic Syndrome · doi:10.1186/s13098-025-01829-y · Cited by 3
Che, W. I., Sysojev, A. Ö., Zhu, C., Patasova, K., IMACS Myositis Genetics Scientific Interest Group (MYOGEN), Smedby, K. E. E., Lundberg, I. E., Westerlind, H., & Holmqvist, M. E. (2025) · RMD Open · doi:10.1136/rmdopen-2025-006035 · Cited by 3
Genetic associations of plasma proteomics with dementia subtypes and neuroimaging markers
Salih, A. M., Salatzki, J., Wang, Y., Aklilu, T., Maldonado-Garcia, C., Husain, M., Neubauer, S., Topiwala, A., Altmann, A., & Raisi‐Estabragh, Z. (2025) · Alzheimer s & Dementia Diagnosis Assessment & Disease Monitoring · doi:10.1002/dad2.70202 · Cited by 3
Han, Y. Y., Hong, Y., Gao, Y., Lu, J., Chen, B., Zhang, L., Yan, X., Sun, Y. J., Zhang, L., Liu, J., et al. (2025) · PLoS Genetics · doi:10.1371/journal.pgen.1011897 · Cited by 3
Winter, T., Jahagirdar, O. B., Purdue, M. P., Dutta, D., Machiela, M. J., Gorman, B. R., Winter, T., Okuhara, D. Y., Cleland, S., Ferreiro-Iglesias, A., et al. (2025) · International Journal of Epidemiology · doi:10.1093/ije/dyaf177 · Cited by 2
Xie, W., Yu, J., & Wang, P. (2025) · Journal of Attention Disorders · doi:10.1177/10870547251385350 · Cited by 2
Wu, Y. T., Jianhong, W., & Ping, G. (2025) · Molecular Neurobiology · doi:10.1007/s12035-025-05365-8 · Cited by 2
Self-citationPölsterl, S., Wachinger, C., Initiative, T. A. D. N., & Initiative, T. J. A. D. N. (2022) · Alzheimer s & Dementia · doi:10.1002/alz.12825 · Cited by 2
Rhee, S. H., & Ellingson, J. M. (2023) · Journal of Child Psychology and Psychiatry · doi:10.1111/jcpp.13760 · Cited by 2
Nikpay, M. (2023) · Epigenomes · doi:10.3390/epigenomes7030019 · Cited by 2
Baudier, C., Fougerousse, F., Asselbergs, F. W., Guedj, M., Michel Komajda, N., Kotecha, D., Lumbers, R. T., Schmidt, A. F., & Tyl, B. (2023) · Frontiers in Cardiovascular Medicine · doi:10.3389/fcvm.2023.1148931 · Cited by 2
Drug classes affecting intracranial aneurysm risk: Genetic correlation and Mendelian randomization
Ruigrok, Y. M., Veldink, J. H., & Bakker, M. K. (2024) · European Stroke Journal · doi:10.1177/23969873241234134 · Cited by 2
Genetic predicted causal inferences between antioxidants and birth weight
Zhang, Y., Wu, M., Wang, H. H., & Zhou, W. (2024) · Journal of Clinical Biochemistry and Nutrition · doi:10.3164/jcbn.24-2 · Cited by 2
Genetic architecture of brain morphology and overlap with neuropsychiatric traits
Ge, Y., Fu, Y. H. H., Gong, W., Cheng, W., & Yu, J.-T. (2024) · Trends in Genetics · doi:10.1016/j.tig.2024.04.005 · Cited by 2
Yang, S., Wang, X., Li, Y., Zhou, L., Guo, G., & Wu, M. (2024) · Frontiers in Endocrinology · doi:10.3389/fendo.2024.1338698 · Cited by 2
Wang, Y., Chen, M., Wang, L., & Wu, Y. (2024) · Frontiers in Nutrition · doi:10.3389/fnut.2024.1400577 · Cited by 2
Self-citationSummary statistics knockoffs inference with family-wise error rate control
Yu, C. X., Gu, J., Chen, Z., & He, Z. (2024) · Biometrics · doi:10.1093/biomtc/ujae082 · Cited by 1
COVID-19 infection and longevity: an observational and mendelian randomization study
Qiu, S., Liu, J., Guo, J., Zhang, Z., Guo, Y. L., & Hu, Y. (2025) · Journal of Translational Medicine · doi:10.1186/s12967-024-05932-y · Cited by 2
Reay, W. R., Pursey, K., & Thorp, J. G. (2025) · Biological Psychiatry · doi:10.1016/j.biopsych.2025.03.002 · Cited by 2
Huang, Y., Ju, C., Luo, J., & Li, Y. (2025) · Progress in Neuro-Psychopharmacology and Biological Psychiatry · doi:10.1016/j.pnpbp.2025.111369 · Cited by 2
Zhuoran, Z., Xiaoman, W., Rui, Y., & Cao, Q. (2025) · Journal of Attention Disorders · doi:10.1177/10870547251349252 · Cited by 2
Trans-eQTLs Can Be Used to Identify Tissue-Specific Gene Regulatory Networks
Nikpay, M. (2025) · Current Issues in Molecular Biology · doi:10.3390/cimb47080594 · Cited by 2
Dube, L., Mills, N. T., Le, T. D., Hyppönen, E., & Lee, S. (2025) · Human Genetics · doi:10.1007/s00439-025-02762-w · Cited by 2
Refining genetic discoveries of group knockoffs via a feature-level filter
Gu, J., Chen, Z., & He, Z. (2026) · Journal of the Royal Statistical Society Series C (Applied Statistics) · doi:10.1093/jrsssc/qlag006 · Cited by 3
Metadata
- Authors
- Zhu, Z., Zheng, Z., Zhang, F., Wu, Y., Trzaskowski, M., Maier, R., Robinson, M. R., McGrath, J. J., Visscher, P. M., Wray, N. R., & Yang, J.
- Affiliations
- The University of Queensland (AU)
- Corresponding author
- Yang, Jian
- ORCID
- Venue
- Nature Communications
- Published
- 2018-01-15
- Volume
- 9
- Issue
- 1
- Pages
- 224-224
- ISSN
- 2041-1723 (ISSN-L)
- PMC
- PMC5768719
- OpenAlex
- W2949543964
- Cited by
- 951
- References
- 69
- Citations by year
- 2026: 92 · 2025: 136 · 2024: 134 · 2023: 129 · 2022: 115 · 2021: 122 · 2020: 102 · 2019: 81 · 2018: 35
- FWCI
- 51.44
- Type
- journal article
- Language
- en
- Open access
- gold
- doi.org
- Locations
- Nature Communications (publishedVersion, cc-by)
- bioRxiv (Cold Spring Harbor Laboratory) (acceptedVersion, cc-by-nc-nd)
- Europe PMC (PubMed Central) (publishedVersion, cc-by)
- PubMed Central (publishedVersion, cc-by)
- PubMed (publishedVersion)
- SERVAL (Université de Lausanne) (publishedVersion, cc-by)
- IRIS (submittedVersion, cc-by)
- RePEc: Research Papers in Economics (submittedVersion)
- DOAJ (DOAJ: Directory of Open Access Journals) (submittedVersion, cc-by-sa)
- DOAJ (DOAJ: Directory of Open Access Journals) (submittedVersion)
- IRIS (submittedVersion)
- SERVAL (Université de Lausanne) (submittedVersion)
- Funders
- National Research Foundation
- Danmarks Grundforskningsfond
- Lundbeckfonden (R155-2014-1724, R248‐2017‐2003)
- Medical Research Council (1107258, 1113400, 1078037, 1078901)
- Australian Research Council (DP160101343, 1113400)
- National Health and Medical Research Council (1113400, 1078901, 1056929, 1107258, 1078037, 1048853)
- Topics
- Life Sciences › Biochemistry, Genetics and Molecular Biology › Genetics › Genetic Associations and Epidemiology
- Life Sciences › Biochemistry, Genetics and Molecular Biology › Genetics › Genetics and Physical Performance
- Life Sciences › Biochemistry, Genetics and Molecular Biology › Genetics › Genetic and phenotypic traits in livestock
- Keywords
- causal inference, Mendelian randomization, body mass index, waist-to-hip ratio, serum cholesterol, LDL cholesterol, type 2 diabetes, Alzheimer's disease, years of schooling, blood pressure, height, confounding, statin adverse effects
- MeSH terms
- Alzheimer Disease, Cholesterol, Diabetes Mellitus, Type 2, Disease, Humans, Cholesterol, LDL, Risk Factors, Body Mass Index, Polymorphism, Single Nucleotide, Genome-Wide Association Study, Mendelian Randomization Analysis
About these checks
Registry, retraction, Cites and statistics results are computed, not judged, with one exception: a printed reference that no index lists is read once by a model before it counts as a citation error. Claims are extracted by a model and kept only when their quote appears verbatim in the text; each cited source is then checked, with a model’s help, for whether it says what the claim relies on. Those verdicts can be wrong — read the claim’s quote and the cited source before relying on one.
Statistics and arithmetic are recomputed, not judged.
Confidence bands are shown only for fields calibrated on our annotated test set. None is calibrated yet, so no band is shown.
What counts as a claim ›How we measure confidence ›How we check this ›
Are you an author, or do you see a problem with this page? Request a review
