

The DOI matches its Crossref record; 122 of the 122 references it cites were found in a registry or an index.
Co-transmission of acetylcholine and GABA regulates hippocampal states
Open accessPublished version of a preprint
Abstract
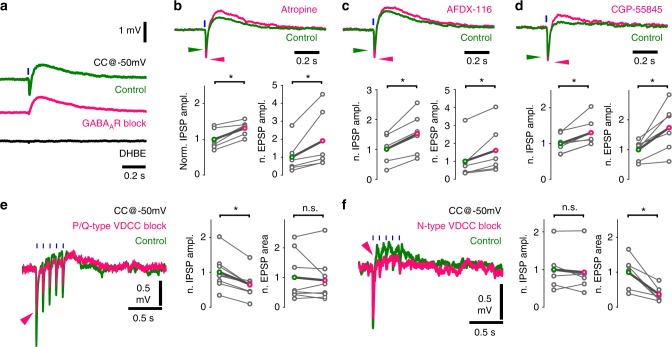
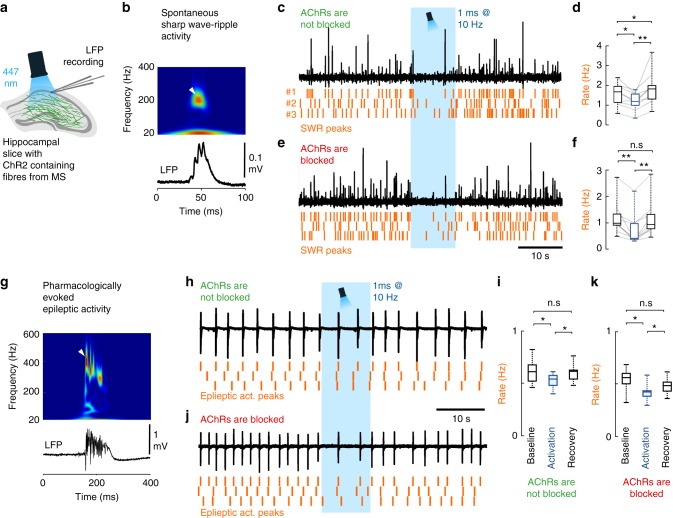
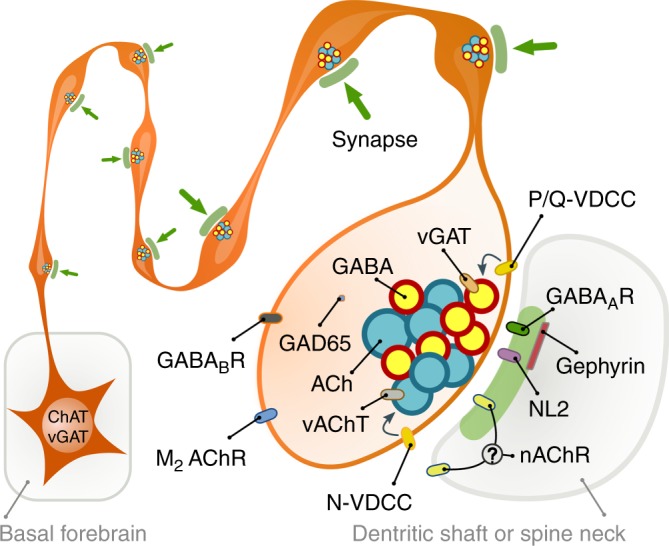
Abstract The basal forebrain cholinergic system is widely assumed to control cortical functions via non-synaptic transmission of a single neurotransmitter. Yet, we find that mouse hippocampal cholinergic terminals invariably establish GABAergic synapses, and their cholinergic vesicles dock at those synapses only. We demonstrate that these synapses do not co-release but co-transmit GABA and acetylcholine via different vesicles, whose release is triggered by distinct calcium channels. This co-transmission evokes composite postsynaptic potentials, which are mutually cross-regulated by presynaptic autoreceptors. Although postsynaptic cholinergic receptor distribution cannot be investigated, their response latencies suggest a focal, intra- and/or peri-synaptic localisation, while GABA A receptors are detected intra-synaptically. The GABAergic component alone effectively suppresses hippocampal sharp wave-ripples and epileptiform activity. Therefore, the differentially regulated GABAergic and cholinergic co-transmission suggests a hitherto unrecognised level of control over cortical states. This novel model of hippocampal cholinergic neurotransmission may lead to alternative pharmacotherapies after cholinergic deinnervation seen in neurodegenerative disorders.
Overview
The claims and statistics of this paper haven’t been checked yet.
Run the check — free, no account needed. It reads the open-access text and checks the sources it cites.
Integrity signals
Registry
Cites
Statistics
Figures
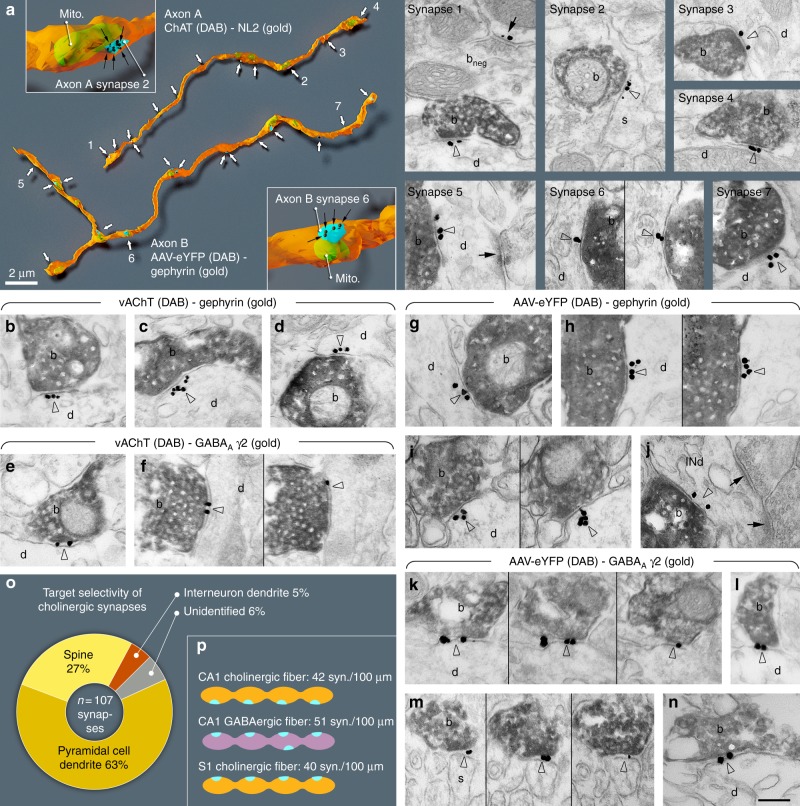
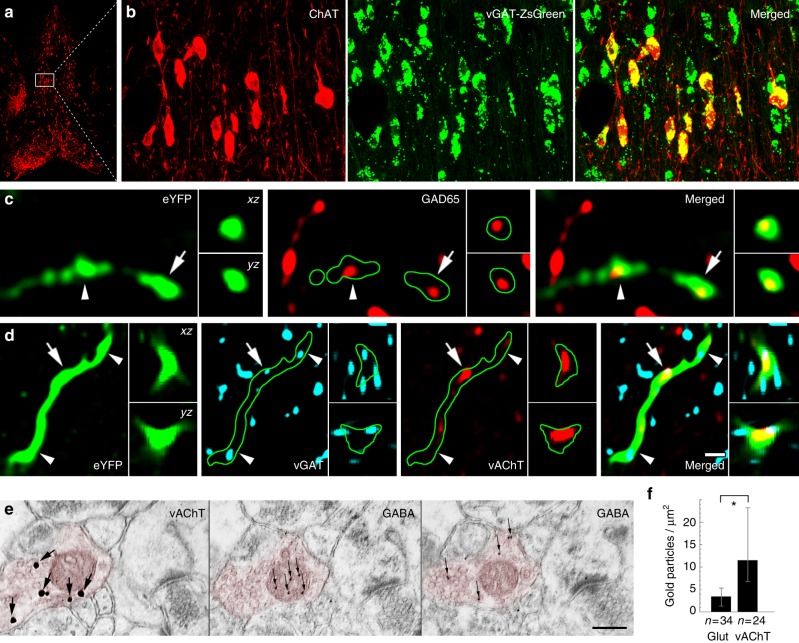
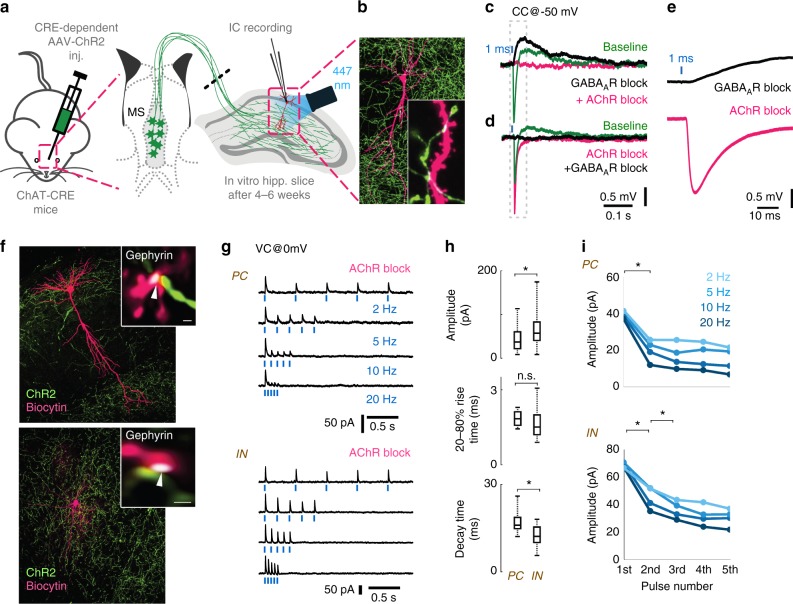
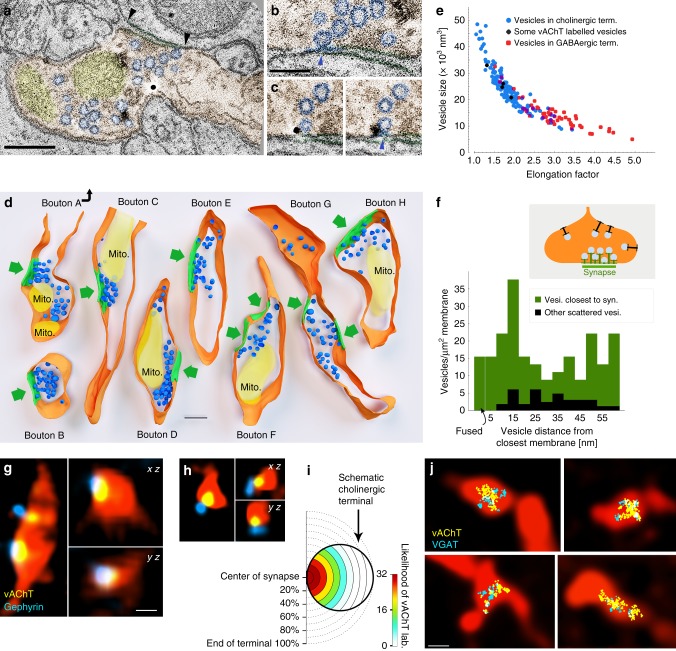
Verification
Claims the paper makes
The claims and statistics of this paper haven’t been checked yet.
Run the check — free, no account needed. It reads the open-access text and checks the sources it cites.
Claims other papers make about this one
Each is checked against this paper’s own text: does it say what the citing paper says it does?
In the citing paper
“Several groups have found evidence for Ach and glutamate being copackaged into the same synaptic vesicles at this synapse 21,22,56,124”
From Synaptic and circuit functions of multitransmitter neurons in the mammalian brain (2023) · cites this paper as [124]
Self-check
Percentages, sums and reported differences re-computed from the paper’s own numbers.
The self-check needs the paper’s full text.
Citations
Cites
Computer Visualization of Three-Dimensional Image Data Using IMOD
Kremer, J. R., Mastronarde, D. N., & McIntosh, J. R. (1996) · Journal of Structural Biology · doi:10.1006/jsbi.1996.0013 · Cited by 5,530
Uncertainty, Neuromodulation, and Attention
Yu, A. J., & Dayan, P. (2005) · Neuron · doi:10.1016/j.neuron.2005.04.026 · Cited by 1,774
Hippocampal sharp wave-ripple: A cognitive biomarker for episodic memory and planning
Buzsáki, G. (2015) · Hippocampus · doi:10.1002/hipo.22488 · Cited by 1,759
Selective suppression of hippocampal ripples impairs spatial memory
Girardeau, G., Benchenane, K., Wiener, S. I., Buzsáki, G., & Zugaro, M. B. (2009) · Nature Neuroscience · doi:10.1038/nn.2384 · Cited by 1,560
Acetylcholine as a Neuromodulator: Cholinergic Signaling Shapes Nervous System Function and Behavior
Picciotto, M. R., Higley, M. J., & Mineur, Y. S. (2012) · Neuron · doi:10.1016/j.neuron.2012.08.036 · Cited by 1,404
Megı́as, M., Emri, Z., Freund, T. F., & Gulyás, A. I. (2001) · Neuroscience · doi:10.1016/s0306-4522(00)00496-6 · Cited by 950
Self-citationReconstruct : a free editor for serial section microscopy
Fiala, J. C. (2005) · Journal of Microscopy · doi:10.1111/j.1365-2818.2005.01466.x · Cited by 889
Postsynaptic clustering of major GABAA receptor subtypes requires the γ2 subunit and gephyrin
Essrich, C., Lorez, M., Benson, J. A., Fritschy, J., & Lüscher, B. (1998) · Nature Neuroscience · doi:10.1038/2798 · Cited by 856
A disinhibitory microcircuit for associative fear learning in the auditory cortex
Letzkus, J. J., Wolff, S. B. E., Meyer, E. M. M., Tovote, P., Courtin, J., Herry, C., & Lüthi, A. (2011) · Nature · doi:10.1038/nature10674 · Cited by 840
Rye, D. B., Wainer, B. H., Mesulam, M.-M., Mufson, E. J., & Saper, C. B. (1984) · Neuroscience · doi:10.1016/0306-4522(84)90083-6 · Cited by 743
Research works printed but not linked: 1
- Paxinos, G. & Franklin, K. B. J. Paxinos and Franklin’s the Mouse Brain in Stereotaxic Coordinates (Academic Press, São Paulo, 2012).
Cited by
Sorted by citations
Items 101–171 of 171
Faritovich, N. L., Almazov, N. D., & Volkov, E. M. (2023) · Biochemistry (Moscow) Supplement Series A Membrane and Cell Biology · doi:10.1134/s1990747823040074 · Cited by 5
INHIBITION OF BRAIN ASICS AFFECTS HIPPOCAMPAL THETA-RHYTHM AND OPENFIELD BEHAVIOR IN RATS
Fedoriuk, M., Cherninskyi, A., Maximyuk, O. P., Isaev, D. S., Bogovyk, R. I., Venhreniuk, A. V., Boyko, O. M., & Krishtal, O. (2019) · Fìzìologìčnij žurnal · doi:10.15407/fz65.01.015 · Cited by 5
Astrocytic Neuroligins Are Not Required for Synapse Formation or a Normal Astrocyte CytoarchitecturePreprint
Golf, S. R., Trotter, J. H., Nakahara, G., & Südhof, T. C. (2023) · doi:10.7554/elife.87589.1 · Cited by 6
Moghadam, F. F., Gutiérrez-Guzmán, B. E., Zheng, X., Parsa, M., Hozyen, L. M., & Dannenberg, H. (2025) · Journal of Neuroscience · doi:10.1523/jneurosci.0133-25.2025 · Cited by 6
Thulin, A., Henriksson, K., Nogueira, I., & Kullander, K. (2025) · Hippocampus · doi:10.1002/hipo.70026 · Cited by 3
Assessing the Potential of NGF-Differentiated PC12 Cells as a Model for Synaptic Transmission
Ott, G., Leuenberger, J., Ntamati, N. R., Ivanov, A., Nevian, T., Rostami, I., & Zuber, B. (2025) · Molecular Neurobiology · doi:10.1007/s12035-025-05562-5 · Cited by 5
Age-dependent effects of estradiol on temporal memory: A role for the type 1 cannabinoid receptor?
Potier, M., Maître, M., Lesté-Lasserre, T., Marsicano, G., Chaouloff, F., & Marighetto, A. (2022) · Psychoneuroendocrinology · doi:10.1016/j.psyneuen.2022.106002 · Cited by 4
Zhang, S., Gao, P., Wang, Q., Liu, S., Okoth, S., Zhang, M., Ji, H., Yan, L., Fan, W., & Song, S. (2025) · Probiotics and Antimicrobial Proteins · doi:10.1007/s12602-025-10759-0 · Cited by 4
Neuromodulation of Hippocampal Cells and Circuits
Lawrence, J. J., & Cobb, S. (2018) · Springer series in computational neuroscience · doi:10.1007/978-3-319-99103-0_7 · Cited by 4
A Computational Model of the Cholinergic Modulation of CA1 Pyramidal Cell Activity
Mergenthal, A. R., Bouteiller, J. C., Yu, G. J., & Berger, T. W. (2020) · Frontiers in Computational Neuroscience · doi:10.3389/fncom.2020.00075 · Cited by 4
Epiney, D., Chaya, G. N. M., Dillon, N. R., Lai, S.-L., & Doe, C. Q. (2025) · eLife · doi:10.7554/elife.105896.1 · Cited by 4
Epiney, D., Chaya, G. N. M., Dillon, N. R., Lai, S.-L., & Doe, C. Q. (2025) · eLife · doi:10.7554/elife.105896.2 · Cited by 4
Tsolias, A., Zhou, Y., Mojica, C. A., Sakharkar, M., Tsolias, M., Moore, T. L., Rosene, D. L., & Medalla, M. (2024) · Journal of Neuroscience · doi:10.1523/jneurosci.0953-23.2024 · Cited by 3
Tang, Z., Sun, S., Lin, Z., Wen, Y., Li, S., Sun, J., & Sun, J. (2024) · Neuroscience Letters · doi:10.1016/j.neulet.2024.137971 · Cited by 3
Hirai, H., Konno, K., Yamasaki, M., Watanabe, M., Sakaba, T., & Hashimotodani, Y. (2024) · eLife · doi:10.7554/elife.99711.3 · Cited by 16
Basal forebrain innervation of the amygdala: an anatomical and computational exploration
Tuna, T., Banks, T., Glickert, G., Sevinc, C., Nair, S. S., & Ünal, G. (2025) · Brain Structure and Function · doi:10.1007/s00429-024-02886-1 · Cited by 3
Szőnyi, A. (2019) · Science · doi:10.1126/science.aaz3883 · Cited by 3
Self-citationNeuronal Heterogeneity in the Medial Septum and Diagonal Band of Broca: Classes and ContinuaPreprint
Kuhn, F., Mocellin, P., Pupe, S., Wang, L., Lemire, A. L., Sosulina, L., Barnstedt, O., Spruston, N., Cembrowski, M. S., & Remy, S. (2024) · bioRxiv (Cold Spring Harbor Laboratory) · doi:10.1101/2024.08.27.609593 · Cited by 4
Zangbar, H. S., Fallahi, S., Hosseini, L., Ghorbani, M., Jafarzadehgharehziaaddin, M., & Shahabi, P. (2023) · Experimental Brain Research · doi:10.1007/s00221-023-06577-x · Cited by 2
Mazon, C., Betters, R. K., Salmeron-Ceballos, G., Tomaziefski, A., Coffman, C. N., Simonson, R., & Tunc‐Ozcan, E. (2026) · IBRO Neuroscience Reports · doi:10.1016/j.ibneur.2026.01.003 · Cited by 2
Insomnia Pathogenesis and Multidimensional Mechanisms of Acupuncture: A Narrative Review
Xue, L., Jiang, H., Zhou, M., Zhu, M., Wang, W., & Wei, S. (2026) · International Journal of General Medicine · doi:10.2147/ijgm.s591463 · Cited by 2
Martin, L. M. S., Hafey, K., Bandhavkar, S., Bodea, G. O., Jiménez-Martín, J., Milne, M., Walker, T. L., Faulkner, G. J., Coulson, E. J., & Jhaveri, D. J. (2023) · Development · doi:10.1242/dev.201835 · Cited by 2
Molecular docking analysis of timepidium with Acetylcholine and lumacaftor with GABA(A) activator
Ali, W. (2019) · Bioinformation · doi:10.6026/97320630015832 · Cited by 2
Self-generated brain-wide spiking cascades govern replay dynamics in the hippocampusPreprint
Yang, Y., Leopold, D. A., Duyn, J. H., & Liu, X. (2022) · bioRxiv (Cold Spring Harbor Laboratory) · doi:10.1101/2022.09.05.506667 · Cited by 2
Golf, S. R., Trotter, J. H., Wang, J., Nakahara, G., Han, X., Wernig, M., & Südhof, T. C. (2025) · eLife · doi:10.7554/elife.87589.3 · Cited by 2
Carvalho, R., Lukoyanov, N., Casalta‐Lopes, J., Lukoyanov, N., & Soares, J. I. (2023) · AIMS neuroscience · doi:10.3934/neuroscience.2023023 · Cited by 1
Hadjighassem, M. (2024) · International Journal of Clinical Case Reports and Reviews · doi:10.31579/2690-4861/371 · Cited by 1
Dognini, E., Finazzi, S., Campana, E., Manenti, R., Cotelli, M., & Borroni, B. (2025) · Brain Sciences · doi:10.3390/brainsci15090969 · Cited by 1
Mesoscopic analysis of GABAergic marker expression in acetylcholine neurons in the whole mouse brain
Goral, R. O., Roy, S., Co, C. A., Wine, R. N., Lamb, P. W., Turner, P. M., McBride, S. J., Usdin, T. B., & Yakel, J. L. (2025) · iScience · doi:10.1016/j.isci.2025.114531 · Cited by 1
Reyes‐Pinto, R., Ferrán, J. L., Vega‐Zuniga, T., González‐Cabrera, C., Luksch, H., Mpodozis, J., Puelles, L., & Marin, G. J. (2021) · The Journal of Comparative Neurology · doi:10.1002/cne.25229 · Cited by 1
El sueño: fisiología y homeostasis
Padilla-Gil, D. N. (2023) · Revista Colombiana de Ciencia Animal - RECIA · doi:10.24188/recia.v15.n1.2023.985 · Cited by 2
Valentino, R. J., & Dingledine, R. J. (2021) · Journal of Neuroscience · doi:10.1523/jneurosci.3229-20.2021 · Cited by 1
Ncube, D., Tallafuß, A., Serafin, J., Bruckner, J. J., Farnsworth, D. R., Miller, A., Eisen, J., & Washbourne, P. (2022) · Research Square · doi:10.21203/rs.3.rs-1349219/v1 · Cited by 1
Vastagh, C., Farkas, I., Csillag, V., Watanabe, M., Kalló, I., & Liposits, Z. (2023) · bioRxiv (Cold Spring Harbor Laboratory) · doi:10.1101/2023.08.22.554236 · Cited by 1
Golf, S. R., Trotter, J. H., Wang, J., Nakahara, G., Han, X., Wernig, M., & Südhof, T. C. (2025) · eLife · doi:10.7554/elife.87589.2 · Cited by 1
Huang, F., Baset, A., & Bello, S. T. (2025) · eLife · doi:10.7554/elife.109001 · Cited by 1
Sena, I. C. R., & Ribeiro, Â. M. (2021) · GSC Advanced Research and Reviews · doi:10.30574/gscarr.2021.7.2.0092
Pimpinella, D., Mastrorilli, V., Giorgi, C., Coemans, S., Lecca, S., Lalive, A. L., Ostermann, H., Fuchs, E. C., Monyer, H., Mele, A., et al. (2021) · eLife · doi:10.7554/elife.65580.sa2
Martin, L. M. S., Bandhavkar, S., Hafey, K., Jiménez-Martín, J., Milne, M., Coulson, E. J., & Jhaveri, D. J. (2022) · bioRxiv (Cold Spring Harbor Laboratory) · doi:10.1101/2022.08.25.505357
Synaptic and dendritic architecture of different types of hippocampal somatostatin interneuronsPreprint
Takács, V. T., Bardóczi, Z., Orosz, Á., Major, Á., Tar, L., Berki, P., Papp, P., Mayer, M. I., Sebők, H., Zsolt, L., et al. (2023) · bioRxiv (Cold Spring Harbor Laboratory) · doi:10.1101/2023.05.14.540675
Self-citationGolf, S. R., Trotter, J. H., Wang, J., Nakahara, G., Han, X., Wernig, M., & Südhof, T. C. (2023) · eLife · doi:10.7554/elife.87589
Faritovich, N. L., Almazov, N. D., & Volkov, E. M. (2023) · Биологические мембраны Журнал мембранной и клеточной биологии · doi:10.31857/s0233475523060075
Drugs Acting on Autonomic Nervous System
Chattopadhyay, M., & Pal, B. (2024) · Springer eBooks · doi:10.1007/978-981-97-2776-6_4
Hirai, H., Konno, K., Yamasaki, M., Watanabe, M., Sakaba, T., & Hashimotodani, Y. (2024) · eLife · doi:10.7554/elife.99711.1
Hirai, H., Konno, K., Yamasaki, M., Watanabe, M., Sakaba, T., & Hashimotodani, Y. (2024) · eLife · doi:10.7554/elife.99711.2 · Cited by 1
Kullmann, D. M., & Volynski, K. E. (2025) · Oxford University Press eBooks · doi:10.1093/med/9780190065324.003.0006
Grosmark, A., Milstein, A. D., Losonczy, A., & Soltész, I. (2025) · Oxford University Press eBooks · doi:10.1093/med/9780190065324.003.0007
Neurophysiology of the Human Hippocampus
Akyüz, E. (2025) · Springer eBooks · doi:10.1007/978-3-031-88907-3_5
Huang, F., Baset, A., & Bello, S. T. (2026) · eLife · doi:10.7554/elife.109001.3
Pathway-specific hippocampal plasticity gated by theta-frequency medial septal stimulation
Korotkova, T., Bolshakov, A. P., Markevich, V. A., & Dobryakova, Y. V. (2025) · Neuroscience · doi:10.1016/j.neuroscience.2025.10.055
Excitatory cholecystokinin neurons in CA3 area regulate the navigation learning and neuroplasticityPreprint
Huang, F., Baset, A., & Bello, S. T. (2025) · eLife · doi:10.7554/elife.109001.1
Sleep-modulated disinhibition enables replay for memory consolidation, accelerated by ripplesPreprint
Dutta, S. (2025) · bioRxiv (Cold Spring Harbor Laboratory) · doi:10.64898/2025.12.09.693276
Kurki, S., Ala‐Kurikka, T., Lipponen, A., Pospelov, A. S., Rõlova, T., Koıstınaho, J., Voipio, J., & Kaila, K. (2024) · Figshare · doi:10.6084/m9.figshare.26607115
Kurki, S., Ala‐Kurikka, T., Lipponen, A., Pospelov, A. S., Rõlova, T., Koıstınaho, J., Voipio, J., & Kaila, K. (2024) · Figshare · doi:10.6084/m9.figshare.26607112
Uncovering the “hidden” synaptic microarchitecture of the retinal direction selective circuit
deRosenroll, G., Sethuramanujam, S., & Awatramani, G. B. (2026) · Cell Reports · doi:10.1016/j.celrep.2025.116833
Excitatory cholecystokinin neurons in CA3 area regulate the navigation learning and neuroplasticityPreprint
Huang, F., Baset, A., & Bello, S. T. (2026) · eLife · doi:10.7554/elife.109001.2
Cultural transmission and genomic co-divergence in the willow tit across the PalearcticPreprint
Syarifa, A., Martens, J., Päckert, M., Kvist, L., Wu, L., Sun, Y., Wolf, J. B. W., & Knief, U. (2026) · bioRxiv (Cold Spring Harbor Laboratory) · doi:10.64898/2026.04.23.720297
ER-associated control of axonal vesicle trafficking during neuronal developmentPreprint
Subra, M., Meehl, J. B., Abrisch, R. G., & Voeltz, G. K. (2026) · bioRxiv (Cold Spring Harbor Laboratory) · doi:10.64898/2026.04.23.720437
Garay-Cortes, A., Almazán‐Alvarado, S., Magdaleno-Madrigal, V. M., & Luna‐Munguía, H. (2026) · bioRxiv (Cold Spring Harbor Laboratory) · doi:10.64898/2026.04.24.720729
Neurotransmitter co-transmission: synaptic architectures, functional logic, and emerging tools
Tunc‐Ozcan, E. (2026) · Frontiers in Molecular Neuroscience · doi:10.3389/fnmol.2026.1862021
Lee, K. S., Sahlender, D. A., Blanc, J., Jorstad, A., Gasselin, C., Clerc-Rosset, S., Markopoulos, F., Petersen, C. C. H., Holtmaat, A. J. D. G., & Knott, G. W. (2026) · eLife · doi:10.64898/2026.08.11.744243
Circuit-specific remodeling of synaptic co-transmission in stress-responsive networks
Park, H., Kim, H., Sim, M., Ham, D., & Chung, C. (2026) · Animal Cells and Systems · doi:10.1080/19768354.2026.2730204
Higashi, T., Kobayashi, Y., Seki, A., Okabe, S., & Nishii, K. (2026) · bioRxiv (Cold Spring Harbor Laboratory) · doi:10.64898/2026.09.30.755469
Down Syndrome Early Postnatal Brain Multiome (DS-HPBM)
Bhattacharyya, A., Kumarage, P., West, N. R., Arachchilage, K. H., Knaack, S., MacGregor, S., Hosseini, M., Risgaard, R. D., Martinez, J., Zhang, S., et al. (2022) · INCLUDE Data Hub · doi:10.71738/an79-4v78
DS-HPBM Human Postnatal Basal Forebrain snRNA-seq
Bhattacharyya, A., Kumarage, P., West, N. R., Arachchilage, K. H., Knaack, S., MacGregor, S., Hosseini, M., Risgaard, R. D., Martinez, J., Zhang, S., et al. (2022) · INCLUDE Data Hub · doi:10.71738/543y-5019
DS-HPBM Human Postnatal Basal Forebrain snATAC-seq
Bhattacharyya, A., Kumarage, P., West, N. R., Arachchilage, K. H., Knaack, S., MacGregor, S., Hosseini, M., Risgaard, R. D., Martinez, J., Zhang, S., et al. (2022) · INCLUDE Data Hub · doi:10.71738/0cbf-8c55
Metadata
- Authors
- Takács, V. T., Cserép, C., Schlingloff, D., Pósfai, B., Szőnyi, A., Sos, K. E., Környei, Z., Dénes, Á., Gulyás, A. I., Freund, T. F., & Nyiri, G.
- Affiliations
- HUN-REN Institute of Experimental Medicine (HU)
- Semmelweis University (HU)
- ORCID
- Venue
- Nature Communications
- Published
- 2018-07-20
- Volume
- 9
- Issue
- 1
- Pages
- 2848-2848
- ISSN
- 2041-1723 (ISSN-L)
- PMC
- PMC6054650
- OpenAlex
- W2883601426
- Cited by
- 169
- References
- 122
- Citations by year
- 2026: 12 · 2025: 24 · 2024: 24 · 2023: 25 · 2022: 23 · 2021: 24 · 2020: 19 · 2019: 13 · 2018: 4
- FWCI
- 6.83
- Type
- journal article
- Language
- en
- Open access
- gold
- doi.org
- Locations
- Nature Communications (publishedVersion, cc-by)
- bioRxiv (Cold Spring Harbor Laboratory) (acceptedVersion, cc-by-nc-nd)
- Europe PMC (PubMed Central) (publishedVersion, cc-by)
- PubMed Central (publishedVersion, cc-by)
- PubMed (publishedVersion)
- Repository of the Academy's Library (Library of the Hungarian Academy of Sciences) (acceptedVersion)
- RePEc: Research Papers in Economics (submittedVersion)
- DOAJ (DOAJ: Directory of Open Access Journals) (submittedVersion)
- DOAJ (DOAJ: Directory of Open Access Journals) (submittedVersion, cc-by-sa)
- Funders
- EC | European Research Council (ERC-2011-ADG-294313, SERRACO)
- Topics
- Life Sciences › Neuroscience › Cellular and Molecular Neuroscience › Neuroscience and Neuropharmacology Research
- Life Sciences › Neuroscience › Cognitive Neuroscience › Memory and Neural Mechanisms
- Life Sciences › Neuroscience › Cognitive Neuroscience › Neural dynamics and brain function
- Keywords
- co-transmission, acetylcholine, GABA, basal forebrain cholinergic system, GABAergic synapses, vesicle docking, calcium channels, presynaptic autoreceptors, postsynaptic potentials, GABAA receptor, sharp-wave ripples, epileptiform activity, cortical state, neurodegenerative diseases
- MeSH terms
- Acetylcholine, Animals, Calcium, Dendrites, Female, gamma-Aminobutyric Acid, Hippocampus, Male, Mice, Inbred C57BL, Synaptic Transmission, Perfusion, Receptors, GABA-A, Synapses, Synaptic Vesicles, Neurotransmitter Agents, Neurodegenerative Diseases, Imaging, Three-Dimensional, Mice, Synaptic Potentials
About these checks
Registry, retraction, Cites and statistics results are computed, not judged, with one exception: a printed reference that no index lists is read once by a model before it counts as a citation error. Claims are extracted by a model and kept only when their quote appears verbatim in the text; each cited source is then checked, with a model’s help, for whether it says what the claim relies on. Those verdicts can be wrong — read the claim’s quote and the cited source before relying on one.
Statistics and arithmetic are recomputed, not judged.
Confidence bands are shown only for fields calibrated on our annotated test set. None is calibrated yet, so no band is shown.
What counts as a claim ›How we measure confidence ›How we check this ›
Are you an author, or do you see a problem with this page? Request a review
