

The DOI matches its Crossref record; 72 of the 72 references it cites were found in a registry or an index.
Chemical and structural studies provide a mechanistic basis for recognition of the MYC G-quadruplex
Open accessAbstract
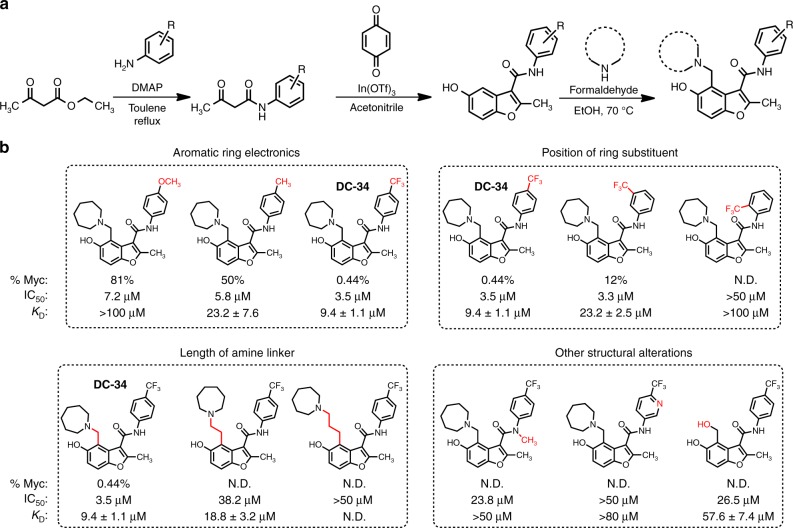
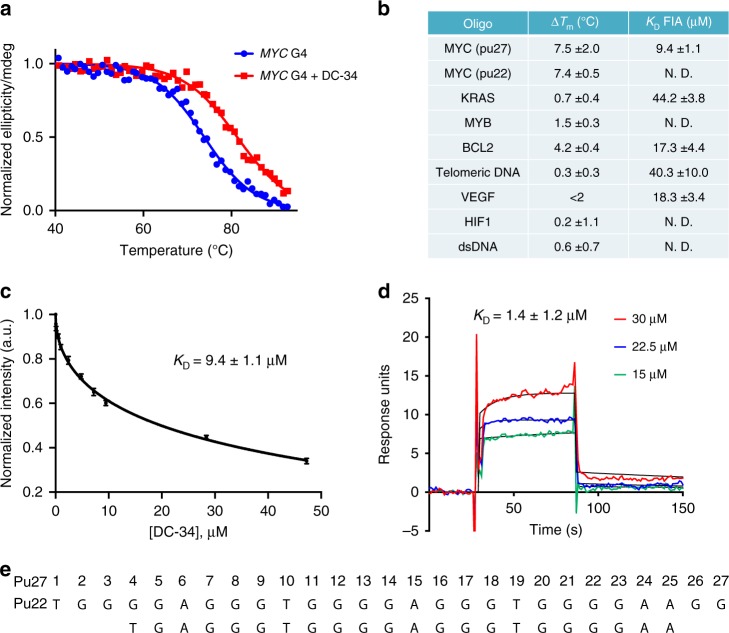
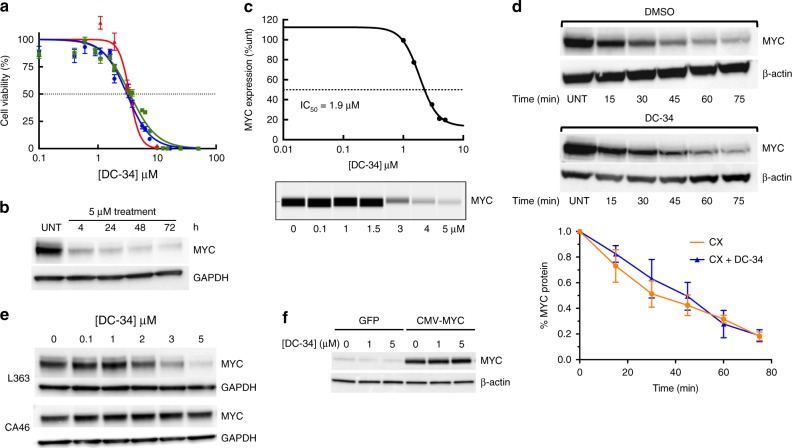
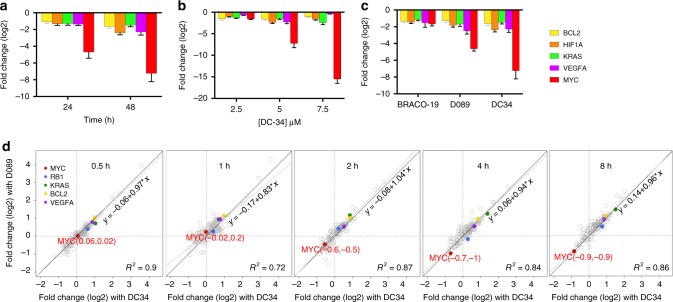
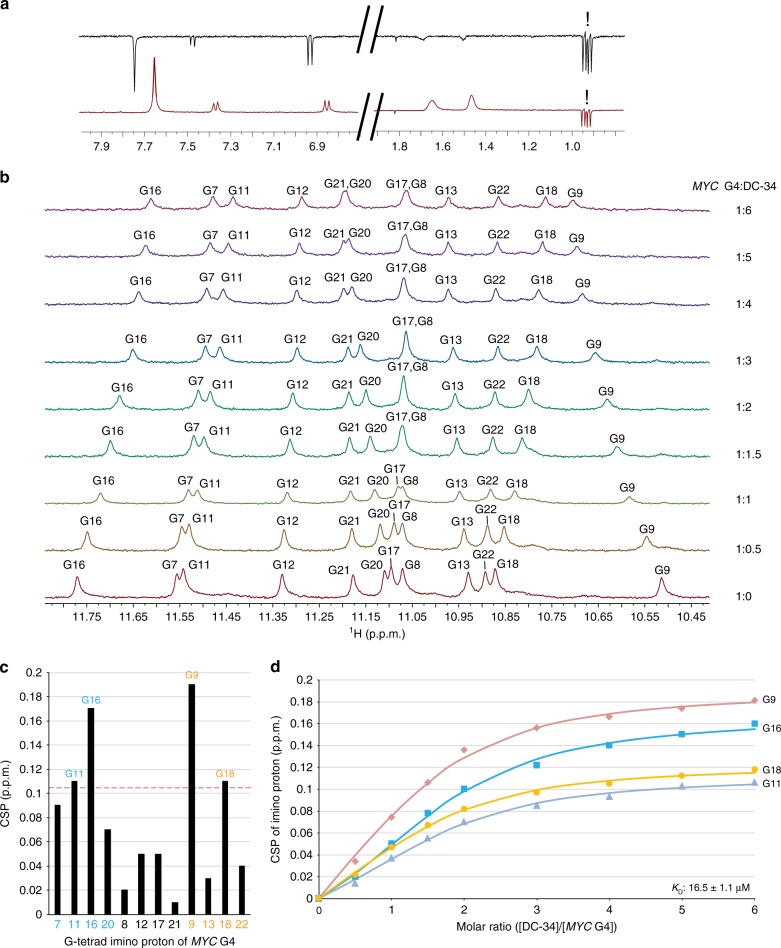
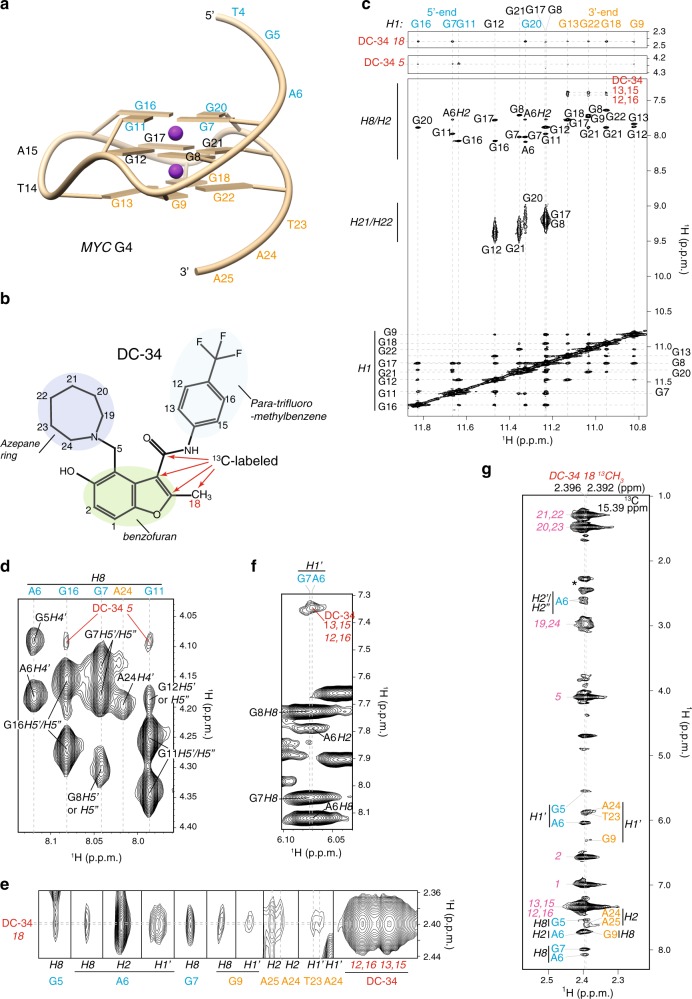
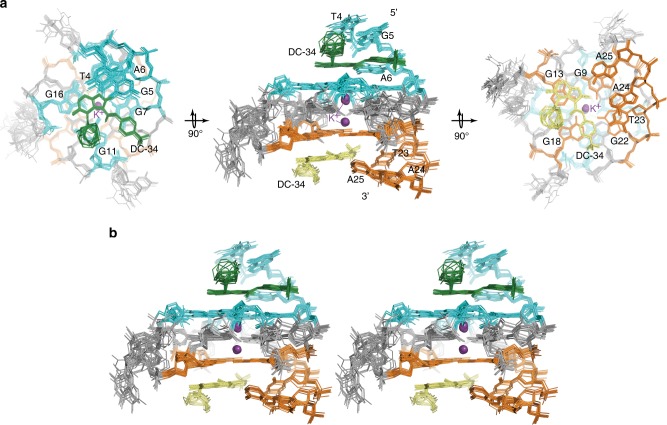
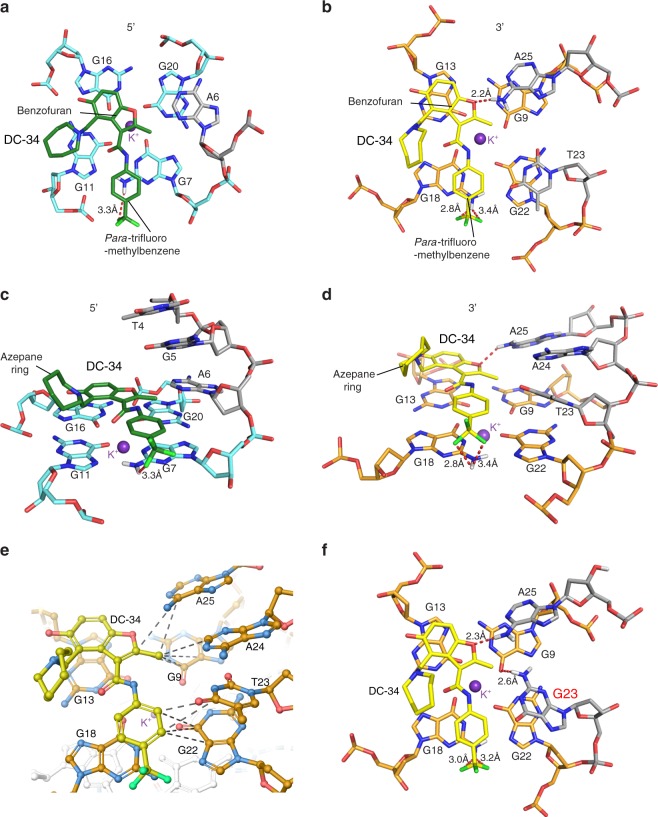
G-quadruplexes (G4s) are noncanonical DNA structures that frequently occur in the promoter regions of oncogenes, such as MYC , and regulate gene expression. Although G4s are attractive therapeutic targets, ligands capable of discriminating between different G4 structures are rare. Here, we describe DC-34, a small molecule that potently downregulates MYC transcription in cancer cells by a G4-dependent mechanism. Inhibition by DC-34 is significantly greater for MYC than other G4-driven genes. We use chemical, biophysical, biological, and structural studies to demonstrate a molecular rationale for the recognition of the MYC G4. We solve the structure of the MYC G4 in complex with DC-34 by NMR spectroscopy and illustrate specific contacts responsible for affinity and selectivity. Modification of DC-34 reveals features required for G4 affinity, biological activity, and validates the derived NMR structure. This work advances the design of quadruplex-interacting small molecules to control gene expression in therapeutic areas such as cancer.
Overview
The claims and statistics of this paper haven’t been checked yet.
Run the check — free, no account needed. It reads the open-access text and checks the sources it cites.
Integrity signals
Registry
Cites
Statistics
Figures
Verification
Claims the paper makes
The claims and statistics of this paper haven’t been checked yet.
Run the check — free, no account needed. It reads the open-access text and checks the sources it cites.
Claims other papers make about this one
Each is checked against this paper’s own text: does it say what the citing paper says it does?
In the citing paper
“In 2018, Walters, Mock and Schneekloth Jr’s group synthesized a library of drug-like compounds and reported a small molecule, named DC-34 (249), which showed impressive inhibitory activity on Myc at the transcriptional level only when a G4 is present in the promoter.584”
From Recent advances in targeting the “undruggable” proteins: from drug discovery to clinical trials (2023) · cites this paper as [584]
Self-check
Percentages, sums and reported differences re-computed from the paper’s own numbers.
The self-check needs the paper’s full text.
Citations
Cites
UCSF Chimera—A visualization system for exploratory research and analysis
Pettersen, E. F., Goddard, T. D., Huang, C. C., Couch, G. S., Greenblatt, D. M., Meng, E. C., & Ferrin, T. E. (2004) · Journal of Computational Chemistry · doi:10.1002/jcc.20084 · Cited by 46,047
NMRPipe: A multidimensional spectral processing system based on UNIX pipes
Delaglio, F., Grzesiek, S., Vuister, G. W., Zhu, G., Pfeifer, J., & Bax, A. (1995) · Journal of Biomolecular NMR · doi:10.1007/bf00197809 · Cited by 15,961
PRODRG: a tool for high-throughput crystallography of protein–ligand complexes
Schüttelkopf, A. W., & van Aalten, D. M. F. (2004) · Acta Crystallographica Section D Biological Crystallography · doi:10.1107/s0907444904011679 · Cited by 4,837
Dang, C. V. (2012) · Cell · doi:10.1016/j.cell.2012.03.003 · Cited by 3,390
Determining association constants from titration experiments in supramolecular chemistry
Thordarson, P. (2010) · Chemical Society Reviews · doi:10.1039/c0cs00062k · Cited by 2,431
Quadruplex DNA: sequence, topology and structure
Burge, S., Parkinson, G. N., Hazel, P., Todd, A. K., & Neidle, S. (2006) · Nucleic Acids Research · doi:10.1093/nar/gkl655 · Cited by 2,404
Cation-π interactions in structural biology
Gallivan, J. P., & Dougherty, D. A. (1999) · Proceedings of the National Academy of Sciences · doi:10.1073/pnas.96.17.9459 · Cited by 2,005
A Medicinal Chemist’s Guide to Molecular Interactions
Bissantz, C., Kuhn, B., & Ståhl, M. (2010) · Journal of Medicinal Chemistry · doi:10.1021/jm100112j · Cited by 1,810
Targeting G-quadruplexes in gene promoters: a novel anticancer strategy?
Balasubramanian, S., Hurley, L. H., & Neidle, S. (2011) · Nature Reviews Drug Discovery · doi:10.1038/nrd3428 · Cited by 1,720
The program XEASY for computer-supported NMR spectral analysis of biological macromolecules
Bartels, C., Xia, T.-H., Billeter, M., Güntert, P., & Kurt Wüthrich, A. (1995) · Journal of Biomolecular NMR · doi:10.1007/bf00417486 · Cited by 1,636
Cited by
Sorted by citations
Items 101–172 of 172
Roy, S., Muniyappa, K., & Bhattacharya, S. (2022) · ChemMedChem · doi:10.1002/cmdc.202200436 · Cited by 13
DNA G-quadruplexes: Structural and functional insights
Jonchhe, S., Lahiri, S., & Rothenberg, E. (2025) · DNA repair · doi:10.1016/j.dnarep.2025.103910 · Cited by 13
Andréasson, M., Donzel, M., Abrahamsson, A., Berner, A., Doimo, M., Quiroga, A., Eriksson, A., Chao, Y.-K., Overman, J., Pemberton, N., et al. (2024) · Journal of Medicinal Chemistry · doi:10.1021/acs.jmedchem.3c02127 · Cited by 10
Shukla, A., Kumari, S., Sankar, M., & Nair, M. S. (2023) · Biochimica et Biophysica Acta (BBA) - General Subjects · doi:10.1016/j.bbagen.2023.130482 · Cited by 12
Andréasson, M., Bhuma, N., Pemberton, N., & Chorell, E. (2022) · Chemistry - A European Journal · doi:10.1002/chem.202202020 · Cited by 12
Predicting G-Quadruplexes from DNA Sequences Using Multi-Kernel Convolutional Neural Networks
Barshai, M., & Orenstein, Y. (2019) · ACM International Conference on Bioinformatics, Computational Biology and Biomedicine · doi:10.1145/3307339.3342133 · Cited by 16
Solution structure of a thrombin binding aptamer complex with a non-planar platinum( ii ) compound
Zhu, B., He, J., Xia, X.-Y., Jiang, J., Liu, W., Liu, L., Liang, B., Yao, H., Ke, Z., Xia, W. T., et al. (2022) · Chemical Science · doi:10.1039/d2sc01196d · Cited by 11
Yin, S., Lan, W., Hou, X., Liu, Z., Xue, H., Wang, C., Tang, G., & Cao, C. (2023) · Journal of Medicinal Chemistry · doi:10.1021/acs.jmedchem.3c00178 · Cited by 11
Transcriptional regulation of MYC through G-quadruplex structures
Balaratnam, S., & Schneekloth, J. S. (2020) · Annual reports in medicinal chemistry · doi:10.1016/bs.armc.2020.05.002 · Cited by 12
Self-citationResearch Progress on Pyroptosis in Hematological Malignancies
Lyu, T., & Yin, Q. (2023) · Current Treatment Options in Oncology · doi:10.1007/s11864-023-01119-7 · Cited by 11
Dudek, M., López-Pacios, L., Sabouri, N., Nogueira, J. J., Martínez-Fernández, L., & Deiana, M. (2024) · Journal of Physical Chemistry Letters · doi:10.1021/acs.jpclett.4c02285 · Cited by 5
Zhu, B., He, J., Liu, W., Xia, X. Y., Liu, L., Liang, B., Yao, H., Liu, B., Ji, L., & Mao, Z. (2021) · Angewandte Chemie · doi:10.1002/ange.202104624 · Cited by 10
Challenges in developing small-molecule quadruplex therapeutics
Neidle, S. (2020) · Annual reports in medicinal chemistry · doi:10.1016/bs.armc.2020.05.005 · Cited by 11
Reznichenko, O., Leclercq, D., Franco, J., Mouawad, L., Gabelica, V., & Granzhan, A. (2022) · Chemistry - A European Journal · doi:10.1002/chem.202202427 · Cited by 9
Retracted: G-quadruplex structural transition driven by a platinum compound
Liu, W., Zhu, B., Liu, L., Xia, X., & Mao, Z. (2022) · Nucleic Acids Research · doi:10.1093/nar/gkac572 · Cited by 8
RetractedBanerjee, N., Chatterjee, O., Roychowdhury, T., Basu, D., Dutta, A., Chowdhury, M., Dastidar, S. G., & Chatterjee, S. (2022) · Biochimica et Biophysica Acta (BBA) - General Subjects · doi:10.1016/j.bbagen.2022.130267 · Cited by 8
Chashchina, G. V., Tevonyan, L. L., Beniaminov, A. D., & Kaluzhny, D. N. (2023) · Pharmaceuticals · doi:10.3390/ph16040544 · Cited by 8
Park, J., Kirsch, K., Lee, H., Oliva, P., Ahn, J. I., Ravishankar, H., Zeng, Y., Fox, S. D., Kirby, S. A., Badhwar, P., et al. (2023) · Proceedings of the National Academy of Sciences · doi:10.1073/pnas.2305037120 · Cited by 8
Olenginski, L. T., Attionu, S. K., Henninger, E. N., LeBlanc, R. M., Longhini, A. P., & Dayie, T. K. (2023) · Viruses · doi:10.3390/v15091913 · Cited by 8
NMR Studies on the Interaction between Oncogene RET G‐Quadruplex and Berberine†
Wang, F., Wang, C., Liu, Y., Lan, W., Wang, R., Huang, S., & Cao, C. (2020) · Chinese Journal of Chemistry · doi:10.1002/cjoc.202000301 · Cited by 8
G-Quadruplex Matters in Tissue-Specific Tumorigenesis by BRCA1 Deficiency
Kim, S., & Hwang, S. (2022) · Genes · doi:10.3390/genes13030391 · Cited by 8
Light‐Activated Molecules Targeting G‐Quadruplex Nucleic Acids
Dudek, M., Cabanetos, C., & Deiana, M. (2025) · Chemistry - A European Journal · doi:10.1002/chem.202501545 · Cited by 8
Thiazole Containing PNA Mimic Regulates c-MYC Gene Expression through DNA G-Quadruplex
Gorai, A., Chaudhuri, R., Mukhopadhyay, T. K., Datta, A., & Dash, J. (2022) · Bioconjugate Chemistry · doi:10.1021/acs.bioconjchem.2c00075 · Cited by 7
Atomistic Insights Into Interaction of Doxorubicin With DNA : From Duplex to Nucleosome
Nedělníková, A., Stadlbauer, P., Otyepka, M., Kührová, P., & Paloncýová, M. (2025) · Journal of Computational Chemistry · doi:10.1002/jcc.70035 · Cited by 7
Overlapping but distinct: a new model for G-quadruplex biochemical specificity
Volek, M., Kolesnikova, S., Švehlová, K., Srb, P., Sgallová, R., Streckerová, T., Redondo, J. A., Veverka, V., & Curtis, E. A. (2021) · Nucleic Acids Research · doi:10.1093/nar/gkab037 · Cited by 7
Morgan, R. K., Psaras, A. M., Lassiter, Q. R., Raymer, K., & Brooks, T. A. (2019) · Biochimica et Biophysica Acta (BBA) - Gene Regulatory Mechanisms · doi:10.1016/j.bbagrm.2019.194478 · Cited by 7
Weaver, M. J., Stump, S., Campbell, M. J., Backos, D. S., Li, C., Reigan, P., Adams, E. R., Beall, H. D., & Natale, N. R. (2020) · Bioorganic & Medicinal Chemistry · doi:10.1016/j.bmc.2020.115781 · Cited by 7
Reed, C. R., Kennedy, S. D., Horowitz, R. H., Puthenpeedikakkal, A. M. K., Stern, H. A., & Mathews, D. H. (2024) · The Journal of Physical Chemistry B · doi:10.1021/acs.jpcb.4c06262 · Cited by 6
Chen, B., Fountain, G., Sullivan, H.-J., Paradis, N. J., & Wu, C. F. (2020) · Physical Chemistry Chemical Physics · doi:10.1039/d0cp03863f · Cited by 7
G4-Attention: Deep Learning Model with Attention for predicting DNA G-QuadruplexesPreprint
Mukherjee, S., Pramanik, P., Basuchowdhuri, P., & Bhattacharya, S. (2024) · bioRxiv (Cold Spring Harbor Laboratory) · doi:10.1101/2024.11.04.621797 · Cited by 6
Molecular recognition and effects of a benzothiazole derivative targeting the MYC G-quadruplex
Ni, X., Hu, X.-D., Long, W., Lan, W.-X., Wang, C., Wong, W.-L., & Cao, C.-Y. (2025) · Nucleic Acids Research · doi:10.1093/nar/gkaf888 · Cited by 4
Park, J., Lee, H., Oliva, P., Kirsch, K., Kim, B.-R., Ahn, J. I., Alverez, C. N., Gaikwad, S. M., Krausz, K. W., O'Connor, R. A., et al. (2023) · ACS Pharmacology & Translational Science · doi:10.1021/acsptsci.2c00250 · Cited by 5
Self-citationDutta, A., Banerjee, N., Chaudhuri, M., & Chatterjee, S. (2023) · Springer eBooks · doi:10.1007/978-981-19-8520-1_7 · Cited by 5
Liang, J., Gao, Z., Yang, L.-L., Zhang, W., Chen, M., & Meng, F. (2023) · Antioxidants · doi:10.3390/antiox13010011 · Cited by 5
Oncogenic and telomeric G-quadruplexes: Targets for porphyrin-triphenylphosphonium conjugates
Moura, N. M. M., Guedes, S. D. M., Salvador, D., Oliveira, H., Alves, M., Paradis, N. J., Wu, C. F., Neves, M. G. P. M. S., & Ramos, C. I. V. (2024) · International Journal of Biological Macromolecules · doi:10.1016/j.ijbiomac.2024.134126 · Cited by 5
Štoček, J. R., Bártová, K., Čechová, L., Šála, M., Socha, O., Janeba, Z., & Dračínský, M. (2019) · Chemical Communications · doi:10.1039/c9cc05513d · Cited by 5
Sokulska, M., Nalewaj, M., Czapik, T., Rachwalak, M., & Szabat, M. (2026) · Molecular Therapy — Nucleic Acids · doi:10.1016/j.omtn.2026.102906 · Cited by 6
Pietra, F. (2025) · Medicinal Chemistry Research · doi:10.1007/s00044-025-03403-7 · Cited by 4
G-Quadruplex targeting ligands: A hope and a new horizon in Cancer TherapeuticsPreprint
Banerjee, N., Panda, S., & Chatterjee, S. (2018) · Preprints.org · doi:10.20944/preprints201811.0409.v1 · Cited by 4
Function through shape: An overview of DNA G-quadruplexes in transcriptional regulation.
Nuccio, S. P., Stasi, M., Cadoni, E., & di Antonio, M. (2026) · Current Opinion in Chemical Biology · doi:10.1016/j.cbpa.2026.102718 · Cited by 2
Mouse tumor susceptibility genes identify drug combinations for multiple myeloma
Zhang, S., Dubois, W., Zhang, K., Simmons, J. K., Hughitt, V. K., Gorjifard, S., Gaikwad, S. M., Peat, T. J., & Mock, B. A. (2020) · Journal of Cancer Metastasis and Treatment · doi:10.20517/2394-4722.2020.40 · Cited by 3
Self-citationLauria, A., Monica, G. L., Terenzi, A., Mannino, G., Bonsignore, R., Bono, A., Almerico, A., Barone, G., Gentile, C., & Martorana, A. (2021) · Molecules · doi:10.3390/molecules26144309
Principles of small molecule–DNA recognition
Neidle, S., & Sanderson, M. R. (2021) · Elsevier eBooks · doi:10.1016/b978-0-12-819677-9.00005-6 · Cited by 3
Tetrad-binding ligands do not bind specifically to left-handed G-quadruplexes
Das, P., & Phan, A. T. (2022) · Chemical Communications · doi:10.1039/d2cc03374g · Cited by 4
Liu, L., Wang, K., Liu, W., Zeng, Y., Hou, M., Yang, J., & Mao, Z. (2021) · Angewandte Chemie · doi:10.1002/ange.202106256 · Cited by 2
A Rationally Designed Azobenzene Photoswitch for DNA G‐Quadruplex Regulation in Live Cells
Dudek, M., López‐Pacios, L., Sabouri, N., Nogueira, J. J., Martínez‐Fernández, L., & Deiana, M. (2024) · Angewandte Chemie · doi:10.1002/ange.202413000 · Cited by 2
Sarkar, S., Chatterjee, A., Paul, S., Bisoi, A., Sen, P., & Singh, P. C. (2025) · Journal of Biological Chemistry · doi:10.1016/j.jbc.2025.110753 · Cited by 3
Su, A.-M., Chen, Q., Yu, X.-Y., Lu, W.-J., Wang, D., & Hou, X. (2025) · Journal of Biological Chemistry · doi:10.1016/j.jbc.2025.110897 · Cited by 2
Structure-based drug design of small-molecule c-Myc G-quadruplex binders
Gao, J., Xu, C.-X., Hong, R., Cheng, G., & Jia, P. (2026) · Journal of Computer-Aided Molecular Design · doi:10.1007/s10822-025-00760-8 · Cited by 3
Sharma, P., & Paul, K. (2025) · ACS Applied Bio Materials · doi:10.1021/acsabm.4c01666 · Cited by 2
Microperoxidase-11-induced reconfiguration of G-quadruplex nanostructures.
Massalha, L., Adiram-Filiba, N., & Golub, E. (2025) · International Journal of Biological Macromolecules · doi:10.1016/j.ijbiomac.2025.145509 · Cited by 1
High Flexibility of RNaseH2 Catalytic Activity with Respect to Non-Canonical DNA Structures
Dede, M., Napolitano, S., Melati, A., Pirota, V., Maga, G., & Crespan, E. (2021) · International Journal of Molecular Sciences · doi:10.3390/ijms22105201 · Cited by 2
Bamrah, G. K., Kumari, N., & Srivastava, S. (2024) · Proceedings of the Indian National Science Academy · doi:10.1007/s43538-024-00244-7 · Cited by 1
Paradis, N. J., Clark, A. K., Dutta, A., Gogoj, H., Vaden, T. D., & Wu, C. F. (2024) · Journal of Molecular Liquids · doi:10.1016/j.molliq.2024.124407 · Cited by 1
Structural insights into the binding of CX-5461 and MTR-106 to G-quadruplex DNA
Li, Y., Liu, K., Hu, X. X., Deng, J., Lan, W., Xue, H., Tang, W., & Cao, C. (2026) · Nucleic Acids Research · doi:10.1093/nar/gkag667 · Cited by 1
Neidle, S. (2024) · Annual reports in medicinal chemistry · doi:10.1016/bs.armc.2024.09.005 · Cited by 1
Das, P. (2020) · doi:10.32657/10356/151308
Osello, A. (2001) · PORTO@Iris
Structures of G-Quadruplexes and Their Drug Interactions
Han, Y., Dickerhoff, J., & Yang, D. (2023) · Springer eBooks · doi:10.1007/978-981-16-1313-5_10-1
Stanković, I. M., Zrilić, S. S., Milovanović, B., Stanojević, A., Petković, M., & Etinski, M. (2023) · New Journal of Chemistry · doi:10.1039/d3nj00956d
Structures of G-Quadruplexes and Their Drug Interactions
Han, Y., Dickerhoff, J., & Yang, D. (2023) · Springer eBooks · doi:10.1007/978-981-19-9776-1_10
Sarkar, S., Chatterjee, A., Paul, S., Bisoi, A., Sen, P., & Singh, P. C. (2024) · bioRxiv (Cold Spring Harbor Laboratory) · doi:10.1101/2024.05.21.595106
The Synthesis and Research of Novel Naphthalimide G-Quadruplex Probe Targeting with Hybrid G4sPreprint
Li, S., Gan, L., Luo, W., Cheng, Q., Wan, S., Wu, M., Wang, M., Luo, E., & Luo, X. (2024) · SSRN Electronic Journal · doi:10.2139/ssrn.4865125
Challenges in developing small-molecule quadruplex therapeutics
Neidle, S. (2024) · Annual reports in medicinal chemistry · doi:10.1016/bs.armc.2024.09.010
The synthesis and research of the naphthalimide G-quadruplex probe targeting hybrid G4s
Gan, L., Luo, W., Cheng, Q., Wan, S., Wu, M., Wang, M., Luo, E., Luo, X., & Li, S. (2024) · Results in Chemistry · doi:10.1016/j.rechem.2024.102005
Interaction process behind the strong stabilization of G-quadruplexes by alkaloid fagaronine
Hannig, P., Gargallo, R., Mazzini, S., Borgonovo, G., Zuccolo, M., Táborská, E., & Táborský, P. (2025) · Biophysical Chemistry · doi:10.1016/j.bpc.2025.107443
Vincristine Beyond Mitosis: Uncovering a First Link to G-Quadruplex DNA in Cancer Cells
Porzio, A. D., Persico, C., Romano, F., Barra, A., Aiello, I., D’Auria, L., Abate, S., D’Aria, F., Giancola, C., Cinquegrana, E., et al. (2025) · International Journal of Molecular Sciences · doi:10.3390/ijms26199606
Rafalska, D. Z., Pakuła, J., Borzyszkowska-Bukowska, J., & Potęga, A. (2026) · European Journal of Medicinal Chemistry · doi:10.1016/j.ejmech.2026.119158
Bartosik, A. R., Bujnowska, M., Stovall, D. B., Ratan, A., & Wang, Y. (2026) · Critical Reviews in Biochemistry and Molecular Biology · doi:10.1080/10409238.2026.2710103
Designed NIR-I Emissive and Selective G-Quadruplex DNA Binder with Altered Organelle Specificity
Metangle, S., Gupta, H. K., Das, N., Tiwari, R., & Ranjan, N. (2026) · Biochemistry · doi:10.1021/acs.biochem.6c00048
G-quadruplex structures affect the immune response to bacterial infection in mouse macrophages
Schult, P., Kastl, M. A., Szlapa, J., Symeonidis, K., Maasewerd, S., Franklin, B., Radcke, A., Juranek, S., Abdullah, Z., & Paeschke, K. (2026) · Nature Communications · doi:10.1038/s41467-026-78610-w
BindingDB Entry 50021153: MYC the oncogene from hell: Novel opportunities for cancer therapy.
BindingDB (2025) · UC San Diego · doi:10.7270/q2qz2gkz
Metadata
- Authors
- Calabrese, D. R., Chen, X., Leon, E. C., Gaikwad, S. M., Phyo, Z., Hewitt, W. M., Alden, S., Hilimire, T. A., He, F., Michalowski, A. M., Simmons, J. K., Saunders, L. B., Zhang, S., Connors, D., Walters, K. J., Mock, B. A., & Schneekloth, J. S.
- Affiliations
- National Cancer Institute (US)
- National Institutes of Health (US)
- Corresponding author
- Walters, Kylie J.
- Mock, Beverly A.
- Schneekloth, John S.
- ORCID
- Venue
- Nature Communications
- Published
- 2018-10-12
- Volume
- 9
- Issue
- 1
- Pages
- 4229-4229
- ISSN
- 2041-1723 (ISSN-L)
- PMC
- PMC6185959
- OpenAlex
- W2896637864
- Cited by
- 172
- References
- 72
- Citations by year
- 2026: 8 · 2025: 17 · 2024: 23 · 2023: 23 · 2022: 20 · 2021: 36 · 2020: 25 · 2019: 17 · 2018: 2
- FWCI
- 7.11
- Type
- journal article
- Language
- en
- Open access
- gold
- doi.org
- Locations
- Nature Communications (publishedVersion, cc-by)
- Europe PMC (PubMed Central) (publishedVersion, other-oa)
- PubMed Central (publishedVersion, cc-by)
- PubMed (publishedVersion)
- RePEc: Research Papers in Economics (submittedVersion)
- DOAJ (DOAJ: Directory of Open Access Journals) (submittedVersion)
- DOAJ (DOAJ: Directory of Open Access Journals) (submittedVersion, cc-by-sa)
- Funders
- U.S. Department of Health & Human Services | NIH | National Cancer Institute (1 ZIA BC011065, 1 ZIA BC011490)
- Topics
- Life Sciences › Biochemistry, Genetics and Molecular Biology › Molecular Biology › DNA and Nucleic Acid Chemistry
- Health Sciences › Medicine › Oncology › Metal complexes synthesis and properties
- Life Sciences › Biochemistry, Genetics and Molecular Biology › Molecular Biology › Advanced biosensing and bioanalysis techniques
- Keywords
- c-Myc, G-quadruplex, small-molecule ligands, oncogene promoters, ligand selectivity, structure-activity relationship
- MeSH terms
- Binding Sites, Cell Line, Cell Survival, Humans, Hydrogen Bonding, Magnetic Resonance Spectroscopy, Promoter Regions, Genetic, Protein Binding, Structure-Activity Relationship, Blotting, Western, Molecular Structure, Proto-Oncogene Proteins c-myc, Protein Structure, Secondary, Surface Plasmon Resonance, Cell Line, Tumor, G-Quadruplexes
About these checks
Registry, retraction, Cites and statistics results are computed, not judged, with one exception: a printed reference that no index lists is read once by a model before it counts as a citation error. Claims are extracted by a model and kept only when their quote appears verbatim in the text; each cited source is then checked, with a model’s help, for whether it says what the claim relies on. Those verdicts can be wrong — read the claim’s quote and the cited source before relying on one.
Statistics and arithmetic are recomputed, not judged.
Confidence bands are shown only for fields calibrated on our annotated test set. None is calibrated yet, so no band is shown.
What counts as a claim ›How we measure confidence ›How we check this ›
Are you an author, or do you see a problem with this page? Request a review
