

The DOI matches its Crossref record; 72 of the 72 references it cites were found in a registry or an index.
Patient-derived frontotemporal lobar degeneration brain extracts induce formation and spreading of TDP-43 pathology in vivo
Open accessAbstract
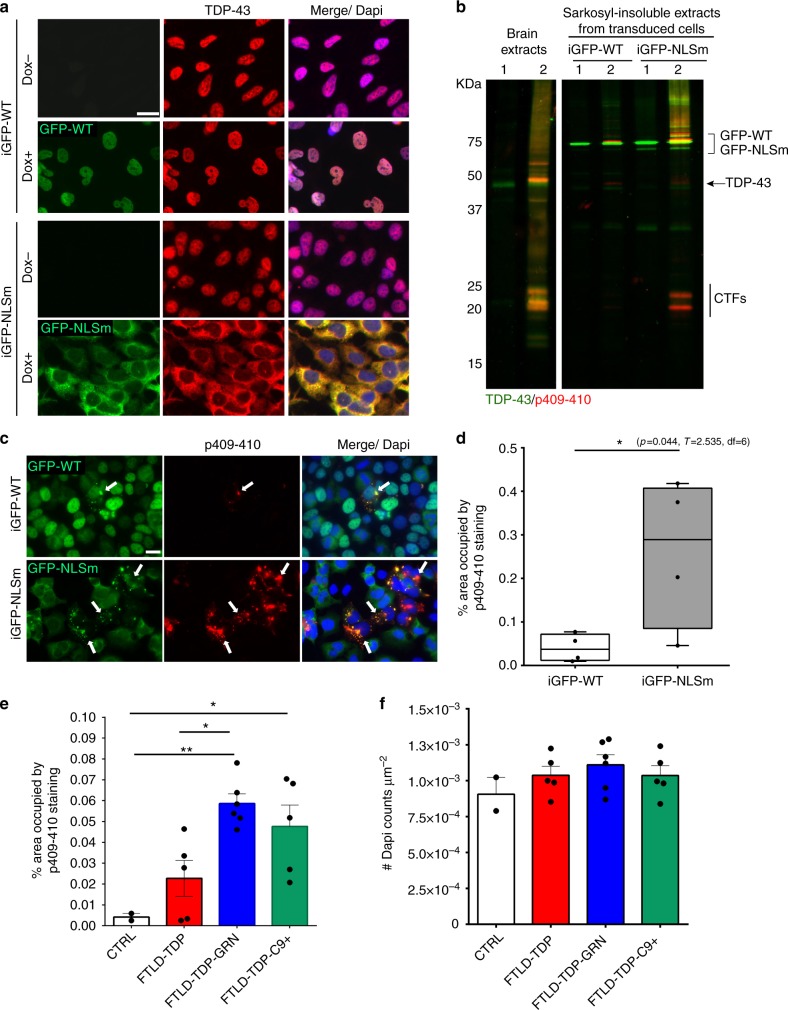
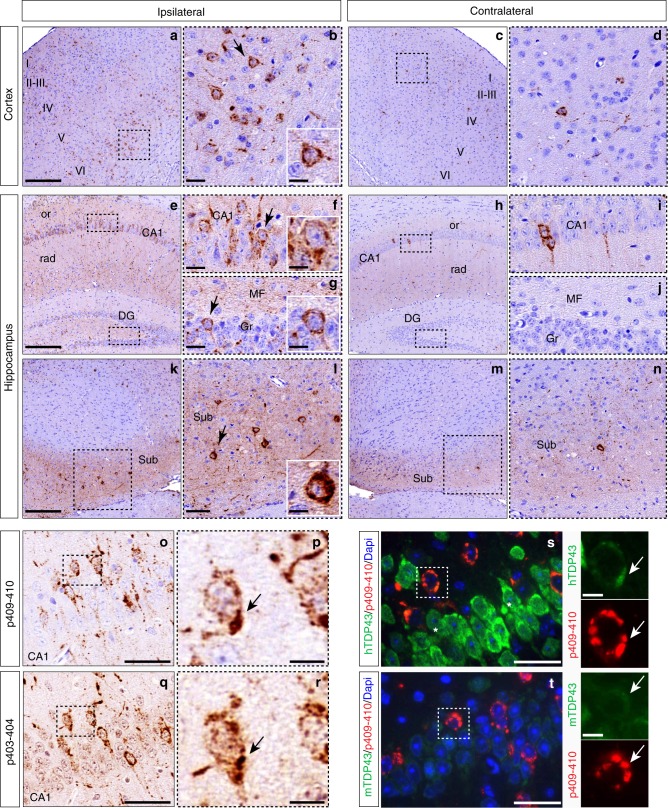
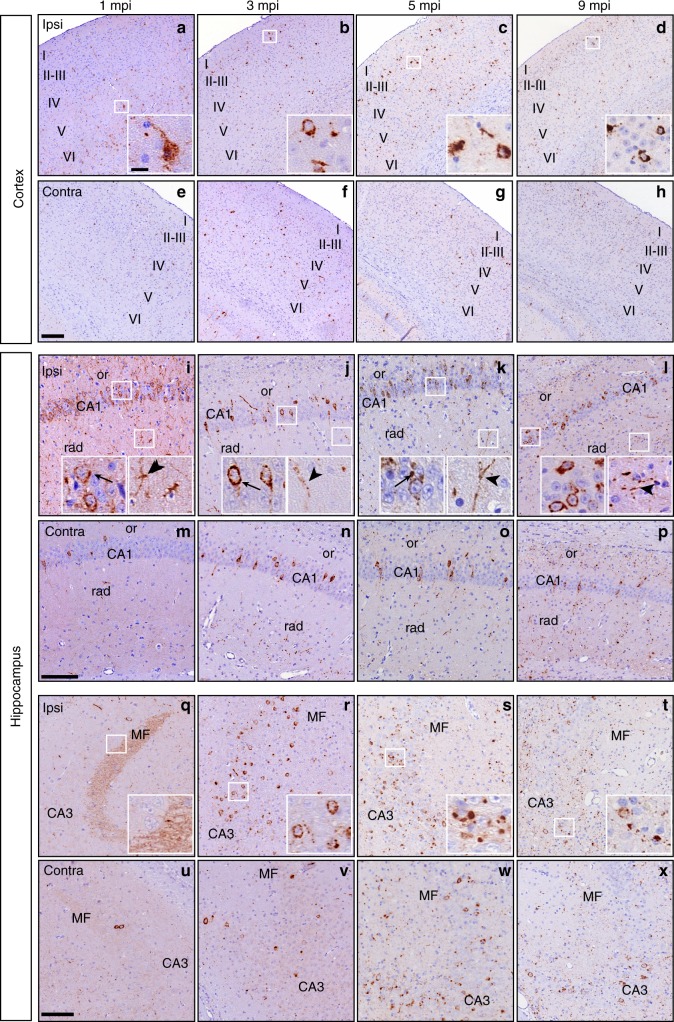
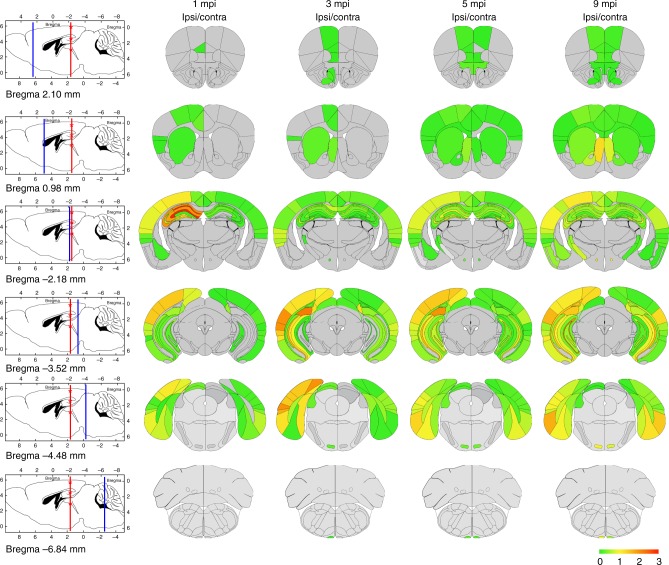
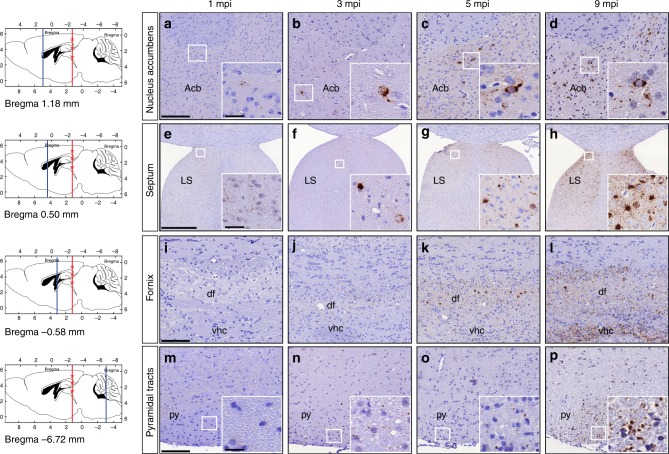
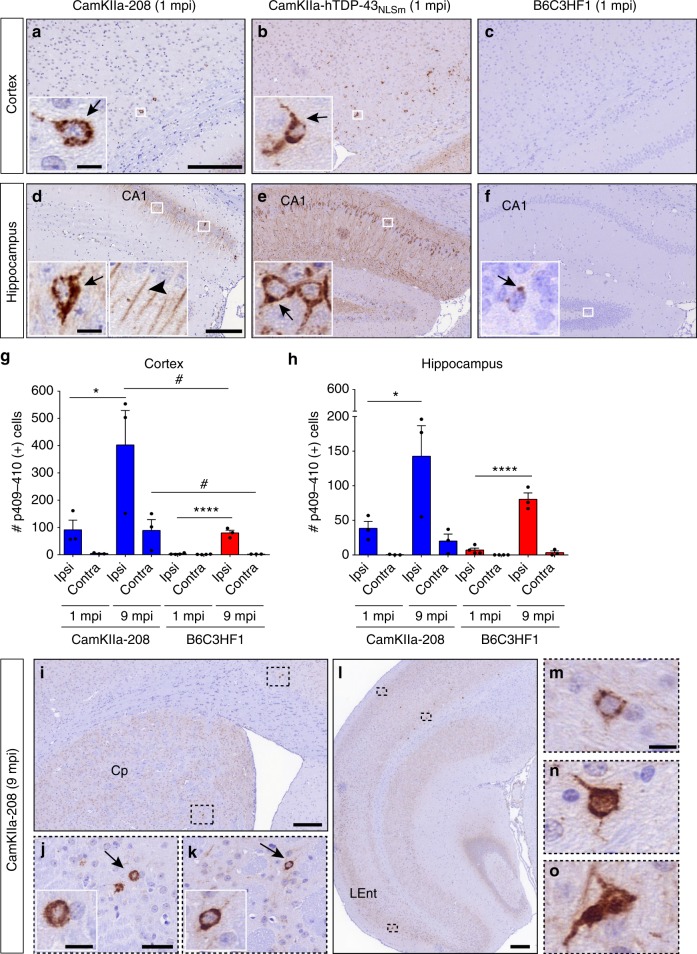
Abstract The stereotypical distribution of TAR DNA-binding 43 protein (TDP-43) aggregates in frontotemporal lobar degeneration (FTLD-TDP) suggests that pathological TDP-43 spreads throughout the brain via cell-to-cell transmission and correlates with disease progression, but no in vivo experimental data support this hypothesis. We first develop a doxycycline-inducible cell line expressing GFP-tagged cytoplasmic TDP-43 protein (iGFP-NLSm) as a cell-based system to screen and identify seeding activity of human brain-derived pathological TDP-43 isolated from sporadic FTLD-TDP and familial cases with Granulin (FTLD-TDP-GRN) or C9orf72 repeat expansion mutations (FTLD-TDP-C9+). We demonstrate that intracerebral injections of biologically active pathogenic FTLD-TDP seeds into transgenic mice expressing cytoplasmic human TDP-43 (lines CamKIIa-hTDP-43 NLSm , rNLS8, and CamKIIa-208) and non-transgenic mice led to the induction of de-novo TDP-43 pathology. Moreover, TDP-43 pathology progressively spreads throughout the brain in a time-dependent manner via the neuroanatomic connectome. Our study suggests that the progression of FTLD-TDP reflects the templated cell-to-cell transneuronal spread of pathological TDP-43.
Overview
The claims and statistics of this paper haven’t been checked yet.
Run the check — free, no account needed. It reads the open-access text and checks the sources it cites.
Integrity signals
Registry
Cites
Statistics
Figures
Verification
Claims the paper makes
The claims and statistics of this paper haven’t been checked yet.
Run the check — free, no account needed. It reads the open-access text and checks the sources it cites.
Claims other papers make about this one
Each is checked against this paper’s own text: does it say what the citing paper says it does?
The source backs part of the claim, not all of it — or backs it for a different population, condition or comparison.
In the citing paper
“The accumulation of pathological protein is detected in some pyramidal neurons in cortical regions that are contralateral to the site of injection.”
From The Role of Retrotransposons and Endogenous Retroviruses in Age-Dependent Neurodegenerative Disorders (2024) · cites this paper as Porta et al. 2018
Experimental — accuracy not yet measuredThe source backs part of the claim, not all of it — or backs it for a different population, condition or comparison.
In the citing paper
“Neuron-to-neuron transfer has also been observed in vivo in response to injection of aggregated human TDP-43 into the cortex of mice that express pan-neuronal human TDP-43 that is already mislocalized to the cytoplasm (Porta et al. 2018).”
From The Role of Retrotransposons and Endogenous Retroviruses in Age-Dependent Neurodegenerative Disorders (2024) · cites this paper as Porta et al. 2018
Experimental — accuracy not yet measured
Self-check
Percentages, sums and reported differences re-computed from the paper’s own numbers.
The self-check needs the paper’s full text.
Citations
Cites
1 retracted
RETRACTED: The RasGAP-associated endoribonuclease G3BP assembles stress granules
Tourrière, H., Chébli, K., Zekri, L., Courselaud, B., Blanchard, J. M., Bertrand, É., & Tazi, J. (2003) · The Journal of Cell Biology · doi:10.1083/jcb.200212128 · Cited by 834
RetractedUbiquitinated TDP-43 in Frontotemporal Lobar Degeneration and Amyotrophic Lateral Sclerosis
Neumann, M., Sampathu, D. M., Kwong, L. K., Truax, A. C., Micsenyi, M. C., Chou, T. T., Bruce, J., Schuck, T., Grossman, M., Clark, C. M., et al. (2006) · Science · doi:10.1126/science.1134108 · Cited by 6,576
Self-citationA mesoscale connectome of the mouse brain
Oh, S. W., Harris, J. A., Ng, L., Winslow, B., Cain, N., Mihalas, S., Wang, Q., Lau, C., Kuan, L., Henry, A. M., et al. (2014) · Nature · doi:10.1038/nature13186 · Cited by 2,612
Luk, K. C., Kehm, V., Carroll, J., Zhang, B., O’Brien, P., Trojanowski, J. Q., & Lee, V. M.-Y. (2012) · Science · doi:10.1126/science.1227157 · Cited by 2,563
Self-citationThe three-dimensional organization of the hippocampal formation: A review of anatomical data
Amaral, D. G., & Witter, M. P. (1989) · Neuroscience · doi:10.1016/0306-4522(89)90424-7 · Cited by 2,180
Li, J.-Y., Englund, E., Holton, J. L., Soulet, D., Hagell, P., Lees, A. J., Lashley, T., Quinn, N. P., Rehncrona, S., Björklund, A., et al. (2008) · Nature Medicine · doi:10.1038/nm1746 · Cited by 1,845
Transmission and spreading of tauopathy in transgenic mouse brain
Clavaguera, F., Bolmont, T., Crowther, R. A., Abramowski, D., Frank, S., Probst, A., Fraser, G., Stalder, A. K., Beibel, M., Staufenbiel, M., et al. (2009) · Nature Cell Biology · doi:10.1038/ncb1901 · Cited by 1,803
Self-Propagating, Molecular-Level Polymorphism in Alzheimer's ß-Amyloid Fibrils
Petkova, A. T., Leapman, R. D., Guo, Z., Yau, W.-M., Mattson, M. P., & Tycko, R. (2005) · Science · doi:10.1126/science.1105850 · Cited by 1,687
Self-propagation of pathogenic protein aggregates in neurodegenerative diseases
Jucker, M., & Walker, L. C. (2013) · Nature · doi:10.1038/nature12481 · Cited by 1,663
Volpicelli-Daley, L. A., Luk, K. C., Patel, T. P., Tanik, S. A., Riddle, D. M., Stieber, A., Meaney, D. F., Trojanowski, J. Q., & Lee, V. M.-Y. (2011) · Neuron · doi:10.1016/j.neuron.2011.08.033 · Cited by 1,569
Self-citation
Research works printed but not linked: 1
- Paxinos, G. & Franklin, K. B. J. The Mouse Brain in Stereotaxic Coordinates 2nd edn (Academic Press, San Diego, CA, 2001).
Cited by
Sorted by citations
Items 101–200 of 256
Seeding-competent TDP-43 persists in human patient and mouse muscle
Lynch, E. M., Pittman, S. K., Daw, J., Ikenaga, C., Chen, S., Dhavale, D. D., Jackrel, M. E., Ayala, Y. M., Kotzbauer, P. T., Ly, C. V., et al. (2024) · Science Translational Medicine · doi:10.1126/scitranslmed.adp5730 · Cited by 24
Ionescu, A., Altman, T., & Perlson, E. (2023) · Molecular Neurodegeneration · doi:10.1186/s13024-023-00623-6 · Cited by 23
Elevated nuclear TDP-43 induces constitutive exon skipping
Carmen-Orozco, R. P., Tsao, W., Ye, Y., Sinha, I. R., Chang, K., Trinh, V. T., Chung, W., Bowden, K., Troncoso, J. C., Blackshaw, S., et al. (2024) · Molecular Neurodegeneration · doi:10.1186/s13024-024-00732-w · Cited by 27
Jiang, L., Zhang, X.-L., & Hu, H. (2024) · International Journal of Molecular Sciences · doi:10.3390/ijms252212380 · Cited by 25
Riku, Y., Seilhean, D., Duyckaerts, C. J., Boluda, S., Iguchi, Y., Ishigaki, S., Iwasaki, Y., Yoshida, M., Sobue, G., & Katsuno, M. (2021) · International Journal of Molecular Sciences · doi:10.3390/ijms22083843 · Cited by 22
Structural Transition, Function and Dysfunction of TDP-43 in Neurodegenerative Diseases
Afroz, T., Pérez‐Berlanga, M., & Polymenidou, M. (2019) · CHIMIA International Journal for Chemistry · doi:10.2533/chimia.2019.380 · Cited by 22
Mechanisms of TDP-43 Proteinopathy Onset and Propagation
Chen, H.-J., & Mitchell, J. C. (2021) · International Journal of Molecular Sciences · doi:10.3390/ijms22116004 · Cited by 25
Genetic architecture of motor neuron diseases
Chaudhary, R., Agarwal, V., Rehman, M., Kaushik, A. S., & Mishra, V. (2021) · Journal of the Neurological Sciences · doi:10.1016/j.jns.2021.120099 · Cited by 24
Tanaka, Y., Ito, S.-I., Honma, Y., Hasegawa, M., Kametani, F., Suzuki, G., Kozuma, L., Takeya, K., & Eto, M. (2023) · Journal of Biological Chemistry · doi:10.1016/j.jbc.2023.105272 · Cited by 23
The prion-like nature of amyotrophic lateral sclerosis
McAlary, L., Yerbury, J. J., & Cashman, N. R. (2020) · Progress in molecular biology and translational science · doi:10.1016/bs.pmbts.2020.07.002 · Cited by 21
Morón-Oset, J., Supèr, T., Eßer, J., Isaacs, A. M., Grönke, S., & Partridge, L. (2019) · Acta Neuropathologica Communications · doi:10.1186/s40478-019-0860-x · Cited by 20
Phenotypic diversity in ALS and the role of poly-conformational protein misfolding
Ayers, J. I., & Borchelt, D. (2020) · Acta Neuropathologica · doi:10.1007/s00401-020-02222-x · Cited by 21
Multi-phaseted problems of TDP-43 in selective neuronal vulnerability in ALS
Asakawa, K., Handa, H., & Kawakami, K. (2021) · Cellular and Molecular Life Sciences · doi:10.1007/s00018-021-03792-z · Cited by 20
Proteostasis impairment and ALS
Lambert-Smith, I. A., Saunders, D. N., & Yerbury, J. J. (2022) · Progress in Biophysics and Molecular Biology · doi:10.1016/j.pbiomolbio.2022.06.001 · Cited by 19
Neuropathology and neuroanatomy of TDP-43 amyotrophic lateral sclerosis
Tredici, K. D., & Braak, H. (2022) · Current Opinion in Neurology · doi:10.1097/wco.0000000000001098 · Cited by 19
LATE‐NC in Alzheimer's disease: Molecular aspects and synergies
Tomé, S. O., Gawor, K., & Thal, D. R. (2023) · Brain Pathology · doi:10.1111/bpa.13213 · Cited by 21
Riku, Y. (2020) · Neuropathology · doi:10.1111/neup.12644 · Cited by 19
Sackmann, C., Sackmann, V., & Hallbeck, M. (2020) · Frontiers in Neuroscience · doi:10.3389/fnins.2020.00540 · Cited by 21
Cuevas, E. P., Martínez‐González, L., Gordillo, C., Tosat‐Bitrián, C., Aranda, C. P. D. L. L., Sáenz, A., Gil, C., Palomo, V., Martín‐Requero, Á., & Martı́nez, A. (2024) · Neurobiology of Disease · doi:10.1016/j.nbd.2024.106430 · Cited by 20
Bajc Česnik, A., Motaln, H., & Rogelj, B. (2020) · Cells · doi:10.3390/cells9081791 · Cited by 17
Yabata, H., Riku, Y., Miyahara, H., Akagi, A., Sone, J., Urushitani, M., Yoshida, M., & Iwasaki, Y. (2023) · International Journal of Molecular Sciences · doi:10.3390/ijms241512176 · Cited by 16
Sequestration of TDP-43 216-414 Aggregates by Cytoplasmic Expression of the proSAAS Chaperone
Peinado, J. R., Chaplot, K., Jarvela, T. S., Barbieri, E. M., Shorter, J., & Lindberg, I. (2022) · ACS Chemical Neuroscience · doi:10.1021/acschemneuro.2c00156 · Cited by 16
Dang, M., Wu, L., & Zhang, X. (2025) · International Journal of Biological Macromolecules · doi:10.1016/j.ijbiomac.2025.141677 · Cited by 16
C. elegans Models to Study the Propagation of Prions and Prion-Like Proteins
Sandhof, C. A., Hoppe, S. O., Tittelmeier, J., & Nussbaum-Krammer, C. I. (2020) · Biomolecules · doi:10.3390/biom10081188 · Cited by 15
Cracco, L., Doud, E. H., Hallinan, G. I., Garringer, H. J., Jacobsen, M. H., Richardson, R. M., Buratti, E., Vidal, R., Ghetti, B. F., & Newell, K. L. (2022) · Neuropathology and Applied Neurobiology · doi:10.1111/nan.12836 · Cited by 15
Tsuboguchi, S., Nakamura, Y., Ishihara, T., Kato, T., Sato, T., Koyama, A., Mori, H., Koike, Y. M., Onodera, O., & Ueno, M. (2023) · Acta Neuropathologica · doi:10.1007/s00401-023-02615-8 · Cited by 14
Frontotemporal dementia-like disease progression elicited by seeded aggregation and spread of FUS
Vazquez‐Sanchez, S., Tilkin, B., Gasset-Rosa, F., Zhang, S., Piol, D., McAlonis‐Downes, M., Artates, J. W., Govea-Perez, N., Verresen, Y., Guo, L. E., et al. (2024) · Molecular Neurodegeneration · doi:10.1186/s13024-024-00737-5 · Cited by 17
Cell-free amplification of prions: Where do we stand?
Cazzaniga, F. A., Luca, C. M. G. D., Bistaffa, E., Consonni, A., Legname, G., Giaccone, G., & Moda, F. (2020) · Progress in molecular biology and translational science · doi:10.1016/bs.pmbts.2020.08.005 · Cited by 14
The unique neuropathological vulnerability of the human brain to aging
Ferrer, I. (2023) · Ageing Research Reviews · doi:10.1016/j.arr.2023.101916 · Cited by 15
Evangelista, B., Cahalan, S. R., Ragusa, J. V., Mordant, A. L., Necarsulmer, J., Perna, R. J., Ajit, T., White, K., Barker, N. K., Tian, X., et al. (2022) · iScience · doi:10.1016/j.isci.2023.106645 · Cited by 13
Targeting amyotrophic lateral sclerosis by neutralizing seeding-competent TDP-43 in CSF
Audrain, M., Egesipe, A.-L., Tentillier, N., Font, L., Ratnam, M., Mottier, L., Clavel, M., Roux-Bourdieu, M. L., Fenyi, A., Ollier, R., et al. (2023) · Brain Communications · doi:10.1093/braincomms/fcad306 · Cited by 13
Hugelier, S., Tang, Q., Kim, H. H.-S., Gyparaki, M., Bond, C., Santiago-Ruiz, A. N., Porta, S., & Lakadamyali, M. (2024) · Nature Methods · doi:10.1038/s41592-024-02414-3 · Cited by 18
Self-citationTDP-43 seeding activity in the olfactory mucosa of patients with amyotrophic lateral sclerosis
Vizziello, M., Dellarole, I. L., Ciullini, A., Pascuzzo, R., Lombardo, A., Bellandi, F., Celauro, L., Battipaglia, C., Ciusani, E., Rizzo, A., et al. (2025) · Molecular Neurodegeneration · doi:10.1186/s13024-025-00833-0 · Cited by 13
Igaz, L. M., Charif, S. E., Vassallu, M., & Salvañal, L. (2021) · Neural Regeneration Research · doi:10.4103/1673-5374.330593 · Cited by 13
Zhao, B., Cowan, C. M., Coutts, J. A., Christy, D., Saraph, A., Hsueh, S. C. C., Plotkin, S. S., Mackenzie, I. R., Kaplan, J. M., & Cashman, N. R. (2023) · Acta Neuropathologica Communications · doi:10.1186/s40478-023-01705-8 · Cited by 12
Prion-like Spreading of Disease in TDP-43 Proteinopathies
Pongrácová, E., Buratti, E., & Romano, M. (2024) · Brain Sciences · doi:10.3390/brainsci14111132 · Cited by 15
Riluzole Exhibits No Therapeutic Efficacy on a Transgenic Rat model of Amyotrophic Lateral Sclerosis
Chen, S., Liao, Q., Lu, K., Zhou, J., Huang, C., & Bi, F. (2020) · Current Neurovascular Research · doi:10.2174/1567202617666200409125227 · Cited by 12
Zhang, R., Chen, Y., Wang, X., Tian, H., Liu, H., Xiang, Z., Qi, D., Huang, J. H., Wu, E., Ding, X., et al. (2020) · International Journal of Biological Sciences · doi:10.7150/ijbs.53872 · Cited by 13
Divergent Histopathological Networks of Frontotemporal Degeneration Proteinopathy Subytpes
Chen, M., Ohm, D. T., Phillips, J. S., McMillan, C. T., Capp, N., Peterson, C., Xie, E., Wolk, D. A., Trojanowski, J. Q., Lee, E. B., et al. (2022) · Journal of Neuroscience · doi:10.1523/jneurosci.2061-21.2022 · Cited by 11
Self-citationOllier, R., Fuchs, A., Gauye, F., Piorkowska, K., Menant, S., Ratnam, M., Montanari, P., Guilhot, F., Phillipe, D., Audrain, M., et al. (2023) · mAbs · doi:10.1080/19420862.2023.2232087 · Cited by 11
Lee, E., Park, H., & Kim, S. (2024) · Molecules and Cells · doi:10.1016/j.mocell.2024.100089 · Cited by 12
Self-citationThe role of microglia in the prion-like transmission of protein aggregates in neurodegeneration
Öztürk, M. M., Emgård, J., García‐Revilla, J., Fernández‐Calle, R., Yang, Y., Deierborg, T., & Roos, T. T. (2025) · Brain Communications · doi:10.1093/braincomms/fcaf087 · Cited by 14
Challenges of modelling TDP-43 pathology in mice
Armas, J. M. B., Taoro‐González, L., Fisher, E., & Acevedo‐Arozena, A. (2025) · Mammalian Genome · doi:10.1007/s00335-025-10131-1 · Cited by 12
Decoding the Cellular Trafficking of Prion-like Proteins in Neurodegenerative Diseases
Hu, C., Yan, Y., Jin, Y., Yang, J. H., Xi, Y., & Zhong, Z. (2023) · Neuroscience Bulletin · doi:10.1007/s12264-023-01115-9 · Cited by 11
Targeting the TDP-43 low complexity domain blocks spreading of pathology in a mouse model of ALS/FTD
Chevalier, E., Audrain, M., Ratnam, M., Ollier, R., Fuchs, A., Piorkowska, K., Pfeifer, A., Kosco‐Vilbois, M. H., Seredenina, T. S., & Afroz, T. (2024) · Acta Neuropathologica Communications · doi:10.1186/s40478-024-01867-z · Cited by 10
Deciphering the prion-like behavior of pathogenic protein aggregates in neurodegenerative diseases
Yoshida, S., & Hasegawa, T. (2022) · Neurochemistry International · doi:10.1016/j.neuint.2022.105307 · Cited by 9
Big versus small: The impact of aggregate size in disease
Hnath, B., Chen, J., Reynolds, J., Choi, E. S., Wang, J., Zhang, D., Sha, C. M., & Dokholyan, N. V. (2023) · Protein Science · doi:10.1002/pro.4686 · Cited by 8
Walkiewicz, G., Ronisz, A., Ospitalieri, S., Tsaka, G., Tomé, S. O., Vandenberghe, R. R., Arnim, C. A. F. V., Rousseau, F., Schymkowitz, J. W. H., Groef, L. D., et al. (2024) · Acta Neuropathologica Communications · doi:10.1186/s40478-024-01907-8 · Cited by 8
A Next-Generation Sequencing Study in a Cohort of Sicilian Patients with Parkinson’s Disease
Salemi, M., Lanza, G., Salluzzo, M. G., Schillaci, F. A., Blasi, F. D. D., Cordella, A., Caniglia, S., Lanuzza, B., Morreale, M., Marano, P., et al. (2023) · Biomedicines · doi:10.3390/biomedicines11123118 · Cited by 10
Is semantic dementia an outdated entity?
Belliard, S., & Merck, C. (2024) · Cortex · doi:10.1016/j.cortex.2024.09.002 · Cited by 8
Computational Insights Into the Mechanism of EGCG's Binding and Inhibition of the TDP‐43 Aggregation
Meshram, V. D., Balaji, R., Saravanan, P., Subbamanda, Y., Deeksha, W., Bajpai, A., Joshi, H., Bhargava, A., & Patel, B. K. (2024) · Chemical Biology & Drug Design · doi:10.1111/cbdd.14640 · Cited by 8
TDP-43 shapeshifts to encipher FTD severity
Barbieri, E. M., & Shorter, J. (2018) · Nature Neuroscience · doi:10.1038/s41593-018-0299-6 · Cited by 8
Picard, F., Nonaka, T., Belotti, E., Osseni, A., Errazuriz-Cerda, E., Jost-Mousseau, C., Bernard, E., Conjard‐Duplany, A., Bohl, D., Hasegawa, M., et al. (2025) · Cellular and Molecular Life Sciences · doi:10.1007/s00018-025-05589-w · Cited by 7
Liquid–liquid phase separation in neurodegenerative diseases
Haider, R., Boyko, S., & Surewicz, W. K. (2022) · Elsevier eBooks · doi:10.1016/b978-0-12-823967-4.00018-x · Cited by 7
Pasquini, L., Pereira, F. L., Seddighi, S., Zeng, Y., Wei, Y., Illán‐Gala, I., Vatsavayai, S. C., Friedberg, A., Lee, A. J., Brown, J. A., et al. (2024) · Brain · doi:10.1093/brain/awae205 · Cited by 8
Mori, H., Sato, T., Tsuboguchi, S., Takahashi, M., Nakamura, Y., Hoshina, K., Kato, T., Fujii, M., Onodera, O., & Ueno, M. (2025) · Neurobiology of Disease · doi:10.1016/j.nbd.2025.106988 · Cited by 7
Unexpected postmortem diagnoses in cases of clinically diagnosed amyotrophic lateral sclerosis
Riku, Y., Yoshida, M., Tamura, T., Kamijo, M., Yasui, K., Kameyama, T., Katsuno, M., Sobue, G., & Iwasaki, Y. (2021) · Neuropathology · doi:10.1111/neup.12744 · Cited by 7
Multi-shell diffusion MRI of the fornix as a biomarker for cognition in Alzheimer's disease
Sakaie, K., Koenig, K. A., Lerner, A. J., Appleby, B. S., Ogrocki, P. K., Pillai, J. A., Rao, S. M., Leverenz, J. B., & Lowe, M. J. (2024) · Magnetic Resonance Imaging · doi:10.1016/j.mri.2024.03.030 · Cited by 6
Otero, P. C., Todd, T. W., Shao, W., Jones, C. J., Huang, K., Daughrity, L. M., Yue, M., Sheth, U., Gendron, T. F., Prudencio, M., et al. (2024) · PLoS ONE · doi:10.1371/journal.pone.0298080 · Cited by 6
A molecular view of amyotrophic lateral sclerosis through the lens of interaction network modules
Jensen, K. H., Stalder, A. K., Wernersson, R., Roloff, T. C., Hansen, D. H., & Groenen, P. M. A. (2022) · PLoS ONE · doi:10.1371/journal.pone.0268159 · Cited by 6
Experimental models of prion‐like protein propagation
Hasegawa, M. (2020) · Neuropathology · doi:10.1111/neup.12656 · Cited by 5
An ALS-associated TARDBP mutation drives cryptic exon inclusion and RNA dysregulationPreprint
Zhang, Q., Liu, M., Fan, X., Chin, N. Y., Xu, Y., Suh, J., Amniouel, S., Virga, J., Jones, B., Linask, K. L., et al. (2025) · bioRxiv (Cold Spring Harbor Laboratory) · doi:10.1101/2025.11.09.687455 · Cited by 11
Self-citationSomatic mosaicism in ALS and FTD identifies focal mutations associated with widespread degeneration
Zhou, Z., Kim, J., Huang, A. Y., Nolan, M., Park, J., Doan, R. N., Shin, T., Miller, M. B., Bae, M., Zhao, B., et al. (2026) · Nature Genetics · doi:10.1038/s41588-026-02570-6 · Cited by 9
Self-citationdel Val, G., Gauye, F., Audrain, M., Menant, S., Ratnam, M., Chevalier, E., Ollier, R., Bhatia, D., Seredenina, T. S., Afroz, T., et al. (2025) · Molecular Therapy · doi:10.1016/j.ymthe.2025.06.026 · Cited by 5
Antemortem network analysis of spreading pathology in autopsy-confirmed frontotemporal degeneration
Chen, M., Burke, S., Olm, C. A., Irwin, D. J., Massimo, L. M., Lee, E. B., Trojanowski, J. Q., Gee, J. C., & Grossman, M. (2023) · Brain Communications · doi:10.1093/braincomms/fcad147 · Cited by 4
Self-citationTDP-43 Aggregate Seeding Impairs Autoregulation and Causes TDP-43 DysfunctionPreprint
Mamede, L. D., Hu, M., Titus, A. R., Vaquer‐Alicea, J., French, R. L., Diamond, M. I., Miller, T. M., & Ayala, Y. M. (2025) · bioRxiv (Cold Spring Harbor Laboratory) · doi:10.1101/2025.02.11.637743 · Cited by 5
Mamede, L. D., Hu, M., Vaquer‐Alicea, J., Titus, A. R., dos Passos, P. M., Lantelme, E., French, R. L., Kirschner, P. A., Diamond, M. I., Miller, T. M., et al. (2026) · PLoS Biology · doi:10.1371/journal.pbio.3003662 · Cited by 5
Zheng, X., Wang, M., He, Q., Chen, S., Simayi, D., Ma, X., Zhao, J., Sun, X., Yang, P., Mao, Q., et al. (2024) · Journal of Neuropathology & Experimental Neurology · doi:10.1093/jnen/nlae042 · Cited by 4
Role of Triggers on the Structural and Functional Facets of TAR DNA-binding Protein 43
Camilus, N. S., Arias, C. Q., & Martić, S. (2022) · Neuroscience · doi:10.1016/j.neuroscience.2022.11.027 · Cited by 4
Protein Aggregation in Amyotrophic Lateral Sclerosis
Chisholm, C. G., Yerbury, J. J., & McAlary, L. (2021) · Wiley eBooks · doi:10.1002/9781119745532.ch6 · Cited by 5
Lysosomal escape and TMEM106B fibrillar core determine TDP-43 seeding outcomesPreprint
Zhong, W., Scialò, C., Gatta, B., Haefliger, M. A., Leu, N., Lurati, F., Peter, M., Ramesh, N., Roschitzki, B., Jagannath, S., et al. (2025) · bioRxiv (Cold Spring Harbor Laboratory) · doi:10.64898/2025.12.19.695531 · Cited by 7
Exploring Protein Misfolding in Amyotrophic Lateral Sclerosis: Structural and Functional Insights
Ivantsik, O., Exarchos, T. P., Vrahatis, A. G., Vlamos, P., & Krokidis, M. G. (2025) · Biomedicines · doi:10.3390/biomedicines13051146 · Cited by 3
Dellarole, I. L., Lombardo, A., Ciullini, A., Cazzaniga, F. A., Domina, R., Bacınoğlu, M. B., & Moda, F. (2025) · Sub-cellular biochemistry/Subcellular biochemistry · doi:10.1007/978-3-031-97055-9_13 · Cited by 3
Elucidation of Molecular Mechanisms of Lipid-Altered Cytotoxicity of TDP-43 Fibrils
Purvinsh, Y., Matveyenka, M., & Kurouski, D. (2026) · ACS Chemical Neuroscience · doi:10.1021/acschemneuro.5c00934 · Cited by 3
Recent advances on the molecular pathogenesis of prion diseases
Glatzel, M., & Sigurdson, C. J. (2018) · Brain Pathology · doi:10.1111/bpa.12693 · Cited by 3
The prion-like effect and prion-like protein targeting strategy in amyotrophic lateral sclerosis
Wenzhi, Y., Xiangyi, L., & Dongsheng, F. (2024) · Heliyon · doi:10.1016/j.heliyon.2024.e34963 · Cited by 3
Hemiplegic-type ALS: clinicopathological features of two autopsied patients
Sainouchi, M., Tanaka, H., Shimizu, H., Mashima, T., Fukushima, T., Hatano, Y., Ishihara, T., Makino, K., Onodera, O., & Kakita, A. (2021) · Journal of Neurology Neurosurgery & Psychiatry · doi:10.1136/jnnp-2021-326257 · Cited by 3
Photo-Oxygenation: An Innovative New Therapeutic Approach Against Amyloidoses
Ikeda, T., Hori, Y., Sohma, Y., Kanai, M., & Tomita, T. (2021) · Advances in experimental medicine and biology · doi:10.1007/978-3-030-78787-5_52 · Cited by 3
Chang, Y., & Dubnau, J. (2022) · bioRxiv (Cold Spring Harbor Laboratory) · doi:10.1101/2022.07.20.500816 · Cited by 3
Zhou, Z., Kim, J., Huang, A. Y., Nolan, M., Park, J., Doan, R. N., Shin, T., Miller, M. B., Bae, M., Zhao, B., et al. (2023) · bioRxiv (Cold Spring Harbor Laboratory) · doi:10.1101/2023.11.30.569436 · Cited by 3
Self-citationZhan, A., Zhong, K., & Zhang, K. (2025) · Biochemical and Biophysical Research Communications · doi:10.1016/j.bbrc.2025.151582 · Cited by 2
A tribute to John Q. Trojanowski (1946–2022), neuropathologist extraordinaire
Goedert, M., & Spillantini, M. G. (2022) · Brain Pathology · doi:10.1111/bpa.13066 · Cited by 2
Tanaka, H., Hird, M. A., Tang‐Wai, D. F., & Kovács, G. G. (2022) · Journal of Neuropathology & Experimental Neurology · doi:10.1093/jnen/nlac117 · Cited by 2
Endogenous retroviruses can propagate TDP-43 proteinopathy
Ferreiro, M. E., & Faulkner, G. J. (2023) · Trends in Neurosciences · doi:10.1016/j.tins.2023.03.011 · Cited by 2
Tanaka, Y., Kozuma, L., Hino, H., Takeya, K., & Eto, M. (2024) · Biochemistry and Biophysics Reports · doi:10.1016/j.bbrep.2024.101705 · Cited by 2
A tribute to John Q. Trojanowski (1946–2022)
Irwin, D. J., & Lee, E. B. (2022) · Journal of Clinical Investigation · doi:10.1172/jci161019 · Cited by 2
Self-citationVCP Protects Neurons from Proteopathic SeedingPreprint
Zhu, J., Pittman, S. K., Dhavale, D. D., French, R. L., Patterson, J. N., Kaleelurrrahuman, M. S., Sun, Y., Buscher, W. J., Bieschke, J., Kotzbauer, P. T., et al. (2021) · bioRxiv (Cold Spring Harbor Laboratory) · doi:10.1101/2021.07.12.452081 · Cited by 2
Meshram, V. D., Balaji, R., Saravanan, P., Subbamanda, Y., Deeksha, W., Bajpai, A., Joshi, H., Bhargava, A., & Patel, B. K. (2023) · bioRxiv (Cold Spring Harbor Laboratory) · doi:10.1101/2023.12.22.573011 · Cited by 2
Uncovering Critical Roles for RNA in Neurodegeneration.
Ayala, Y. M. (2023) · PubMed Central · Cited by 1
Wang, D., Ta, V., Wang, H., Ju, J., Wang, C., Chehadeh, C., Torreblanca-Zanca, A., Magaña, Y., Castle, M. J., Wang, S., et al. (2026) · Alzheimer s & Dementia · doi:10.1002/alz.71450 · Cited by 1
Prion-like Protein TDP-43: Mechanisms, Diagnosis, and Therapeutic Prospects
Shimamura, M. I., & Satoh, K. (2026) · Pathogens · doi:10.3390/pathogens15090890 · Cited by 1
Dhénain, M. (2021) · Bulletin de l Académie Nationale de Médecine · doi:10.1016/j.banm.2021.04.018 · Cited by 1
Prion-like behavior of TDP-43 aggregates and its implication to disease
Srivastava, A., Admane, N., Yadav, S. P. S., & Kukrety, H. (2021) · Elsevier eBooks · doi:10.1016/b978-0-12-820066-7.00004-7 · Cited by 1
McAlary, L., Plotkin, S. S., Yerbury, J. J., & Cashman, N. R. (2020) · Frontiers in Molecular Neuroscience · doi:10.3389/fnmol.2019.00311 · Cited by 1
RNA-deficient TDP-43 causes loss of free nuclear TDP-43 by sequestrationPreprint
Keating, S. S., Bademosi, A. T., Gil, R. S., & Walker, A. K. (2022) · bioRxiv (Cold Spring Harbor Laboratory) · doi:10.1101/2022.09.06.506721 · Cited by 1
FTLD targets brain regions expressing recently evolved genesPreprint
Pasquini, L., Pereira, F. L., Seddighi, S., Zeng, Y., Wei, Y., Illán‐Gala, I., Vatsavayai, S. C., Friedberg, A., Lee, A. J., Brown, J. A., et al. (2023) · medRxiv · doi:10.1101/2023.10.27.23297687 · Cited by 1
En Masse Analysis of Genetic Modifiers Informs Players and Processes in ALS
Bonini, N. M. (2018) · Neuroscience · doi:10.1016/j.neuroscience.2018.11.023
Investigation of the intercellular transmission of α-synuclein, amyloid-β and TDP-43
Sackmann, C. (2019) · Linköping University medical dissertations · doi:10.3384/diss.diva-160318
anti NN reactions and meson resonances
Fields, T. H., Jackson, J. D., Roberts, A. M., & Donaldson, R. (1972)
A Molecular View of Amyotrophic Lateral Sclerosis Through the Lens of Interaction Network ModulesPreprint
Jensen, K. H., Stalder, A. K., Wernersson, R., Roloff, T. C., Hansen, D. H., & Groenen, P. M. A. (2021) · Research Square · doi:10.21203/rs.3.rs-656827/v2
Metadata
- Authors
- Porta, S., Xu, Y., Restrepo, C. R., Kwong, L. K., Zhang, B., Brown, H. J., Lee, E. B., Trojanowski, J. Q., & Lee, V. M.-Y.
- Affiliations
- University of Pennsylvania (US)
- Corresponding author
- Lee, Virginia M.-Y.
- ORCID
- Venue
- Nature Communications
- Published
- 2018-10-11
- Volume
- 9
- Issue
- 1
- Pages
- 4220-4220
- ISSN
- 2041-1723 (ISSN-L)
- PMC
- PMC6181940
- OpenAlex
- W2894965458
- Cited by
- 248
- References
- 72
- Citations by year
- 2026: 19 · 2025: 21 · 2024: 37 · 2023: 40 · 2022: 31 · 2021: 39 · 2020: 29 · 2019: 24 · 2018: 7
- FWCI
- 16.81
- Type
- journal article
- Language
- en
- Open access
- gold
- doi.org
- Locations
- Nature Communications (publishedVersion, cc-by)
- Europe PMC (PubMed Central) (publishedVersion, other-oa)
- PubMed Central (publishedVersion, cc-by)
- PubMed (publishedVersion)
- RePEc: Research Papers in Economics (submittedVersion)
- DOAJ (DOAJ: Directory of Open Access Journals) (submittedVersion)
- DOAJ (DOAJ: Directory of Open Access Journals) (submittedVersion, cc-by-sa)
- Funders
- U.S. Department of Health & Human Services | NIH | National Institute on Aging (AG10124, AG17586)
- Wyncote Foundation Biogen
- Topics
- Health Sciences › Medicine › Clinical Neurology › Amyotrophic Lateral Sclerosis Research
- Life Sciences › Neuroscience › Cellular and Molecular Neuroscience › Alzheimer's disease research and treatments
- Life Sciences › Biochemistry, Genetics and Molecular Biology › Molecular Biology › Prion Diseases and Protein Misfolding
- Keywords
- frontotemporal lobar degeneration, TDP-43, FTLD-TDP, cell-to-cell transmission, transneuronal spread, seeding activity, prion-like propagation, granulin, C9orf72 repeat expansion, transgenic mouse model, disease progression
- MeSH terms
- Animals, Brain, Cytoplasm, DNA-Binding Proteins, Hippocampus, Humans, Neurons, Tissue Extracts, Mice, Frontotemporal Lobar Degeneration
About these checks
Registry, retraction, Cites and statistics results are computed, not judged, with one exception: a printed reference that no index lists is read once by a model before it counts as a citation error. Claims are extracted by a model and kept only when their quote appears verbatim in the text; each cited source is then checked, with a model’s help, for whether it says what the claim relies on. Those verdicts can be wrong — read the claim’s quote and the cited source before relying on one.
Statistics and arithmetic are recomputed, not judged.
Confidence bands are shown only for fields calibrated on our annotated test set. None is calibrated yet, so no band is shown.
What counts as a claim ›How we measure confidence ›How we check this ›
Are you an author, or do you see a problem with this page? Request a review
