

The DOI matches its Crossref record; 55 of the 56 references it cites were found in a registry or an index.
Genome-wide association study of body fat distribution identifies adiposity loci and sex-specific genetic effects
Open accessPublished version of a preprint
Abstract
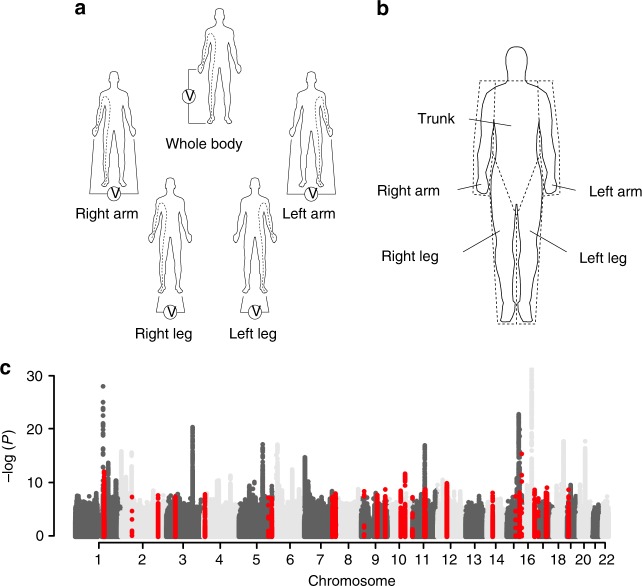
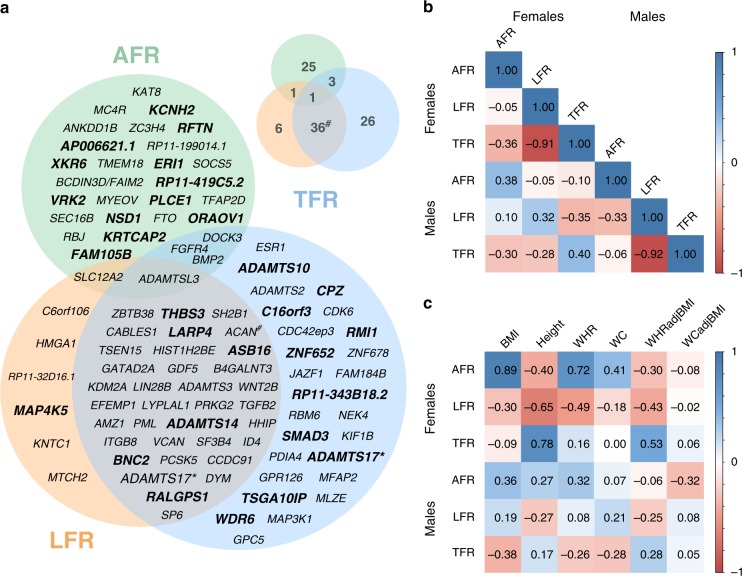
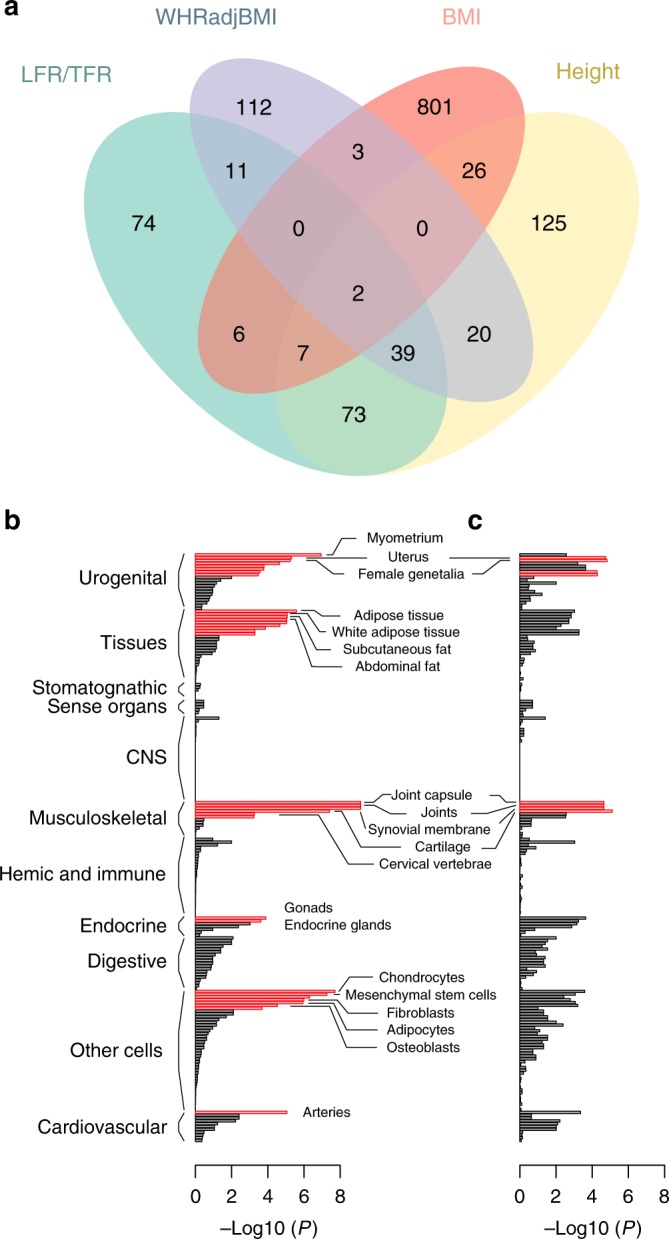
Body mass and body fat composition are of clinical interest due to their links to cardiovascular- and metabolic diseases. Fat stored in the trunk has been suggested to be more pathogenic compared to fat stored in other compartments. In this study, we perform genome-wide association studies (GWAS) for the proportion of body fat distributed to the arms, legs and trunk estimated from segmental bio-electrical impedance analysis (sBIA) for 362,499 individuals from the UK Biobank. 98 independent associations with body fat distribution are identified, 29 that have not previously been associated with anthropometric traits. A high degree of sex-heterogeneity is observed and the effects of 37 associated variants are stronger in females compared to males. Our findings also implicate that body fat distribution in females involves mesenchyme derived tissues and cell types, female endocrine tissues as well as extracellular matrix maintenance and remodeling.
Overview
The claims and statistics of this paper haven’t been checked yet.
Run the check — free, no account needed. It reads the open-access text and checks the sources it cites.
Integrity signals
Registry
Cites
Statistics
Figures
Verification
Claims the paper makes
The claims and statistics of this paper haven’t been checked yet.
Run the check — free, no account needed. It reads the open-access text and checks the sources it cites.
Claims other papers make about this one
Each is checked against this paper’s own text: does it say what the citing paper says it does?
The source backs part of the claim, not all of it — or backs it for a different population, condition or comparison.
In the citing paper
“Importantly, the genetic factors that help determine fat distribution are largely distinct from those that affect overall adiposity as estimated by BMI.78,94”
From Definition and diagnostic criteria of clinical obesity (2025) · cites this paper as [94]
Experimental — accuracy not yet measuredThe check wasn’t confident either way, so it gives no verdict — never disputed.
In the citing paper
“Genome-wide association studies have identified several hundred common variants that influence food intake, basal metabolic rate, and the energy used during a fixed amount of exercise.92–94”
From Definition and diagnostic criteria of clinical obesity (2025) · cites this paper as [94]
Experimental — accuracy not yet measured
Self-check
Percentages, sums and reported differences re-computed from the paper’s own numbers.
The self-check needs the paper’s full text.
Citations
Cites
1 retracted
Ezzat, S., Zheng, L., Florez, J., Stefan, N., Mayr, T., Hliang, M., Jablonski, K., Harden, M. V., Stančáková, A., Laakso, M., et al. (2013) · Cell Metabolism · doi:10.1016/j.cmet.2013.05.002 · Cited by 24
RetractedControlling the False Discovery Rate: A Practical and Powerful Approach to Multiple Testing
Benjamini, Y., & Hochberg, Y. (1995) · Journal of the Royal Statistical Society Series B: Statistical Methodology · doi:10.1111/j.2517-6161.1995.tb02031.x · Cited by 109,482
A global reference for human genetic variation
The 1000 Genomes Project Consortium, authors, C., Auton, A., Abecasis, G. R., Steering committee, Altshuler, D. M., Durbin, R. M., Abecasis, G. R., Bentley, D. R., Chakravarti, A., et al. (2015) · Nature · doi:10.1038/nature15393 · Cited by 18,247
Ng, M., Fleming, T., Robinson, M., Thomson, B., Graetz, N., Margono, C., Mullany, E. C., Biryukov, S., Abbafati, C., Abera, S. F., et al. (2014) · The Lancet · doi:10.1016/s0140-6736(14)60460-8 · Cited by 11,952
(1998) · PsycEXTRA Dataset · doi:10.1037/e565682010-001 · Cited by 9,453
Health effects of overweight and obesity in 195 countries over 25 years
Collaborators, T. G. 2. O. (2017) · New England Journal of Medicine · doi:10.1056/nejmoa1614362 · Cited by 7,918
SIFT: predicting amino acid changes that affect protein function
Ng, P. C. (2003) · Nucleic Acids Research · doi:10.1093/nar/gkg509 · Cited by 6,601
LD Score regression distinguishes confounding from polygenicity in genome-wide association studies
Schizophrenia Working Group of the Psychiatric Genomics Consortium, Bulik-Sullivan, B. K., Loh, P.-R., Finucane, H. K., Ripke, S., Yang, J., Patterson, N., Daly, M. J., Price, A. L., & Neale, B. M. (2015) · Nature Genetics · doi:10.1038/ng.3211 · Cited by 5,559
METAL: fast and efficient meta-analysis of genomewide association scans
Willer, C. J., Li, Y., & Abecasis, G. R. (2010) · Bioinformatics · doi:10.1093/bioinformatics/btq340 · Cited by 5,205
Cited by
Sorted by citations
Definition and diagnostic criteria of clinical obesity
Rubino, F., Cummings, D. E., Eckel, R. H., Cohen, R. V., Wilding, J. P. H., Brown, W. A., Stanford, F. C., Batterham, R. L., Farooqi, I. S., Farpour-Lambert, N. J., et al. (2025) · The Lancet Diabetes & Endocrinology · doi:10.1016/s2213-8587(24)00316-4 · Cited by 1,811
Deciphering osteoarthritis genetics across 826,690 individuals from 9 populations
Boer, C. G., Hatzikotoulas, K., Southam, L., Stefánsdóttir, L., Zhang, Y., de Almeida, R. C., Wu, T. T., Zheng, J., Hartley, A. E., Teder‐Laving, M., et al. (2021) · Cell · doi:10.1016/j.cell.2021.07.038 · Cited by 453
Larsson, S. C., Bäck, M., Rees, J. M. B., Mason, A. M., & Burgess, S. (2020) · European Heart Journal · doi:10.1093/eurheartj/ehz388 · Cited by 436
Metabolically Healthy Obesity: Criteria, Epidemiology, Controversies, and Consequences
Tsatsoulis, A. A., & Paschou, S. Α. (2020) · Current Obesity Reports · doi:10.1007/s13679-020-00375-0 · Cited by 272
Common genetic variation influencing human white matter microstructure
Zhao, B., Li, T., Yang, Y., Wang, X., Luo, T., Shan, Y., Zhu, Z., Xiong, D., Hauberg, M. E., Bendl, J. M., et al. (2021) · Science · doi:10.1126/science.abf3736 · Cited by 222
Metadata
- Authors
- Rask-Andersen, M., Karlsson, T., Ek, W. E., & Johansson, Å.
- Affiliations
- Uppsala University (SE)
- Corresponding author
- Johansson, Åsa
- Venue
- Nature Communications
- Published
- 2019-01-21
- Volume
- 10
- Issue
- 1
- Pages
- 339-339
- ISSN
- 2041-1723 (ISSN-L)
- PMC
- PMC6341104
- OpenAlex
- W2908665501
- Cited by
- 245
- References
- 56
- Citations by year
- 2026: 17 · 2025: 25 · 2024: 22 · 2023: 37 · 2022: 63 · 2021: 41 · 2020: 29 · 2019: 11
- FWCI
- 21.70
- Type
- journal article
- Language
- en
- Open access
- gold
- doi.org
- Locations
- Nature Communications (publishedVersion, cc-by)
- Europe PMC (PubMed Central) (publishedVersion, other-oa)
- PubMed Central (publishedVersion, cc-by)
- PubMed (publishedVersion)
- KTH Publication Database DiVA (KTH Royal Institute of Technology) (submittedVersion, other-oa)
- RePEc: Research Papers in Economics (submittedVersion)
- DOAJ (DOAJ: Directory of Open Access Journals) (submittedVersion)
- DOAJ (DOAJ: Directory of Open Access Journals) (submittedVersion, cc-by-sa)
- Funders
- Åke Wiberg Stiftelse
- Svenska Sällskapet för Medicinsk Forskning
- Hjärt-Lungfonden
- Medical Research Council (MC_PC_17228)
- Uppsala Multidisciplinary Center for Advanced Computational Science
- Topics
- Life Sciences › Biochemistry, Genetics and Molecular Biology › Genetics › Genetic Associations and Epidemiology
- Life Sciences › Biochemistry, Genetics and Molecular Biology › Genetics › Genetics and Physical Performance
- Health Sciences › Medicine › Physiology (medical) › Body Composition Measurement Techniques
- Keywords
- body fat distribution, trunk fat, sex-specific genetic effects, segmental bioelectrical impedance analysis, anthropometric traits, mesenchyme, extracellular matrix remodeling, obesity genetics
- MeSH terms
- Adipose Tissue, Anthropometry, Arm, Body Weight, Endocrine Glands, Female, Gene Expression Regulation, United Kingdom, Humans, Leg, Male, Obesity, Sex Factors, Body Mass Index, Electric Impedance, Biological Specimen Banks, Genetic Heterogeneity, Polymorphism, Single Nucleotide, Gene Expression Profiling, Waist-Hip Ratio, Body Fat Distribution, Genome-Wide Association Study, Genetic Loci, Torso
About these checks
Registry, retraction, Cites and statistics results are computed, not judged, with one exception: a printed reference that no index lists is read once by a model before it counts as a citation error. Claims are extracted by a model and kept only when their quote appears verbatim in the text; each cited source is then checked, with a model’s help, for whether it says what the claim relies on. Those verdicts can be wrong — read the claim’s quote and the cited source before relying on one.
Statistics and arithmetic are recomputed, not judged.
Confidence bands are shown only for fields calibrated on our annotated test set. None is calibrated yet, so no band is shown.
What counts as a claim ›How we measure confidence ›How we check this ›
Are you an author, or do you see a problem with this page? Request a review
