

The DOI matches its Crossref record; 50 of the 51 references it cites were found in a registry or an index.
Approximate Bayesian computation with deep learning supports a third archaic introgression in Asia and Oceania
Open accessAbstract
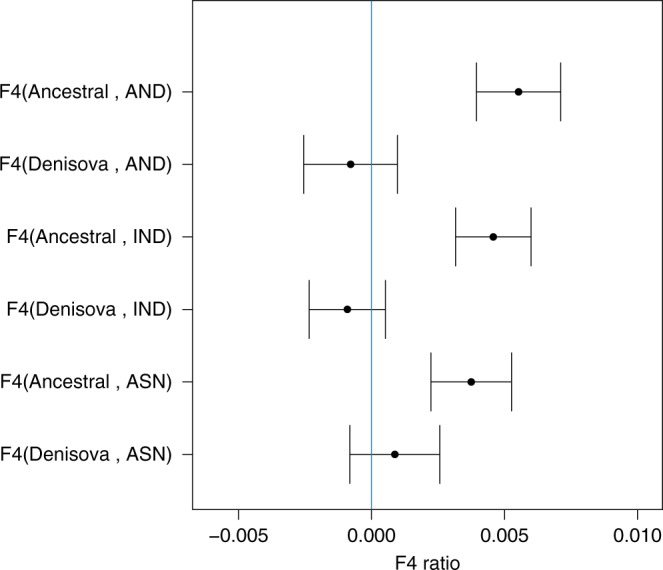
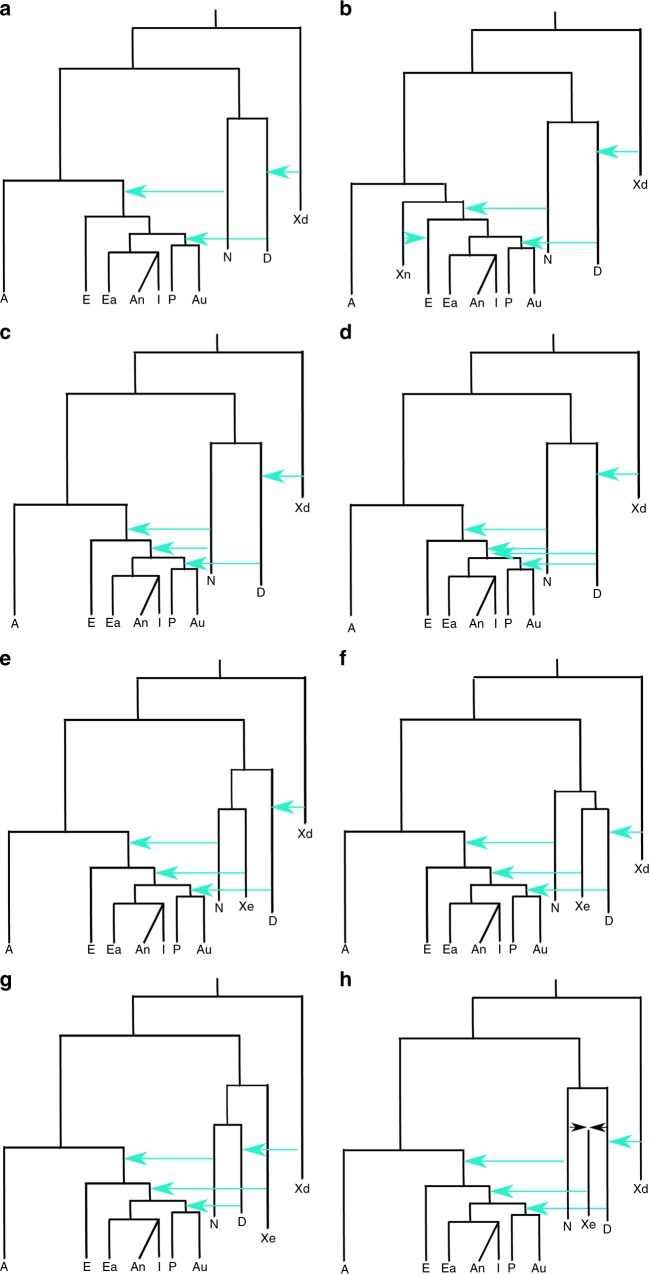
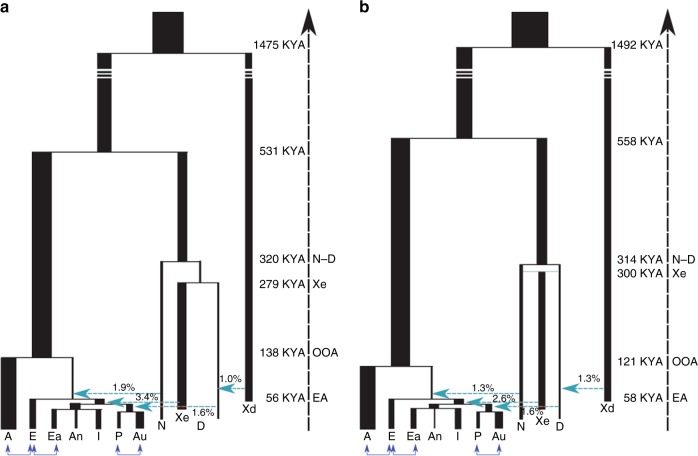
Since anatomically modern humans dispersed Out of Africa, the evolutionary history of Eurasian populations has been marked by introgressions from presently extinct hominins. Some of these introgressions have been identified using sequenced ancient genomes (Neanderthal and Denisova). Other introgressions have been proposed for still unidentified groups using the genetic diversity present in current human populations. We built a demographic model based on deep learning in an Approximate Bayesian Computation framework to infer the evolutionary history of Eurasian populations including past introgression events in Out of Africa populations fitting the current genetic evidence. In addition to the reported Neanderthal and Denisovan introgressions, our results support a third introgression in all Asian and Oceanian populations from an archaic population. This population is either related to the Neanderthal-Denisova clade or diverged early from the Denisova lineage. We propose the use of deep learning methods for clarifying situations with high complexity in evolutionary genomics.
Overview
The claims and statistics of this paper haven’t been checked yet.
Run the check — free, no account needed. It reads the open-access text and checks the sources it cites.
Integrity signals
Registry
Cites
Statistics
Figures
Verification
Claims the paper makes
The claims and statistics of this paper haven’t been checked yet.
Run the check — free, no account needed. It reads the open-access text and checks the sources it cites.
Self-check
Percentages, sums and reported differences re-computed from the paper’s own numbers.
The self-check needs the paper’s full text.
Citations
Cites
LeCun, Y., Bengio, Y., & Hinton, G. (2015) · Nature · doi:10.1038/nature14539 · Cited by 84,126
A global reference for human genetic variation
The 1000 Genomes Project Consortium, authors, C., Auton, A., Abecasis, G. R., Steering committee, Altshuler, D. M., Durbin, R. M., Abecasis, G. R., Bentley, D. R., Chakravarti, A., et al. (2015) · Nature · doi:10.1038/nature15393 · Cited by 18,247
Markov Chain Monte Carlo in Practice
Gilks, W. R., Richardson, S. T., & Spiegelhalter, D. J. (1995) · Chapman & Hall/CRC eBooks · doi:10.1201/b14835 · Cited by 7,927
An integrated map of genetic variation from 1,092 human genomes
The 1000 Genomes Project Consortium (2012) · Nature · doi:10.1038/nature11632 · Cited by 7,711
A draft sequence of the Neandertal genome
Green, R. E., Krause, J., Briggs, A. W., Maricic, T., Stenzel, U., Kircher, M., Patterson, N., Li, H., Zhai, W., Fritz, M. H.-Y., et al. (2010) · Science · doi:10.1126/science.1188021 · Cited by 4,318
Ancient Admixture in Human History
Patterson, N., Moorjani, P., Luo, Y., Mallick, S., Rohland, N., Zhan, Y., Genschoreck, T., Webster, T., & Reich, D. (2012) · Genetics · doi:10.1534/genetics.112.145037 · Cited by 2,848
Inference of human population history from individual whole-genome sequences
Li, H., & Durbin, R. (2011) · Nature · doi:10.1038/nature10231 · Cited by 2,590
Generating samples under a Wright–Fisher neutral model of genetic variation
Hudson, R. R. (2002) · Bioinformatics · doi:10.1093/bioinformatics/18.2.337 · Cited by 2,397
The complete genome sequence of a Neanderthal from the Altai Mountains
Prüfer, K., Racimo, F., Patterson, N., Jay, F., Sankararaman, S., Sawyer, S., Heinze, A., Renaud, G., Sudmant, P. H., de Filippo, C., et al. (2014) · Nature · doi:10.1038/nature12886 · Cited by 2,254
Genetic history of an archaic hominin group from Denisova Cave in Siberia
Reich, D., Green, R. E., Kircher, M., Krause, J., Patterson, N., Durand, E. Y., Viola, B., Briggs, A. W., Stenzel, U., Johnson, P. L. F., et al. (2010) · Nature · doi:10.1038/nature09710 · Cited by 1,991
Research works printed but not linked: 1
- Prangle, D. in Handbook of Approximate Bayesian Computation (ABC) (eds Sisson, S. A., Fan, Y. & Beaumont, B.) 320 (Taylor & Francis, Abingdon, 2108).
Cited by
Sorted by citations
Items 101–129 of 129
Manning, P. M. (2020) · Cambridge University Press eBooks · doi:10.1017/9781108784528.014
Manning, P. M. (2020) · Cambridge University Press eBooks · doi:10.1017/9781108784528.006
Appendix: Frameworks for Analysis
Manning, P. M. (2020) · Cambridge University Press eBooks · doi:10.1017/9781108784528.012
Manning, P. M. (2020) · Cambridge University Press eBooks · doi:10.1017/9781108784528.005
Manning, P. M. (2020) · Cambridge University Press eBooks · doi:10.1017/9781108784528.011
Manning, P. M. (2020) · Cambridge University Press eBooks · doi:10.1017/9781108784528.013
Manning, P. M. (2020) · Cambridge University Press eBooks · doi:10.1017/9781108784528.016
Tracy, D. K. (2022) · Cambridge University Press eBooks · doi:10.1017/9781009030564.005
Deep Learning for Inferring Distribution of Time to the Last Common Ancestor from a Diploid Genome
Arzymatov, K., Khomutov, E., & Shchur, V. (2022) · Lobachevskii Journal of Mathematics · doi:10.1134/s1995080222110075
How Past Shapes Future: The Biological Future of Humankind
Bertranpetit, J., & Peretó, J. G. (2022) · Evolutionary studies · doi:10.1007/978-981-19-3246-5_16
Self-citationHuman Evolution: The Genomic Evidence
Comas, D., & Calafell, F. (2022) · Evolutionary studies · doi:10.1007/978-981-19-3246-5_9
Witała, M. (2022) · Poznańskie Studia Teologiczne · doi:10.14746/pst.2022.41.04
Langdon, J. H. (2022) · Springer texts in social sciences · doi:10.1007/978-3-031-14157-7_20
Modern Humans Disperse From Africa
Langdon, J. H. (2022) · Springer texts in social sciences · doi:10.1007/978-3-031-14157-7_19
Serradell, J. M., Lorenzo-Salazar, J. M., Flores, C., Lao, Ó., & Comas, D. (2023) · bioRxiv (Cold Spring Harbor Laboratory) · doi:10.1101/2023.11.07.565966
Serradell, J. M., Lorenzo-Salazar, J. M., Flores, C., Lao, Ó., & Comas, D. (2024) · DIGITAL.CSIC (Spanish National Research Council (CSIC)) · doi:10.6084/m9.figshare.26756104
Serradell, J. M., Lorenzo-Salazar, J. M., Flores, C., Lao, Ó., & Comas, D. (2024) · DIGITAL.CSIC (Spanish National Research Council (CSIC)) · doi:10.6084/m9.figshare.26410044
Serradell, J. M., Lorenzo-Salazar, J. M., Flores, C., Lao, Ó., & Comas, D. (2024) · DIGITAL.CSIC (Spanish National Research Council (CSIC)) · doi:10.6084/m9.figshare.26756101
Jacobs, G. S., Kusuma, P., & Attenborough, R. (2025) · ANU Press eBooks · doi:10.22459/ta58.2024.04
Serradell, J. M., Lorenzo-Salazar, J. M., Flores, C., Lao, Ó., & Comas, D. (2024) · DIGITAL.CSIC (Spanish National Research Council (CSIC)) · doi:10.6084/m9.figshare.26756107
Serradell, J. M., Lorenzo-Salazar, J. M., Flores, C., Lao, Ó., & Comas, D. (2024) · DIGITAL.CSIC (Spanish National Research Council (CSIC)) · doi:10.6084/m9.figshare.26756110
Serradell, J. M., Lorenzo-Salazar, J. M., Flores, C., Lao, Ó., & Comas, D. (2024) · DIGITAL.CSIC (Spanish National Research Council (CSIC)) · doi:10.6084/m9.figshare.26409853
Roberts, M. D., & Josephs, E. B. (2026) · bioRxiv (Cold Spring Harbor Laboratory) · doi:10.64898/2026.02.17.706432
Desai, S., Adhikary, V., Bhattacharyya, M., Tharu, M. K., Sharma, A., Sequeira, J. J., Pandey, R. K., Pandey, P. S., Shendre, S. S., Tayyeh, A. M., et al. (2026) · bioRxiv (Cold Spring Harbor Laboratory) · doi:10.64898/2026.04.29.721543 · Cited by 2
The reliability of inferred archaic segments
Bird, N., Walker, E., & Hellenthal, G. (2026) · Human Population Genetics and Genomics · doi:10.47248/hpgg2606020007
McAllister, N. P., Zöllner, S., & Zhang, X. (2026) · bioRxiv (Cold Spring Harbor Laboratory) · doi:10.64898/2026.06.25.734355
Metadata
- Authors
- Mondal, M., Bertranpetit, J., & Lao, O.
- Affiliations
- University of Tartu (EE)
- Universitat Pompeu Fabra (ES)
- Corresponding author
- Bertranpetit, Jaume
- Venue
- Nature Communications
- Published
- 2019-01-16
- Volume
- 10
- Issue
- 1
- Pages
- 246-246
- ISSN
- 2041-1723 (ISSN-L)
- PMC
- PMC6335398
- OpenAlex
- W2909640254
- Cited by
- 124
- References
- 51
- Citations by year
- 2026: 7 · 2025: 6 · 2024: 11 · 2023: 9 · 2022: 15 · 2021: 29 · 2020: 38 · 2019: 9
- FWCI
- 13.59
- Type
- journal article
- Language
- en
- Open access
- gold
- doi.org
- Locations
- Nature Communications (publishedVersion, cc-by)
- Europe PMC (PubMed Central) (publishedVersion, other-oa)
- PubMed Central (publishedVersion, cc-by)
- PubMed (publishedVersion)
- RECERCAT (Consorci de Serveis Universitaris de Catalunya) (publishedVersion, other-oa)
- RePEc: Research Papers in Economics (submittedVersion)
- DIGITAL.CSIC (Spanish National Research Council (CSIC)) (submittedVersion, cc-by)
- DOAJ (DOAJ: Directory of Open Access Journals) (submittedVersion)
- DOAJ (DOAJ: Directory of Open Access Journals) (submittedVersion, cc-by-sa)
- Repositori digital de la UPF (Universitat Pompeu Fabra) (submittedVersion, cc-by)
- Funders
- Centres de Recerca de Catalunya
- European Commission (2014‐2020, 2020 ‘, 2014-2020.4.01.16-0030)
- Generalitat de Catalunya (GRC 2017 SGR 937, 2017-SGR, MDM-2014-0370)
- Ministerio de Asuntos Económicos y Transformación Digital, Gobierno de España (RYC-2013-14797, MDM-2014-0370, BFU2015-68759-P)
- Instituto de Salud Carlos III (MDM-2014-0370, 2014/2020)
- European Regional Development Fund (BFU2016, 2014-2020’, 2014-2020.4.01.16-0030, MDM-2014-0370, 14797, BFU2016-77961-P)
- Agencia Estatal de Investigación (MDM-2014-0370, BFU2016-77961-P)
- Topics
- Life Sciences › Biochemistry, Genetics and Molecular Biology › Genetics › Forensic and Genetic Research
- Social Sciences › Anthropology › Pleistocene-Era Hominins and Archaeology
- Life Sciences › Biochemistry, Genetics and Molecular Biology › Genetics › Genetic diversity and population structure
- Keywords
- archaic introgression, Neanderthal introgression, Denisovan introgression, approximate Bayesian computation, dispersal out of Africa, human evolution
About these checks
Registry, retraction, Cites and statistics results are computed, not judged, with one exception: a printed reference that no index lists is read once by a model before it counts as a citation error. Claims are extracted by a model and kept only when their quote appears verbatim in the text; each cited source is then checked, with a model’s help, for whether it says what the claim relies on. Those verdicts can be wrong — read the claim’s quote and the cited source before relying on one.
Statistics and arithmetic are recomputed, not judged.
Confidence bands are shown only for fields calibrated on our annotated test set. None is calibrated yet, so no band is shown.
What counts as a claim ›How we measure confidence ›How we check this ›
Are you an author, or do you see a problem with this page? Request a review
