

The DOI matches its Crossref record; 39 of the 39 references it cites were found in a registry or an index.
R-spondin 3 promotes stem cell recovery and epithelial regeneration in the colon
Open accessAbstract
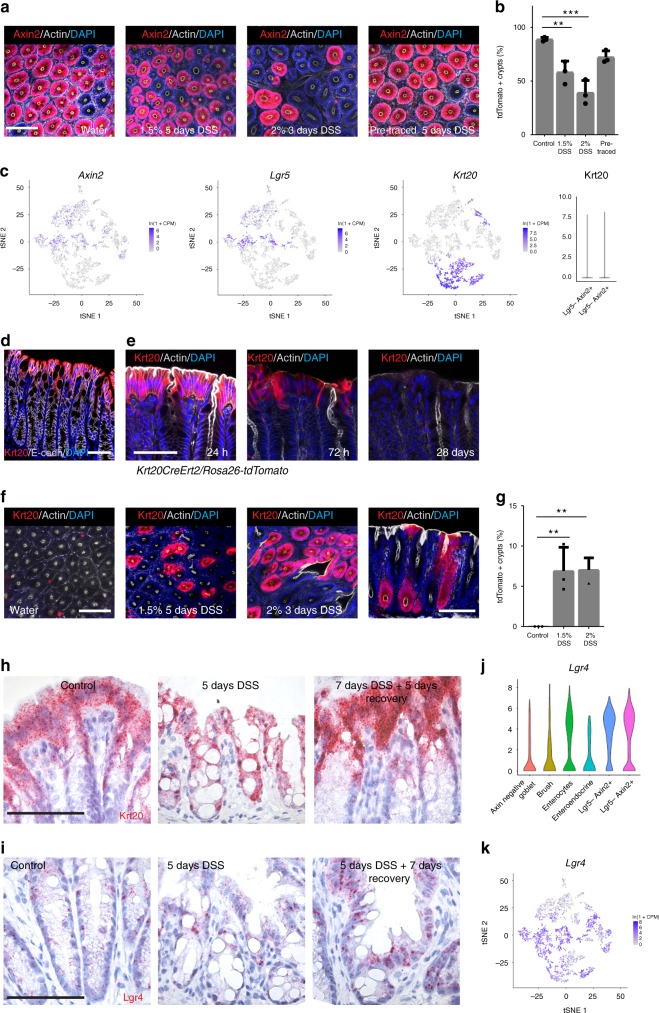
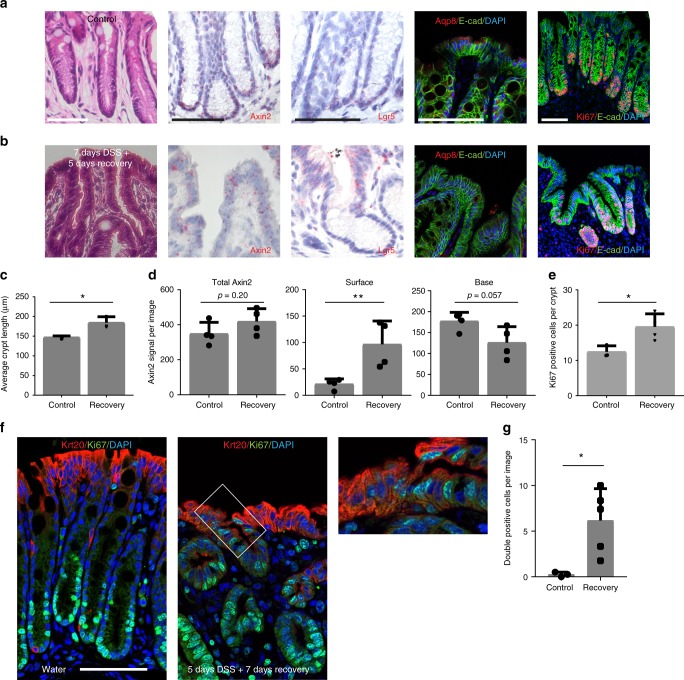
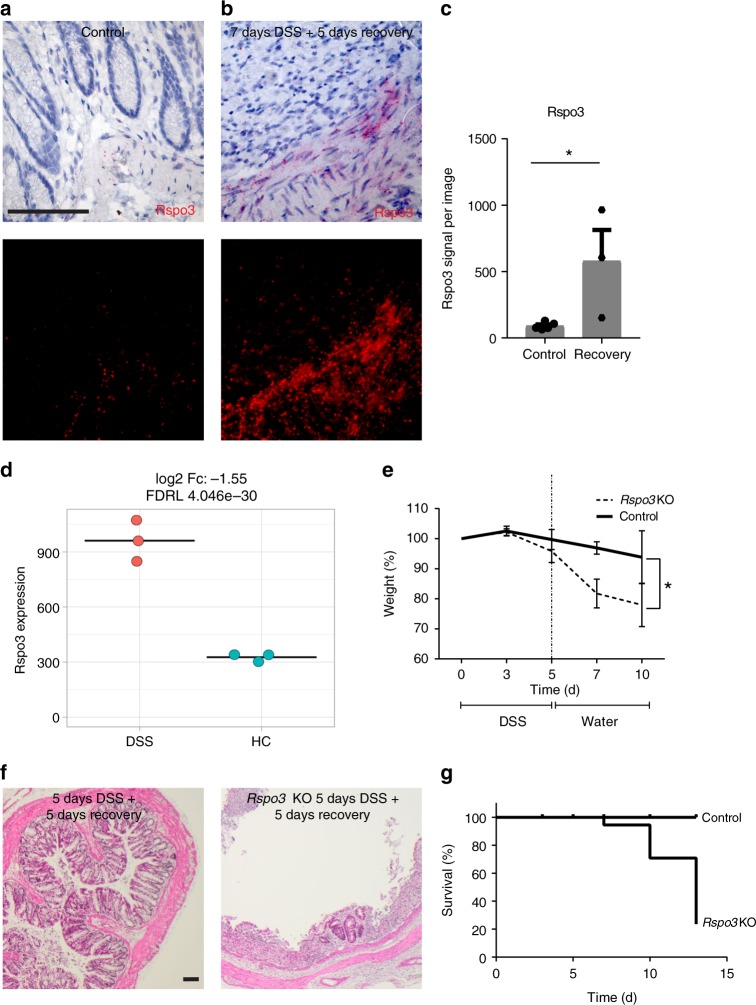
The colonic epithelial turnover is driven by crypt-base stem cells that express the R-spondin receptor Lgr5. Signals that regulate epithelial regeneration upon stem cell injury are largely unknown. Here, we explore the dynamics of Wnt signaling in the colon. We identify two populations of cells with active Wnt signaling: highly proliferative Lgr5+/Axin2+ cells, as well as secretory Lgr5−/Axin2+ cells. Upon Lgr5+ cell depletion, these cells are recruited to contribute to crypt regeneration. Chemical injury induced by DSS leads to a loss of both Lgr5+ cells and Axin2+ cells and epithelial regeneration is driven by Axin2− cells, including differentiated Krt20+ surface enterocytes. Regeneration requires stromal Rspo3, which is present at increased levels upon injury and reprograms Lgr5− but Lgr4+ differentiated cells. In contrast, depletion of stromal Rspo3 impairs crypt regeneration, even upon mild injury. We demonstrate that Rspo3 is essential for epithelial repair via induction of Wnt signaling in differentiated cells.
Overview
The claims and statistics of this paper haven’t been checked yet.
Run the check — free, no account needed. It reads the open-access text and checks the sources it cites.
Integrity signals
Registry
Cites
Statistics
Figures
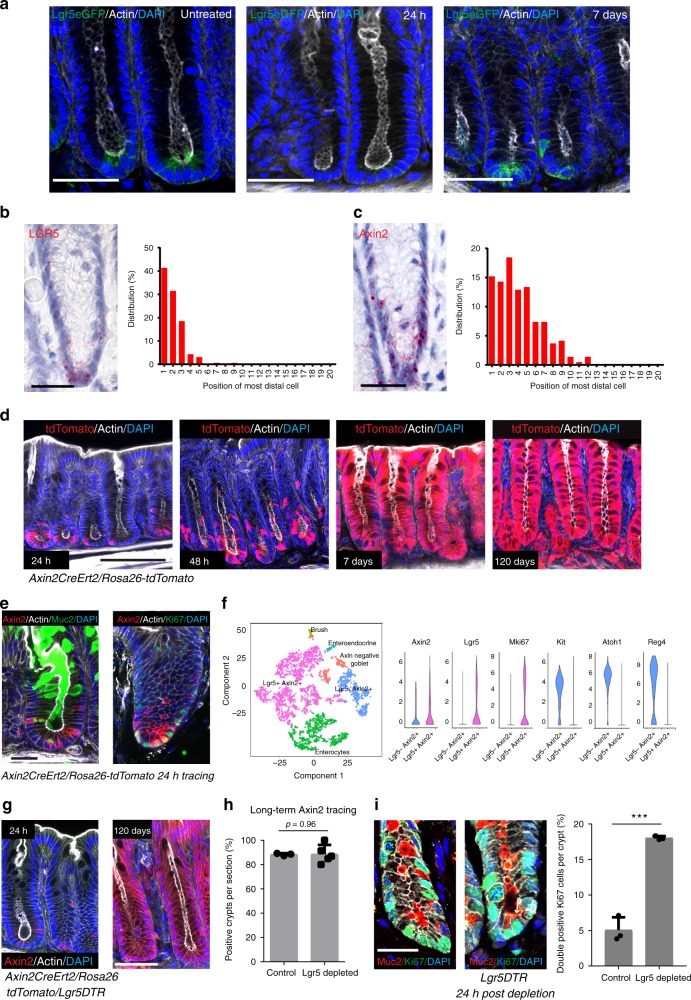
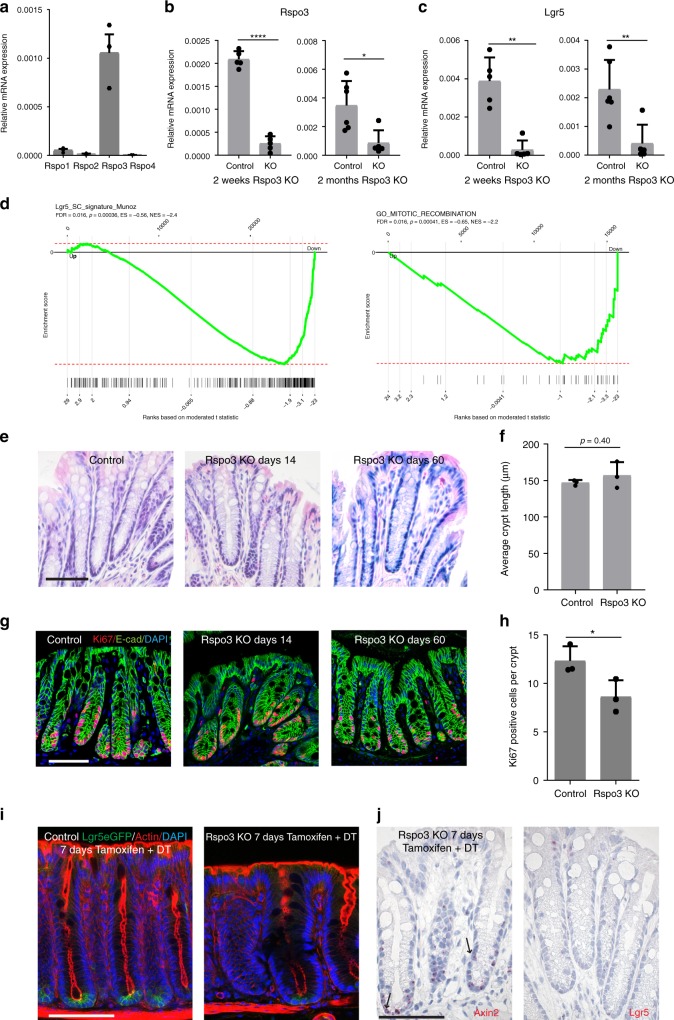
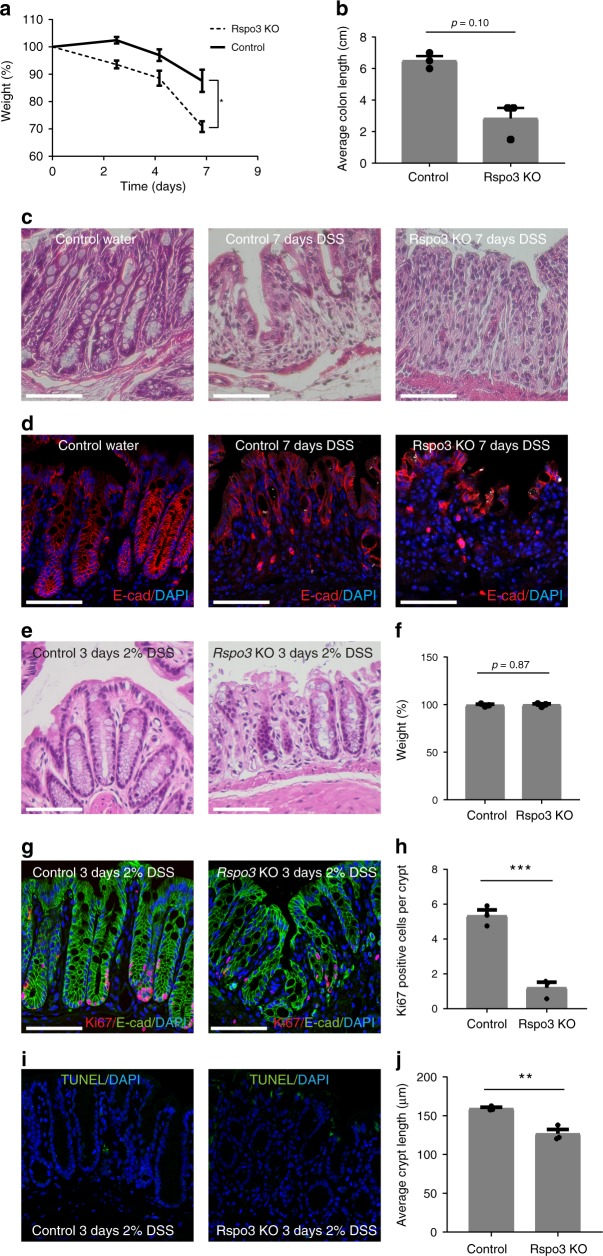
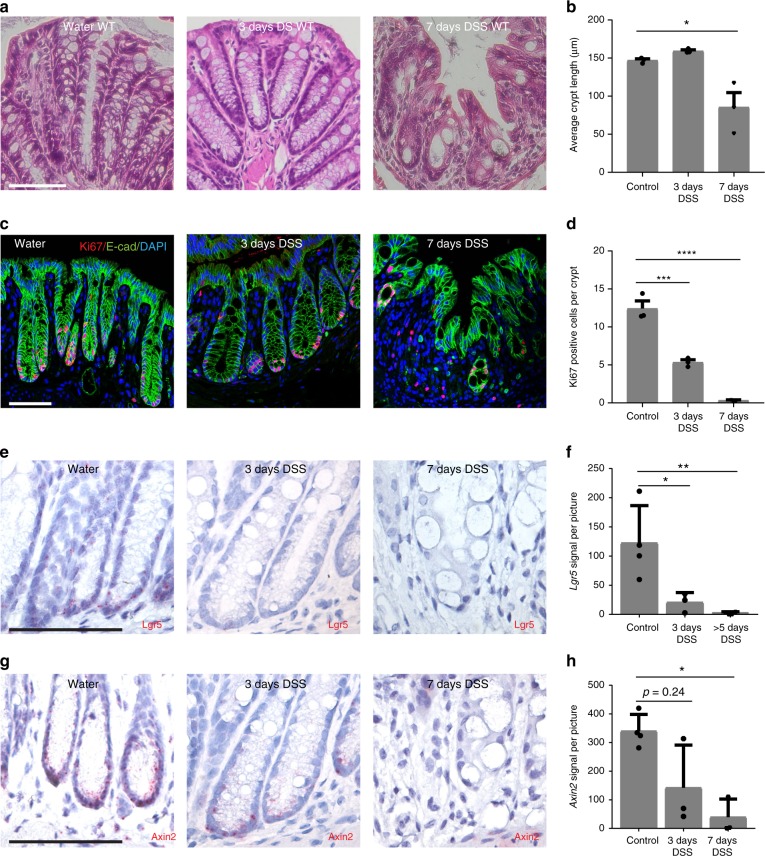
Verification
Claims the paper makes
The claims and statistics of this paper haven’t been checked yet.
Run the check — free, no account needed. It reads the open-access text and checks the sources it cites.
Claims other papers make about this one
Each is checked against this paper’s own text: does it say what the citing paper says it does?
The cited source says what the claim attributes to it.
In the citing paper
“Together, our findings provide evidence for a mesenchymal liver niche that controls epithelial cell functions in health and disease, akin to the R-spondin–LGR5-mediated mesenchymal–epithelial cross-talk in the gastrointestinal tract21,22.”
From Hepatic stellate cells control liver zonation, size and functions via R-spondin 3 (2025) · cites this paper as [22]
The cited source says what the claim attributes to it.
In the citing paper
“RSPO3, a potent positive regulator of the WNT pathway21,22, emerged among the top-ten HSC ligands mediating HSC–hepatocyte interactions through its corresponding receptors LGR4 and LGR5 (Fig. 3b and Supplementary Table 4).”
From Hepatic stellate cells control liver zonation, size and functions via R-spondin 3 (2025) · cites this paper as [22]
Self-check
Percentages, sums and reported differences re-computed from the paper’s own numbers.
The self-check needs the paper’s full text.
Citations
Cites
Moderated estimation of fold change and dispersion for RNA-seq data with DESeq2
Love, M. I., Huber, W., & Anders, S. (2014) · Genome Biology · doi:10.1186/s13059-014-0550-8 · Cited by 95,106
Subramanian, A., Tamayo, P., Mootha, V. K., Mukherjee, S., Ebert, B. L., Gillette, M. A., Paulovich, A., Pomeroy, S. L., Golub, T. R., Lander, E. S., et al. (2005) · Proceedings of the National Academy of Sciences · doi:10.1073/pnas.0506580102 · Cited by 53,625
Molecular signatures database (MSigDB) 3.0
Liberzon, A., Subramanian, A., Pinchback, R., Thorvaldsdóttir, H., Tamayo, P., & Mesirov, J. P. (2011) · Bioinformatics · doi:10.1093/bioinformatics/btr260 · Cited by 7,111
Identification of stem cells in small intestine and colon by marker gene Lgr5
Barker, N., van Es, J. H., Kuipers, J., Kujala, P., van den Born, M., Cozijnsen, M., Haegebarth, A., Korving, J., Begthel, H., Peters, P. J., et al. (2007) · Nature · doi:10.1038/nature06196 · Cited by 5,687
Fast gene set enrichment analysisPreprint
Korotkevich, G., Sukhov, V., Budin, N., Shpak, B., Artyomov, M. N., & Sergushichev, A. (2016) · bioRxiv (Cold Spring Harbor Laboratory) · doi:10.1101/060012 · Cited by 3,742
Single-cell transcriptomics of 20 mouse organs creates a Tabula Muris
The Tabula Muris Consortium, coordination, O., coordination, L., processing, O. C. A., sequencing, L. P. A., analysis, C. D., annotation, C. T., Writing group, Supplemental text writing group, & Principal investigators (2018) · Nature · doi:10.1038/s41586-018-0590-4 · Cited by 2,842
Intestinal inflammation targets cancer-inducing activity of the microbiota
Arthur, J. C., Perez-Chanona, E., Mühlbauer, M., Tomkovich, S., Uronis, J. M., Fan, T.-J., Campbell, B. J., Abujamel, T., Dogan, B., Rogers, A. B., et al. (2012) · Science · doi:10.1126/science.1224820 · Cited by 2,263
Dextran Sulfate Sodium (DSS)‐Induced Colitis in Mice
Chassaing, B., Aitken, J. D., Malleshappa, M., & Vijay–Kumar, M. (2014) · Current Protocols in Immunology · doi:10.1002/0471142735.im1525s104 · Cited by 2,094
Mucosal flora in inflammatory bowel disease
Swidsinski, A. V., Ladhoff, A., Pernthaler, A., Swidsinski, S., Loening-Baucke, V. A., Ortner, M., Weber, J., Hoffmann, U., Schreiber, S., Dietel, M., et al. (2002) · Gastroenterology · doi:10.1053/gast.2002.30294 · Cited by 1,344
Lgr5 homologues associate with Wnt receptors and mediate R-spondin signalling
de Lau, W., Barker, N., Low, T. Y., Koo, B., Li, V. S. W., Teunissen, H., Kujala, P., Haegebarth, A., Peters, P. J., van de Wetering, M., et al. (2011) · Nature · doi:10.1038/nature10337 · Cited by 1,302
Cited by
Sorted by citations
Items 101–137 of 137
Multicellular immune hubs and their organization in MMRd and MMRp colorectal cancerPreprint
Pelka, K., Hofree, M., Chen, J. H., Sarkizova, S., Pirl, J. D., Jorgji, V., Bejnood, A., Dionne, D. A., Ge, W. H., Xu, K. H., et al. (2021) · bioRxiv (Cold Spring Harbor Laboratory) · doi:10.1101/2021.01.30.426796 · Cited by 4
R-spondin 3 governs secretory differentiation in the gastric oxyntic glands
Kurokawa, K., Wang, T. C., & Hayakawa, Y. (2022) · Journal of Clinical Investigation · doi:10.1172/jci163380 · Cited by 3
Role of Intestinal Barrier Disruption to Acute-on-Chronic Liver Failure
Pohl, J., Aretakis, D., Tacke, F., Engelmann, C., & Sigal, M. J. (2025) · Seminars in Liver Disease · doi:10.1055/a-2516-2361 · Cited by 3
Self-citationRSPO/LGR signaling regulates proliferation of adult hippocampal neural stem cells
Valenzuela-Bezanilla, D., Mardones, M. D., Galassi, M., Arredondo, S. B., Santibanez, S. H., Gutierrez-Jimenez, S., Merino-Véliz, N., Bustos, F. J., & Varela‐Nallar, L. (2024) · Stem Cells · doi:10.1093/stmcls/sxae065 · Cited by 5
Shen, Y., Wang, J., Dai, Y., Wan, X., Zhang, J., & Le, Q. (2025) · Investigative Ophthalmology & Visual Science · doi:10.1167/iovs.66.1.8 · Cited by 3
Compressed phenotypic screens for complex multicellular models and high-content assaysPreprint
Mead, B. E., Kummerlowe, C., Liu, N., Kattan, W. E., Cheng, T., Cheah, J. H., Soule, C. K., Peters, J., Lowder, K. E., Blainey, P. C., et al. (2023) · bioRxiv (Cold Spring Harbor Laboratory) · doi:10.1101/2023.01.23.525189 · Cited by 3
Safely Targeting Cancer, the Wound That Never Heals, Utilizing CBP/Beta-Catenin Antagonists
Higuchi, Y., Teo, J.-L., Yi, D., & Kahn, M. (2025) · Cancers · doi:10.3390/cancers17091503 · Cited by 3
Current advances in restoring intestinal barrier homeostasis by natural medicines
Wang, Y., Tan, S., Huang, J., Wu, Q., Shen, X., & Bao, W. (2026) · Phytomedicine · doi:10.1016/j.phymed.2026.158144 · Cited by 2
Corrupted devolution: How normal cells are reborn as cancer precursors
Lord, A. E., & Ficz, G. (2022) · The International Journal of Biochemistry & Cell Biology · doi:10.1016/j.biocel.2022.106263 · Cited by 2
Blitzer, G. C., Paz, C., Glassey, A., Ganz, O., Giri, J., Pennati, A., Meyers, R. O., Lunga, T., Robbins, D. J., Thibeault, S. L., et al. (2021) · Research Square · doi:10.21203/rs.3.rs-965122/v1 · Cited by 2
Pellón-Cárdenas, O., Rout, P., Hassan, S., Fokas, E., Ping, H., Patel, I., Patel, J., Plotsker, O., Wu, A., Kumar, R., et al. (2025) · bioRxiv (Cold Spring Harbor Laboratory) · doi:10.1101/2025.01.22.634326 · Cited by 2
Xu, T., Hou, W.-X., Yang, S.-T., Shao, Y.-P., Wang, J., Han, T., & Li, J.-N. (2026) · World Journal of Gastroenterology · doi:10.3748/wjg.v32.i5.113024 · Cited by 1
From repair to disease: lymphatic contributions to regeneration, cancer and ageing
Zhang, Y., Tian, Q., Yang, Y., Liu, H., Yesin, T. K., Lu, W., Joseph, J. D., Borah, B., Ramasamy, S. K., Yun, M. H., et al. (2026) · Journal of Advanced Research · doi:10.1016/j.jare.2026.04.005 · Cited by 1
Gut stem cells: Interplay with immune system, microbiota, and aging
Marotta, F., Balakrishnan, B., Yazdani, A., Ayala, A., He, F., & Catanzaro, R. (2021) · Elsevier eBooks · doi:10.1016/b978-0-12-820071-1.00017-7 · Cited by 1
Wong, G. P., Hartmann, S., Nonn, O., Cannon, P., Nguyen, T. V., Kandel, M., de Alwis, N., Murphy, C. N., Pritchard, N., Dechend, R., et al. (2024) · Stem Cell Reviews and Reports · doi:10.1007/s12015-024-10831-2 · Cited by 2
Excess dietary sugar impairs colonic epithelial regeneration in response to damagePreprint
Burr, A. B. P., Ji, J., Ozler, K., Eskiocak, O., Yueh, B., Menk, A. V., Costa, A. S. H., Rittenhouse, N., Marshall, C. W., Chiaranunt, P., et al. (2021) · bioRxiv (Cold Spring Harbor Laboratory) · doi:10.1101/2021.08.18.456840 · Cited by 1
New Kids on the Block: Immature Myeloid Cells in Intestinal Regeneration
Meadows, V., & Gao, N. (2023) · Cellular and Molecular Gastroenterology and Hepatology · doi:10.1016/j.jcmgh.2023.11.011 · Cited by 1
CDC42 Regulatory Patterns Related To Inflammatory Bowel Disease and Hyperglycemia
Stojanović, M., & Agrawal, D. K. (2025) · Journal of Bioinformatics and Systems Biology · doi:10.26502/jbsb.5107098 · Cited by 1
Rspo3 regulates abnormal differentiation of small intestinal epithelial cells in diabetic statePreprint
Shan, T., Han, Y., Sun, X., Jiang, Y., & Chen, L. (2021) · Research Square · doi:10.21203/rs.3.rs-265005/v1
Cellular Heterogeneity during Metastatic Colonization of Colorectal Cancer
Heinz, M. C. (2022) · Utrecht University Repository (Utrecht University) · doi:10.33540/1556
Levin, G. (2020) · Digital Library of Theses and Dissertations (Universidade de São Paulo) · doi:10.11606/t.87.2020.tde-28112022-101804
Immature myeloid cells are indispensable for intestinal regeneration post irradiation injuryPreprint
Jiang, Z., Waterbury, Q. T., Fu, N., Kim, W., Malagola, E., Guha, C., Shawber, C. J., Yan, K. S., & Wang, T. C. (2023) · bioRxiv (Cold Spring Harbor Laboratory) · doi:10.1101/2023.02.28.530500
BRAFV600E mutation and DSS treatment synergize to induce cecal tumor formation in mice
Gao, C., Esni, F., Chu, E., & Hu, J. (2024) · Biochemistry and Biophysics Reports · doi:10.1016/j.bbrep.2023.101634
Intestinal stem cell renewal controlled by capillary morphogenesis gene 2 following injuryPreprint
Bracq, L. J., Chuat, A., Kunz, B., Burri, O., Guiet, R., & van der Goot, F. G. (2025) · bioRxiv (Cold Spring Harbor Laboratory) · doi:10.1101/2025.01.07.631493
Research Advances in Nasal Epithelial Organoids and Challenges in Clinical Disease Applications
Xia, M., & Chengcheng, L. (2025) · Materials Lab · doi:10.54227/mlab.20250004
Multi-omics and Mendelian randomization study explores potential therapeutic targets for meningiomas
Li, Y., Lin, L., Zhang, W., Wang, Y., Shen, H., & Guan, Y. (2025) · Discover Oncology · doi:10.1007/s12672-025-03318-0
Gadeock, S., Girish, N., Liu, C. Y., Huang, Y., Das, B., Grikscheit, T. C., & Polk, D. B. (2026) · Cellular and Molecular Gastroenterology and Hepatology · doi:10.1016/j.jcmgh.2026.101856
Larsen, M. C., Gurevic, I., Berube, L., Loo, A. V., Hanson, E., Adam, R. J., Manfrè, V., Parker, M. H., Paz, C., Galipeau, J., et al. (2025) · Regenerative Therapy · doi:10.1016/j.reth.2025.11.004
Phenotypic plasticity mediates colorectal cancer metastasisPreprint
Efremova, M., Ogden, S., Metic, N., Smith, E. A., Berner, A., Baker, A.-M., Uddin, I., Chelala, C., Ullah, D., Saad, A. B., et al. (2024) · Research Square · doi:10.21203/rs.3.rs-3846377/v1
Shan, T.-D., Yue, H., 孙学国, Jiang, Y.-P., & Chen, L. (2021) · Figshare · doi:10.6084/m9.figshare.14746828
La signalisation insuline comme garant de la fonction barrière intestinale
Gueddouri, D. (2021) · theses.fr (ABES) · doi:10.70675/8371f5a7zb0c3z4f82z83e9z236d0eedb3f1
Dang, Y., Zhou, C., Li, C., Wei, M., Shiqi, L., Cui, J., Zhou, Q., Yu, Y., Wang, F., Shang, X., et al. (2026) · Pharmacological Research · doi:10.1016/j.phrs.2026.108249
Rahim, M. F., Gong, S., Ijaz, F., Quan, C., Ali, S., Li, K., Mo, Q., Khera, H. U. R. A., Lu, Y., Gao, X., et al. (2026) · Materials & Design · doi:10.1016/j.matdes.2026.116563
Akbaş, E., Gürgen, B. N., Akgül, E., Günay, E., Tok, B., Ozduran, E., Yalçın, S. E., Çağatay, S. C., Aksoy, Z. B., Aǧagündüz, D., et al. (2026) · Biomedicines · doi:10.3390/biomedicines14081873
Building and regenerating intestines by manipulating intestinal stem cells
Kuo, C. J., Blutt, S. E., Donowitz, M., Estes, M. K., Guha, C., Klein, O. D., Li, L., Niland, J. C., Santos, A. J. M., Shivdasani, R. A., et al. (2026) · Nature Reviews Gastroenterology & Hepatology · doi:10.1038/s41575-026-01242-4 · Cited by 1
Stromal Cells and Sjögren’s Disease
McCoy, S. S., & Manfrè, V. (2026) · Rheumatic Disease Clinics of North America · doi:10.1016/j.rdc.2026.09.005
Metadata
- Authors
- Harnack, C., Berger, H., Antanaviciute, A., Vidal, R., Sauer, S., Simmons, A., Meyer, T. F., & Sigal, M.
- Affiliations
- Max Planck Institute for Infection Biology (DE)
- University of Oxford (GB)
- Max Delbrück Center (DE)
- Corresponding author
- Meyer, Thomas F.
- Sigal, Michael
- ORCID
- Venue
- Nature Communications
- Published
- 2019-09-25
- Volume
- 10
- Issue
- 1
- Pages
- 4368-4368
- ISSN
- 2041-1723 (ISSN-L)
- PMC
- PMC6761174
- OpenAlex
- W2975327727
- Cited by
- 137
- References
- 39
- Citations by year
- 2026: 10 · 2025: 19 · 2024: 19 · 2023: 23 · 2022: 25 · 2021: 25 · 2020: 15 · 2019: 1
- FWCI
- 5.46
- Type
- journal article
- Language
- en
- Open access
- gold
- doi.org
- Locations
- Nature Communications (publishedVersion, cc-by)
- PubMed Central (publishedVersion, cc-by)
- PubMed (publishedVersion)
- MDC Repository (Max-Delbrueck-Center for Molecular Medicine) (acceptedVersion)
- RePEc: Research Papers in Economics (submittedVersion)
- DOAJ (DOAJ: Directory of Open Access Journals) (submittedVersion)
- DOAJ (DOAJ: Directory of Open Access Journals) (submittedVersion, cc-by-sa)
- MPG.PuRe (Max Planck Society) (submittedVersion, other-oa)
- Funders
- Deutsche Forschungsgemeinschaft (SI 1983 2/1, SI 1983 3/1)
- Topics
- Life Sciences › Biochemistry, Genetics and Molecular Biology › Molecular Biology › Wnt/β-catenin signaling in development and cancer
- Health Sciences › Medicine › Oncology › Cancer Cells and Metastasis
- Health Sciences › Medicine › Hepatology › Liver physiology and pathology
- Keywords
- RSPO3, Lgr5, Axin2, Wnt signaling, crypt stem cells, DSS-induced colitis, stromal cells, enterocytes, LGR4, epithelial cell turnover, stem cell recovery
- MeSH terms
- Animals, Cell Differentiation, Colitis, Colon, Intestinal Mucosa, Mice, Transgenic, Regeneration, Stem Cells, Mice, Knockout, Thrombospondins, Gene Expression Profiling, Enterocytes, Receptors, G-Protein-Coupled, Keratin-20, Wnt Signaling Pathway, Axin Protein
About these checks
Registry, retraction, Cites and statistics results are computed, not judged, with one exception: a printed reference that no index lists is read once by a model before it counts as a citation error. Claims are extracted by a model and kept only when their quote appears verbatim in the text; each cited source is then checked, with a model’s help, for whether it says what the claim relies on. Those verdicts can be wrong — read the claim’s quote and the cited source before relying on one.
Statistics and arithmetic are recomputed, not judged.
Confidence bands are shown only for fields calibrated on our annotated test set. None is calibrated yet, so no band is shown.
What counts as a claim ›How we measure confidence ›How we check this ›
Are you an author, or do you see a problem with this page? Request a review
