

The DOI matches its Crossref record; 96 of the 96 references it cites were found in a registry or an index.
Single cell census of human kidney organoids shows reproducibility and diminished off-target cells after transplantation
Open accessPublished version of a preprint
Abstract
Human iPSC-derived kidney organoids have the potential to revolutionize discovery, but assessing their consistency and reproducibility across iPSC lines, and reducing the generation of off-target cells remain an open challenge. Here, we profile four human iPSC lines for a total of 450,118 single cells to show how organoid composition and development are comparable to human fetal and adult kidneys. Although cell classes are largely reproducible across time points, protocols, and replicates, we detect variability in cell proportions between different iPSC lines, largely due to off-target cells. To address this, we analyze organoids transplanted under the mouse kidney capsule and find diminished off-target cells. Our work shows how single cell RNA-seq (scRNA-seq) can score organoids for reproducibility, faithfulness and quality, that kidney organoids derived from different iPSC lines are comparable surrogates for human kidney, and that transplantation enhances their formation by diminishing off-target cells.
Overview
The claims and statistics of this paper haven’t been checked yet.
Run the check — free, no account needed. It reads the open-access text and checks the sources it cites.
Integrity signals
Registry
Cites
Statistics
Figures
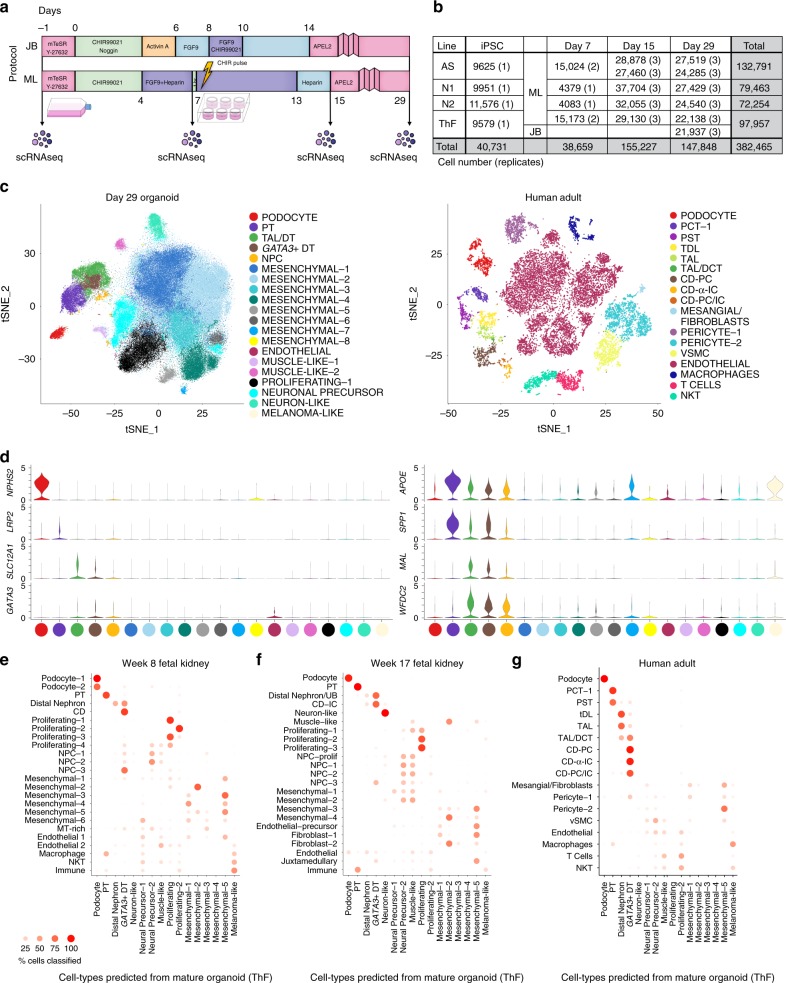
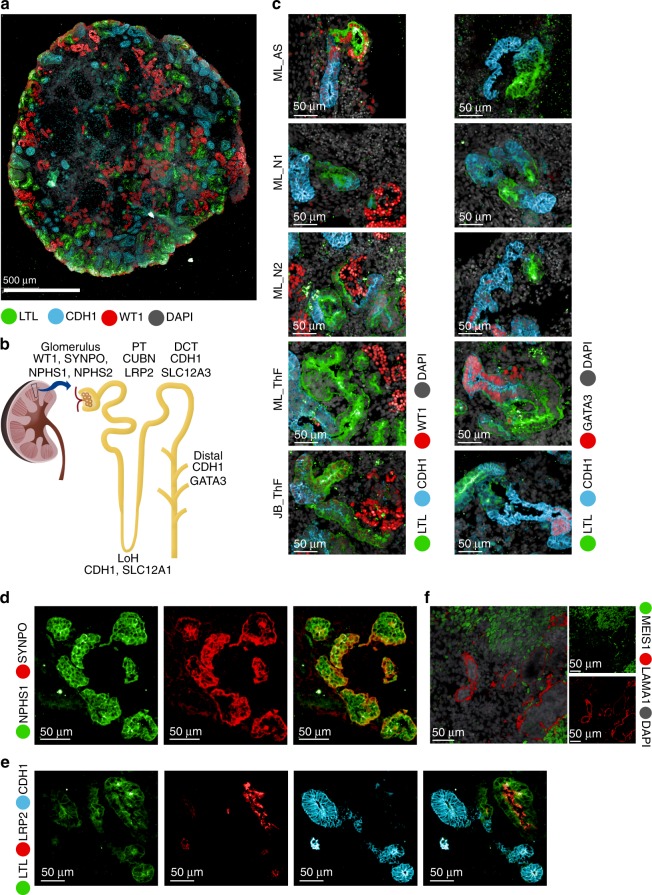
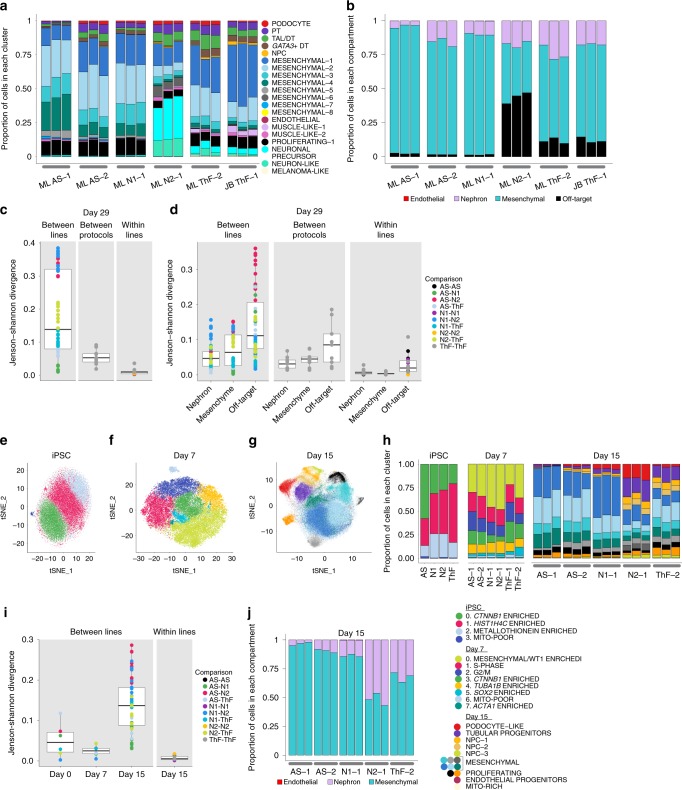
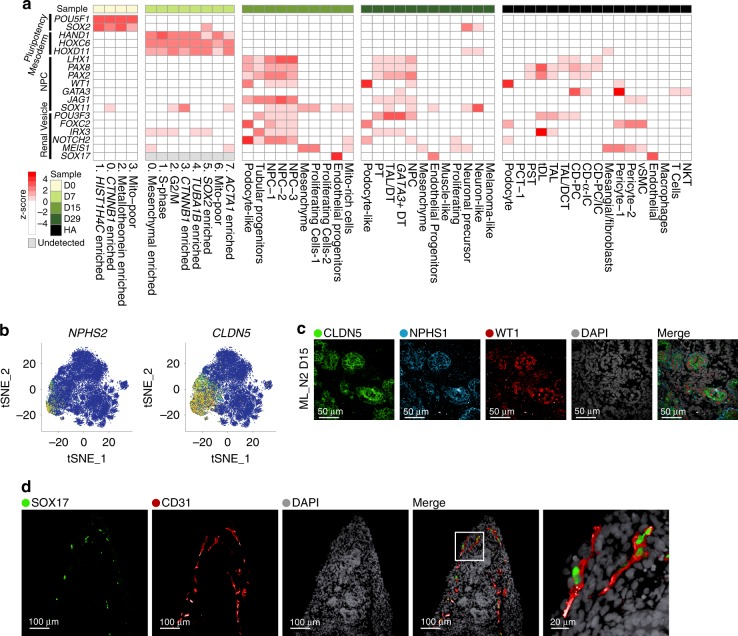
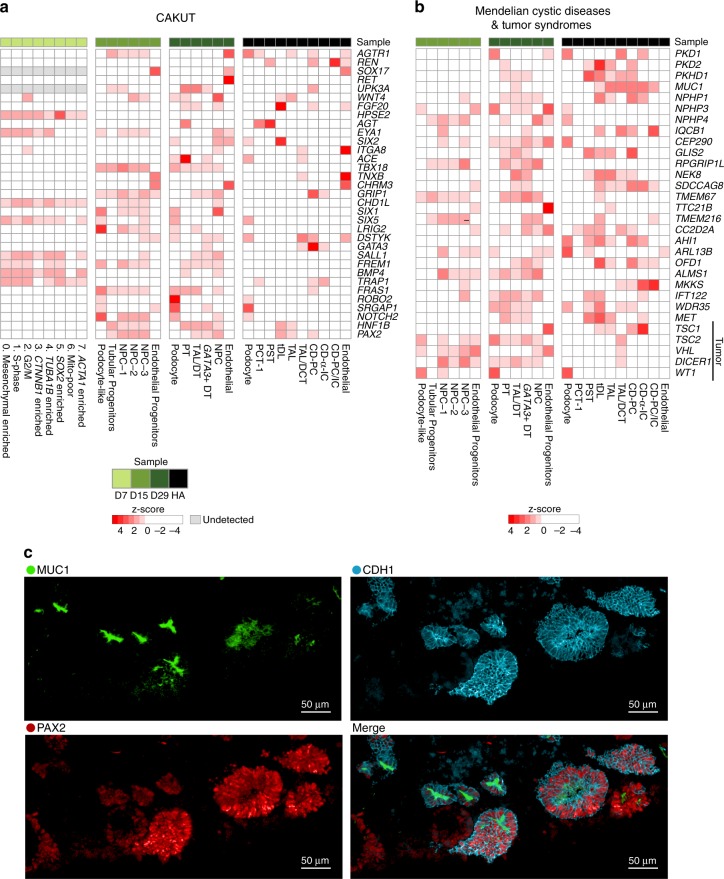
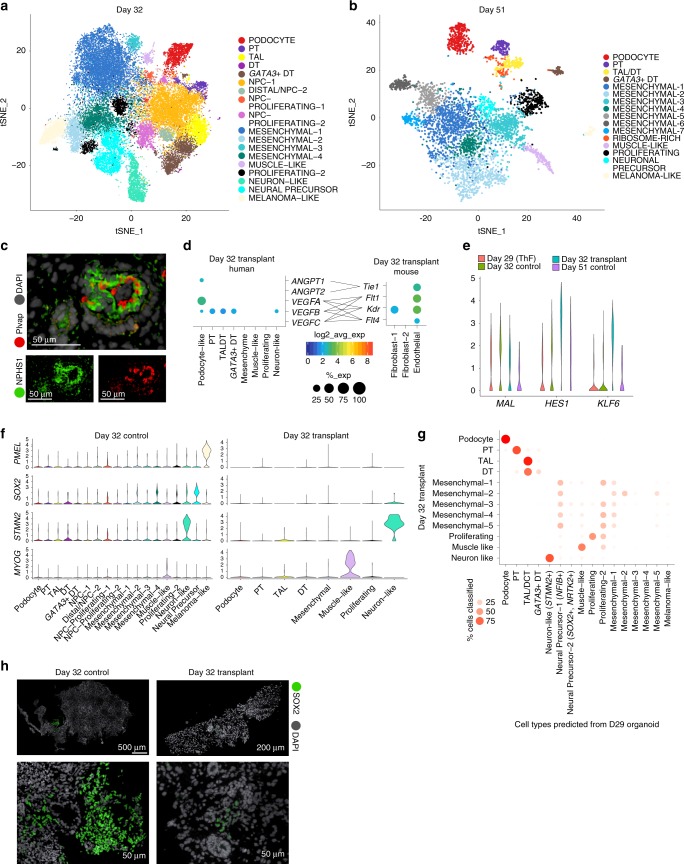
Verification
Claims the paper makes
The claims and statistics of this paper haven’t been checked yet.
Run the check — free, no account needed. It reads the open-access text and checks the sources it cites.
Claims other papers make about this one
Each is checked against this paper’s own text: does it say what the citing paper says it does?
The source backs part of the claim, not all of it — or backs it for a different population, condition or comparison.
In the citing paper
“melanoma-like, neuronal-like, and muscle-like cells were found using scRNA-seq of kidney organoids,72 which were consistent with previous observations using conventional methods in this system.”
From Single-cell transcriptomics of human-skin-equivalent organoids (2023) · cites this paper as [72]
Experimental — accuracy not yet measuredThe cited source says what the claim attributes to it.
In the citing paper
“Recent studies using scRNA-seq to characterize organoid cultures of other tissue types have also identified abnormal cell populations present in their organoid cultures.”
From Single-cell transcriptomics of human-skin-equivalent organoids (2023) · cites this paper as [72]
Self-check
Percentages, sums and reported differences re-computed from the paper’s own numbers.
The self-check needs the paper’s full text.
Citations
Cites
1 retracted
Retraction Note: Carbon enters silica forming a cristobalite-type CO2–SiO2 solid solution
Santoro, M., Gorelli, F. A., Bini, R., Salamat, A., Leonel, G. G., Levelut, C., Cambon, O., & Haines, J. P. (2016) · Nature Communications · doi:10.1038/ncomms13417 · Cited by 143
RetractedControlling the False Discovery Rate: A Practical and Powerful Approach to Multiple Testing
Benjamini, Y., & Hochberg, Y. (1995) · Journal of the Royal Statistical Society Series B: Statistical Methodology · doi:10.1111/j.2517-6161.1995.tb02031.x · Cited by 109,482
Wickham, H. (2016) · Use R! · doi:10.1007/978-3-319-24277-4 · Cited by 34,873
Classification and Regression by randomForest
Liaw, A. I., & Wiener, M. C. (2007) · Cited by 18,594
ggplot2: Elegant Graphics for Data Analysis
Wickham, H. (2009) · doi:10.1007/978-0-387-98141-3 · Cited by 14,447
Integrating single-cell transcriptomic data across different conditions, technologies, and species
Butler, A., Hoffman, P., Smibert, P., Papalexi, E., & Satija, R. (2018) · Nature Biotechnology · doi:10.1038/nbt.4096 · Cited by 13,174
Dissecting the multicellular ecosystem of metastatic melanoma by single-cell RNA-seq
Tirosh, I., Izar, B., Prakadan, S. M., Wadsworth, M. H., Treacy, D., Trombetta, J. J., Rotem, A., Rodman, C., Lian, C., Murphy, G., et al. (2016) · Science · doi:10.1126/science.aad0501 · Cited by 4,944
Self-citationPrevalence of Chronic Kidney Disease in the United States
Coresh, J., Selvin, E., Stevens, L. A., Manzi, J., Kusek, J. W., Eggers, P., Van Lente, F., & Levey, A. S. (2007) · JAMA · doi:10.1001/jama.298.17.2038 · Cited by 4,895
Chronic kidney disease: global dimension and perspectives
Jha, V., Garcia-Garcia, G., Iseki, K., Li, Z., Naicker, S., Plattner, B., Saran, R., Wang, A. Y.-M., & Yang, C.-W. (2013) · The Lancet · doi:10.1016/s0140-6736(13)60687-x · Cited by 4,383
WT-1 is required for early kidney development
Kreidberg, J. A., Sariola, H. V., Loring, J. M., Maeda, M., Pelletier, J., Housman, D. E., & Jaenisch, R. (1993) · Cell · doi:10.1016/0092-8674(93)90515-r · Cited by 1,985
Cited by
Sorted by citations
Items 101–200 of 211
Human Liver Organoid Models for Assessment of Drug Toxicity at the Preclinical Stage
Karabicici, M., Akbari, S., Ertem, Ö., Gümüştekin, M., & Erdal, E. (2023) · Endocrine Metabolic & Immune Disorders - Drug Targets · doi:10.2174/1871530323666230411100121 · Cited by 12
Highly parallel production of designer organoids by mosaic patterning of progenitors
Porter, C. M., Qian, G., Grindel, S. H., & Hughes, A. J. (2024) · Cell Systems · doi:10.1016/j.cels.2024.06.004 · Cited by 12
Krupa, I., Treacy, N. J., Clerkin, S., Davis, J. L., Miller, A. F., Saiani, A., Wychowaniec, J. K., Reynaud, E. G., Brougham, D. F., & Crean, J. K. G. (2024) · Current Protocols · doi:10.1002/cpz1.1096 · Cited by 12
Perspectives in systems nephrology
Lindenmeyer, M. T., Alakwaa, F., Rose, M. P., & Kretzler, M. (2021) · Cell and Tissue Research · doi:10.1007/s00441-021-03470-3 · Cited by 12
Disease Modeling with Kidney Organoids
Karp, S., Pollak, M. R., & Subramanian, B. (2022) · Micromachines · doi:10.3390/mi13091384 · Cited by 13
Experimental and computational technologies to dissect the kidney at the single-cell level
Kuppe, C., Perales-Patón, J., Sáez-Rodríguez, J., & Kramann, R. (2020) · Nephrology Dialysis Transplantation · doi:10.1093/ndt/gfaa233 · Cited by 12
Vascularization of kidney organoids: different strategies and perspectives
Raykhel, I. B., Nishikawa, M., Sakai, Y., Vainio, S. J., & Skovorodkin, I. (2024) · Frontiers in Urology · doi:10.3389/fruro.2024.1355042 · Cited by 12
Urological cancer organoids, patients' avatars for precision medicine: past, present and future
Chen, H., Zhang, W., Maskey, N., Yang, F., Zheng, Z., Li, C., Wang, R., Wu, P., Mao, S., Zhang, J., et al. (2022) · Cell & Bioscience · doi:10.1186/s13578-022-00866-8 · Cited by 15
Microfluidic Techniques for Next‐Generation Organoid Systems
Gong, J., Li, M., Kang, J., Yin, Z., Cha, Z., Yang, J., & Xu, H. (2022) · Advanced Materials Interfaces · doi:10.1002/admi.202200846 · Cited by 12
Towards Modelling Genetic Kidney Diseases with Human Pluripotent Stem Cells
Rooney, K. M., Woolf, A. S., & Kimber, S. J. (2021) · The Nephron journals/Nephron journals · doi:10.1159/000514018 · Cited by 11
Studying Kidney Diseases at the Single-Cell Level
Jiang, M., Chen, H., & Guo, G. (2021) · Kidney Diseases · doi:10.1159/000517130 · Cited by 12
The Value of Single-cell Technologies in Solid Organ Transplantation Studies
Peereboom, E. T. M., Matern, B. M., Spierings, E., & Geneugelijk, K. (2022) · Transplantation · doi:10.1097/tp.0000000000004237 · Cited by 11
Kidney Organoids: Current Advances and Applications
Nakanoh, H., Tsuji, K., Fukushima, K., Uchida, N., Haraguchi, S., Kitamura, S., & Wada, J. (2025) · Life · doi:10.3390/life15111680 · Cited by 12
Mansour, F., Hinze, C., Telugu, N. S., Kresoja‐Rakic, J., Shaheed, I. B., Mosimann, C., Diecke, S., & Schmidt-Ott, K. M. (2022) · eLife · doi:10.7554/elife.80165 · Cited by 9
Replacing renal function using bioengineered tissues
Little, M., & Rabelink, T. (2023) · Nature Reviews Bioengineering · doi:10.1038/s44222-023-00066-0 · Cited by 7
Cell and tissue reprogramming: Unlocking a new era in medical drug discovery
Sen, C. K., Friday, A. J., & Roy, S. (2025) · Pharmacological Reviews · doi:10.1016/j.pharmr.2025.100077 · Cited by 9
Cheng, M., Jansen, J., Reimer, K. C., Grande, V. P., Nagai, J. S., Li, Z., Kießling, P., Graßhoff, M., Kuppe, C., Schaub, M. T., et al. (2025) · Nature Methods · doi:10.1038/s41592-025-02870-5 · Cited by 10
Biomaterial-driven kidney organoid maturation
van Sprang, J. F., de Jong, S. M. J., & Dankers, P. Y. W. (2021) · Current Opinion in Biomedical Engineering · doi:10.1016/j.cobme.2021.100355 · Cited by 9
Christofides, A., Papagregoriou, G., Dweep, H., Makrides, N., Gretz, N., Felekkis, K. N., & Deltas, C. C. (2019) · Cellular and Molecular Life Sciences · doi:10.1007/s00018-019-03294-z · Cited by 9
Cheng, C., Wang, G., Zhu, Y., Wu, H., Zhang, L., Liu, Z., Huang, Y., & Zhang, J. (2024) · Nature Communications · doi:10.1038/s41467-024-48282-5 · Cited by 8
Single-Cell RNA Sequencing in Organ and Cell Transplantation
Abedini‐Nassab, R., Taheri, F., Emamgholizadeh, A., & Naderi‐Manesh, H. (2024) · Biosensors · doi:10.3390/bios14040189 · Cited by 8
Hullegie-Peelen, D. M., Hoogduijn, M. J., Hesselink, D. A., & Baan, C. C. (2021) · Frontiers in Immunology · doi:10.3389/fimmu.2021.607953 · Cited by 8
Techniques of fragile renal organoids transplantation in mice
Matsumoto, N., Matsui, K., Saito, Y., Takamura, T., Yamanaka, S., Yokoo, T., & Kobayashi, E. (2021) · Acta Cirúrgica Brasileira · doi:10.1590/acb361102 · Cited by 8
Can Kidney Organoid Xenografts Accelerate Therapeutic Development for Genetic Kidney Disorders?
Kuo, T., Cabrera-Barragan, D. N., López-Marfil, M., Lopez-Cantu, D. O., & Lemos, D. R. (2022) · Journal of the American Society of Nephrology · doi:10.1681/asn.2022080862 · Cited by 8
Yu, S., Choi, Y. J., Rim, J. H., Kim, H., Bekheirnia, N., Swartz, S. J., Dai, H., Gu, S., Lee, S.-Y., Nishinakamura, R., et al. (2023) · Frontiers in Medicine · doi:10.3389/fmed.2023.1089159 · Cited by 8
Human induced pluripotent stem cell-derived kidney organoids toward clinical implementations
Garreta, E., Nauryzgaliyeva, Z., & Montserrat, N. (2021) · Current Opinion in Biomedical Engineering · doi:10.1016/j.cobme.2021.100346 · Cited by 8
Pahuja, A., Corredera, I. G., Moya‐Rull, D., Garreta, E., & Montserrat, N. (2024) · Current Opinion in Cell Biology · doi:10.1016/j.ceb.2023.102306 · Cited by 9
Patterning the nephron: Forming an axial polarity with distal and proximal specialization
Lindström, N. O., & Vanslambrouck, J. M. (2025) · Current topics in developmental biology/Current Topics in Developmental Biology · doi:10.1016/bs.ctdb.2025.01.005 · Cited by 7
Single Cell Transcriptome Helps Better Understanding Crosstalk in Diabetic Kidney Disease
Du, C., Ren, Y., Li, G., Yang, Y., Yan, Z., & Yao, F. (2021) · Frontiers in Medicine · doi:10.3389/fmed.2021.657614 · Cited by 7
Muto, Y., Li, H., & Humphreys, B. D. (2022) · Springer eBooks · doi:10.1007/978-3-031-11570-7_5 · Cited by 6
Mixing Cells for Vascularized Kidney Regeneration
Namestnikov, M., Pleniceanu, O., & Dekel, B. (2021) · Cells · doi:10.3390/cells10051119 · Cited by 7
Kidney organoid models of polycystic kidney disease: challenges and future directions
Afrin, H., Qamar, U., Robichaud, J. H., Ellabbad, M., Harris, P. C., & Gupta, N. (2025) · American Journal of Physiology-Renal Physiology · doi:10.1152/ajprenal.00116.2025 · Cited by 6
Huang, B., Medina, P., Ma, T., Schreiber, M. E., & Li, Z. (2025) · Nature Protocols · doi:10.1038/s41596-025-01236-7 · Cited by 6
Approaches to kidney replacement therapies—opportunities and challenges
Huang, B., Zeng, Z., Zhang, C. C., Schreiber, M. E., & Li, Z. (2022) · Frontiers in Cell and Developmental Biology · doi:10.3389/fcell.2022.953408 · Cited by 8
Ultrastructural characterization of maturing iPSC ‐derived nephron structures upon transplantation
Wiersma, L. E., Avramut, M. C., Koster, A. J., van den Berg, C. W., & Rabelink, T. J. (2023) · Microscopy Research and Technique · doi:10.1002/jemt.24447 · Cited by 6
Hanhof, C. J. A. O., Yengej, F. A. Y., Rookmaaker, M. B., Verhaar, M. C., van der Wijst, J., & Hoenderop, J. G. J. (2021) · Tissue Engineering Part C Methods · doi:10.1089/ten.tec.2020.0345 · Cited by 6
Application of hiPSCs in tooth regeneration via cellular modulation
Mai, H. N., Kim, E., & Jung, H.-S. (2021) · Journal of Oral Biosciences · doi:10.1016/j.job.2021.05.002 · Cited by 6
Building kidney organoids from pluripotent stem cells
Kobayashi, A., & Nishinakamura, R. (2022) · Current Opinion in Nephrology & Hypertension · doi:10.1097/mnh.0000000000000807 · Cited by 6
Prioritizing Functional Goals as We Rebuild the Kidney
Humphreys, B. D., & Knepper, M. A. (2019) · Journal of the American Society of Nephrology · doi:10.1681/asn.2019101051 · Cited by 6
Comparative Analysis of Human Kidney Organoid and Tubuloid Models
Nunez-Nescolarde, A. B., Santos, L. L., Kong, L., Ekinci, E. I., Moore, P., Dimitriadis, E., Nikolic‐Paterson, D. J., & Combes, A. N. (2025) · Kidney360 · doi:10.34067/kid.0000000834 · Cited by 5
Navarro-Serer, B., & Wood, L. D. (2022) · Pancreas · doi:10.1097/mpa.0000000000002084 · Cited by 5
Single-cell RNA sequencing and kidney organoid differentiation
Uchimura, K. (2023) · Clinical and Experimental Nephrology · doi:10.1007/s10157-023-02359-5 · Cited by 6
In Vivo Assessment of Laboratory-Grown Kidney Tissue Grafts
Chuang, T., Bejar, J., Yue, Z. D., Slavinsky, M., Marciano, D. K., Drummond, I. A. S., & Oxburgh, L. H. (2023) · Bioengineering · doi:10.3390/bioengineering10111261 · Cited by 4
Wilson, S. B., Vanslambrouck, J. M., Murphy, A., Neavin, D. R., Powell, J. E., Howden, S. E., & Little, M. H. (2026) · iScience · doi:10.1016/j.isci.2026.115752 · Cited by 7
Cell type heterogeneity in gene co-expression networks: implications for toxicological research
Bruns, I. B., Li, Y., Stevens, J. L., van de Water, B., & Callegaro, G. (2025) · Briefings in Bioinformatics · doi:10.1093/bib/bbaf421 · Cited by 5
Zhang, D., Zhang, H., Lu, J., & Hu, X. (2023) · Transplantation · doi:10.1097/tp.0000000000004754 · Cited by 4
Emerging Technologies to Study the Glomerular Filtration Barrier
Gong, E., Perin, L., Sacco, S. D., & Sedrakyan, S. (2021) · Frontiers in Medicine · doi:10.3389/fmed.2021.772883 · Cited by 4
Single-Cell and Spatial Analysis of Emergent Organoid Platforms
Kumar, A., Cai, S., Allam, M., Henderson, S., Ozbeyler, M., Saiontz, L., & Coskun, A. F. (2023) · Methods in molecular biology · doi:10.1007/978-1-0716-3163-8_22 · Cited by 4
Models of kidney glomerulus derived from human-induced pluripotent stem cells
Okafor, A. E., Bhattacharya, R., & Musah, S. (2021) · Elsevier eBooks · doi:10.1016/b978-0-12-823809-7.00013-x · Cited by 3
Urinary peptidomics reveals proteases involved in idiopathic membranous nephropathy
Lin, B., Liu, J., Zhang, Y., Wu, Y., Chen, S., Bai, Y., Liu, Q., & Qin, X. (2021) · BMC Genomics · doi:10.1186/s12864-021-08155-3 · Cited by 4
Model Systems of Chronic Kidney Disease: A Detailed Overview and Recent Advances
Lahane, G. P., Dhar, A., & Bhat, A. (2025) · Journal of Biochemical and Molecular Toxicology · doi:10.1002/jbt.70302 · Cited by 3
Guo, L., Fan, Y., Sun, H., Du, H., Xiong, H., Li, Y., Zhang, X., Guan, Y., Ren, L., Wang, X., et al. (2025) · Cell Reports Medicine · doi:10.1016/j.xcrm.2026.102720 · Cited by 4
Xi, Y., & Song, W. (2025) · Cell and Tissue Research · doi:10.1007/s00441-025-04018-5 · Cited by 3
Advances and continuing challenges in differentiation of stem cells to human kidney tissue
Little, M. H., & Wilson, S. B. (2025) · Nature Reviews Nephrology · doi:10.1038/s41581-025-01018-0 · Cited by 4
Skoufa, E., Zhong, J., Hu, K., Kahre, O., Tsissios, G., Carrau, L., Herrera, A., Mantes, A. D., Leleu, M., Castilla‐Ibeas, A., et al. (2025) · Science Advances · doi:10.1126/sciadv.ady7682 · Cited by 5
Kearney, H., Mihaila, S. M., Moroni, L., & Mota, C. (2025) · Advanced Healthcare Materials · doi:10.1002/adhm.202504719 · Cited by 6
Narrative review of proximal tubular epithelial cell in-vitro co-culture models
Varda, L., Petreski, T., Gradišnik, L., Maver, U., & Bevc, S. (2024) · Biofabrication · doi:10.1088/1758-5090/ad9407 · Cited by 3
Shen, S., Werner, T., Lukowski, S. W., Andersen, S. B., Sun, Y., Shim, W. J., Mizikovsky, D., Kobayashi, S., Outhwaite, J. E., Chiu, H. S., et al. (2025) · Nature Communications · doi:10.1038/s41467-025-56533-2 · Cited by 6
Autosomal Dominant Polycystic Kidney Disease: From Pathogenesis to Organoid Disease Models
Scarlat, A., Tomasoni, S., & Trionfini, P. (2025) · Biomedicines · doi:10.3390/biomedicines13071766 · Cited by 3
Kidney Development: Recent Insights from Technological Advances
Röck, R., Rizzo, L., & Lienkamp, S. S. (2022) · Physiology · doi:10.1152/physiol.00041.2021 · Cited by 4
Feng, W. H., Schriever, H. C., Jiang, S., Bais, A. S., Kostka, D., & Li, G. (2020) · bioRxiv (Cold Spring Harbor Laboratory) · doi:10.1101/2020.12.24.424346 · Cited by 3
Stepwise developmental mimicry generates proximal-biased kidney organoidsPreprint
Schnell, J., Miao, Z., Achieng, M. A., Fausto, C. C., Wang, V., Kuyper, F. D., Thornton, M. E., Grubbs, B. H., Kim, J., & Lindström, N. O. (2024) · bioRxiv (Cold Spring Harbor Laboratory) · doi:10.1101/2024.06.28.601028 · Cited by 3
Xu, J., Jiang, M., Koga, S., Zhang, N. R., & Huang, Z. (2026) · Frontiers in Bioinformatics · doi:10.3389/fbinf.2026.1746714 · Cited by 3
Proximity-based proteomics (BioID) uncovers the Rho GTPase interactome in kidney podocytes
Ibrahim, S., Matsuda, J., Nurcombe, Z. W., Boulais, J., Aoudjit, L., Foxman, E., Kazan, C., SUZUKI, S., Leclerc, S., Shimada, N., et al. (2025) · Frontiers in Cell and Developmental Biology · doi:10.3389/fcell.2025.1625950 · Cited by 2
Ma, C., Koh, D., Nishimura, T., Takata, Y., Kameda, Y., Negoro, R., Ishiguro, N., Shibuta, M., Namatame, I., Tetsuka, K., et al. (2026) · Advanced Drug Delivery Reviews · doi:10.1016/j.addr.2026.115887 · Cited by 2
Xenotransplantation — a shortcut to construct tissue complexity in organoids
Yuan, Y., Wang, Y., & Xia, Y. F. (2024) · Current Opinion in Genetics & Development · doi:10.1016/j.gde.2024.102243 · Cited by 2
Roos-Mattila, M., Kallio, P., Luck, T. J., Polso, M., Kumari, R., Mikkonen, P., Välimäki, K. E., Malmstedt, M., Ellonen, P., Pellinen, T. S., et al. (2024) · Communications Biology · doi:10.1038/s42003-024-07004-9 · Cited by 2
Du, Z., Shankar, A., van den Bosch, T. P. P., Korevaar, S. S., Groningen, M. C. C., Hoorn, E. J., Gribnau, J. H., Reinders, M. E. J., Baan, C. C., & Hoogduijn, M. J. (2021) · Stem Cells and Development · doi:10.1089/scd.2021.0197 · Cited by 2
A translational kidney organoid system bolsters human relevance of clinical development candidatePreprint
Westerling-Bui, A. D., Soare, T. W., Venkatachalan, S. P., DeRan, M., Fast, E. M., Fanelli, A. B., Kyrychenko, S., Hoang, H. G., Corriea, G. M., Zhang, W., et al. (2019) · bioRxiv (Cold Spring Harbor Laboratory) · doi:10.1101/2019.12.30.891440 · Cited by 2
Self-citationBlocking the Rac1-TRPC5 pathway protects human podocytesPreprint
Zhou, Y., Kim, C., Pablo, J. L., Zhang, F., Jung, J. Y., Xiao, L., Bazúa, S., Emani, M., Hopkins, C. R., Weins, A., et al. (2020) · bioRxiv (Cold Spring Harbor Laboratory) · doi:10.1101/2020.08.28.272344 · Cited by 2
Self-citationShen, S., Werner, T. R., Lukowski, S. W., Andersen, S. B., Sun, Y., Shim, W. J., Mizikovsky, D., Kobayashi, S., Outhwaite, J. E., Chiu, H. S., et al. (2022) · bioRxiv (Cold Spring Harbor Laboratory) · doi:10.1101/2022.10.12.511862 · Cited by 2
Schumacher, A., Joris, V., van Griensven, M., & LaPointe, V. L. S. (2023) · bioRxiv (Cold Spring Harbor Laboratory) · doi:10.1101/2023.03.27.534124 · Cited by 2
Huang, B., Zeng, Z., Li, H., Li, Z., Chen, X., Guo, J., Zhang, C. C., Schreiber, M. E., Vonk, A. C., Xiang, T., et al. (2023) · bioRxiv (Cold Spring Harbor Laboratory) · doi:10.1101/2023.05.25.542343 · Cited by 2
Metabolic reprogramming by endothelial ANGPTL4 depletion protects against diabetic kidney diseasePreprint
Srivastava, S. P., Zhou, H., Shenoi, R., Morris, M., Lainez, B., Takagaki, Y., Rajendran, B. K., Setia, O., Aryal, B. K., Kanasaki, K., et al. (2025) · bioRxiv (Cold Spring Harbor Laboratory) · doi:10.1101/2025.05.08.652142 · Cited by 2
Zhang, D., Chiu, C.-L., Wen, R. M., Qiu, Z., Garcia-Marques, F. J., Bermudez, A., Zhao, M., Zhao, H., Dixon, S. J., Peehl, D. M., et al. (2025) · iScience · doi:10.1016/j.isci.2025.113515 · Cited by 2
Ma, Z., Hou, Q., Yang, R., Shi, J., Kan, S., Zheng, C.-X., Zhu, X., Liu, Z.-H., & Jiang, S. (2025) · Genome Medicine · doi:10.1186/s13073-025-01590-x · Cited by 1
Fibrosis as the Engine of Kidney Functional Decline
Koch, L., Dilmen, E., Jansen, J., & Kramann, R. (2026) · Journal of the American Society of Nephrology · doi:10.1681/asn.0000001154 · Cited by 2
Kong, S.-Y., & Kim, D. (2026) · Biofabrication · doi:10.1088/1758-5090/ae94b5 · Cited by 1
Kidney-On-Chip and Organoid Models
Daily, A., Anandakrishnan, N., Haydak, J. C., Himmelfarb, J., & Azeloglu, E. U. (2026) · Journal of the American Society of Nephrology · doi:10.1681/asn.0000001272 · Cited by 1
Dissecting nephron morphogenesis using kidney organoids from human pluripotent stem cells
Garreta, E., Nauryzgaliyeva, Z., Marco, A., Safi, W., & Montserrat, N. (2021) · Current Opinion in Genetics & Development · doi:10.1016/j.gde.2021.10.002 · Cited by 1
Vascularization of organoids in microfluidic chips
Chowdary, P., Yadav, D. N., Pogu, S. V., & Rengan, A. K. (2024) · Elsevier eBooks · doi:10.1016/b978-0-443-13782-2.00016-4 · Cited by 1
Progress of Induced Pluripotent Stem Cell-Derived Renal Organoids in Clinical Application
Ning, N., Liu, Z., Li, X., Liu, Y., & Song, W. (2024) · Kidney Diseases · doi:10.1159/000541919 · Cited by 2
Ferreira, R. M., Sabo, A. R., Winfree, S., Collins, K. S., Janosevic, D., Gulbronson, C. J., Cheng, Y., Casbon, L., Barwinska, D., Ferkowicz, M. J., et al. (2021) · bioRxiv (Cold Spring Harbor Laboratory) · doi:10.1101/2021.01.19.427258 · Cited by 1
A Cultured Sensorimotor Organoid Model Forms Human Neuromuscular JunctionsPreprint
Pereira, J. D., DuBreuil, D. M., Devlin, A., Held, A., Sapir, Y., Berezovski, E., Hawrot, J., Dorfman, K., Chander, V., & Wainger, B. J. (2021) · bioRxiv (Cold Spring Harbor Laboratory) · doi:10.1101/2021.03.03.433128 · Cited by 1
Hun, M., Wen, H., Wen, M., Tian, Q., Wang, Z., Han, P., Vun, T., Som, T., Preap, B., Zhao, M., et al. (2023) · doi:10.22541/au.168620819.99240467/v1 · Cited by 1
Amniotic Fluid Organoids As Personalized Tools For Real-Time Modeling Of The Developing FetusPreprint
Babošová, O., Weisz, B., Rabinowitz, G., Avnet, H., Shani, H., Schwartz, A., Batsry, L., Pardo, N., Miller, T. E., Stockheim, D., et al. (2023) · bioRxiv (Cold Spring Harbor Laboratory) · doi:10.1101/2023.10.05.561078 · Cited by 1
Reprogramming toward kidney regeneration: New technologies and future promises
Xia, Y. F., & Belmonte, J. C. I. (2021) · Elsevier eBooks · doi:10.1016/b978-0-12-823318-4.00006-8
Modeling heritable kidney disease using human kidney iPSC-derived organoids
Forbes, T. A., & Little, M. H. (2021) · Elsevier eBooks · doi:10.1016/b978-0-323-85765-9.00003-5
Berichtigungsmöglichkeiten bei fehlerhafter Auswahl des Beklagten
Clasen, J. D. (2007) · Neue Juristische Wochenschrift: NJW
Transplantation of human iPSC-derived kidney organoids
Kim, Y. K., & Freedman, B. (2022) · Elsevier eBooks · doi:10.1016/b978-0-323-99892-5.00012-8
Liu, M. (2023) · DR-NTU (Nanyang Technological University) · doi:10.32657/10356/172816
Single-Cell Drug Perturbations Prediction Using Machine Learning
Prajapati, M., Baliarsingh, S. K., Dev, P. P., Nayak, S., & Biswal, M. R. (2024) · Communications in computer and information science · doi:10.1007/978-3-031-64067-4_3
PHLOWER - Single cell trajectory analysis using Hodge DecompositionPreprint
Cheng, M., Jansen, J., Reimer, K. C., Grande, V., Nagai, J. S., Li, Z., Kießling, P., Graßhoff, M., Kuppe, C., Schaub, M. T., et al. (2024) · bioRxiv (Cold Spring Harbor Laboratory) · doi:10.1101/2024.10.01.613179
Muto, Y., Li, H., & Humphreys, B. D. (2024) · Springer eBooks · doi:10.1007/978-3-031-65236-3_5
Zueva, A. S., Shevchenko, A. I., Medvedev, S. P., Elisaphenko, E. A., Sleptcov, A. A., Nazarenko, M. S., Tmoyan, N. A., Zakian, S. M., & Zakharova, I. S. (2025) · Vavilov Journal of Genetics and Breeding · doi:10.18699/vjgb-25-22
Liu, H., Xi, W., Shi, Y., Zhou, Y., Chen, X., Song, W., Zhang, X., Wang, Y., Hao, J., Ma, Y., et al. (2025) · bioRxiv (Cold Spring Harbor Laboratory) · doi:10.1101/2025.07.10.664023
Self-citationAdditional file 1 of Single-cell RNA sequencing for the study of kidney disease
Zhu, J., Lu, J., & Weng, H. (2024) · Figshare · doi:10.6084/m9.figshare.26601703
Pecksen, E., Tkachuk, S., Schröder, C., Enrich, M. V., Neog, A., Johnson, C. P., Lachmann, N., Haller, H. G., & Kiyan, Y. (2024) · Figshare · doi:10.6084/m9.figshare.26715997
Pecksen, E., Tkachuk, S., Schröder, C., Enrich, M. V., Neog, A., Johnson, C. P., Lachmann, N., Haller, H. G., & Kiyan, Y. (2024) · Figshare · doi:10.6084/m9.figshare.26715994
Metadata
- Authors
- Subramanian, A., Sidhom, E.-H., Emani, M., Vernon, K., Sahakian, N., Zhou, Y., Kost-Alimova, M., Slyper, M., Waldman, J., Dionne, D., Nguyen, L. T., Weins, A., Marshall, J. L., Rosenblatt-Rosen, O., Regev, A., & Greka, A.
- Affiliations
- Broad Institute (US)
- Brigham and Women's Hospital (US)
- Corresponding author
- Greka, Anna
- ORCID
- Venue
- Nature Communications
- Published
- 2019-11-29
- Volume
- 10
- Issue
- 1
- Pages
- 5462-5462
- ISSN
- 2041-1723 (ISSN-L)
- PMC
- PMC6884507
- OpenAlex
- W2990026706
- Cited by
- 211
- References
- 96
- Citations by year
- 2026: 12 · 2025: 27 · 2024: 36 · 2023: 28 · 2022: 39 · 2021: 44 · 2020: 18 · 2019: 6
- FWCI
- 8.85
- Type
- journal article
- Language
- en
- Open access
- gold
- doi.org
- Locations
- Nature Communications (publishedVersion, cc-by)
- bioRxiv (Cold Spring Harbor Laboratory) (acceptedVersion, cc-by-nd)
- PubMed Central (publishedVersion, cc-by)
- PubMed (publishedVersion)
- RePEc: Research Papers in Economics (submittedVersion)
- DOAJ (DOAJ: Directory of Open Access Journals) (submittedVersion)
- DOAJ (DOAJ: Directory of Open Access Journals) (submittedVersion, cc-by-sa)
- DSpace@MIT (Massachusetts Institute of Technology) (submittedVersion, cc-by-nc)
- Nature
- Funders
- U.S. Department of Health & Human Services | NIH | National Institute of Diabetes and Digestive and Kidney Diseases (DK099465, DK095045)
- the Slim Initiative for Genomic Medicine in the Americas (SIGMA), and an NDSEG fellowship
- Topics
- Life Sciences › Biochemistry, Genetics and Molecular Biology › Molecular Biology › Pluripotent Stem Cells Research
- Life Sciences › Biochemistry, Genetics and Molecular Biology › Molecular Biology › Single-cell and spatial transcriptomics
- Health Sciences › Medicine › Oncology › Renal and related cancers
- Keywords
- kidney organoids, induced pluripotent stem cells, single-cell RNA sequencing, reproducibility, organoid transplantation, kidney capsule transplantation
- MeSH terms
- Animals, Cell Differentiation, Cell Line, Humans, Kidney, Organoids, Transplantation, Heterologous, Reproducibility of Results, Kidney Transplantation, Sequence Analysis, RNA, Gene Expression Regulation, Developmental, Mice, Induced Pluripotent Stem Cells, Single-Cell Analysis
About these checks
Registry, retraction, Cites and statistics results are computed, not judged, with one exception: a printed reference that no index lists is read once by a model before it counts as a citation error. Claims are extracted by a model and kept only when their quote appears verbatim in the text; each cited source is then checked, with a model’s help, for whether it says what the claim relies on. Those verdicts can be wrong — read the claim’s quote and the cited source before relying on one.
Statistics and arithmetic are recomputed, not judged.
Confidence bands are shown only for fields calibrated on our annotated test set. None is calibrated yet, so no band is shown.
What counts as a claim ›How we measure confidence ›How we check this ›
Are you an author, or do you see a problem with this page? Request a review
