

The DOI matches its Crossref record; 58 of the 58 references it cites were found in a registry or an index; none of the 48 sources its claims cite is checked for support yet.
Gap-enhanced Raman tags for physically unclonable anticounterfeiting labels
Open accessAbstract
Anticounterfeiting labels based on physical unclonable functions (PUFs), as one of the powerful tools against counterfeiting, are easy to generate but difficult to duplicate due to inherent randomness. Gap-enhanced Raman tags (GERTs) with embedded Raman reporters show strong intensity enhancement and ultra-high photostability suitable for fast and repeated readout of PUF labels. Herein, we demonstrate a PUF label fabricated by drop-casting aqueous GERTs, high-speed read using a confocal Raman system, digitized through coarse-grained coding methods, and authenticated via pixel-by-pixel comparison. A three-dimensional encoding capacity of over 3 × 10 15051 can be achieved for the labels composed of ten types of GERTs with a mapping resolution of 2500 pixels and quaternary encoding of Raman intensity levels at each pixel. Authentication experiments have ensured the robustness and security of the PUF system, and the practical viability is demonstrated. Such PUF labels could provide a potential platform to realize unbreakable anticounterfeiting.
Overview
CoChat Summary
TL;DR
The paper demonstrates SERS-based physical unclonable function labels made from drop-cast gap-enhanced Raman tags (GERTs), read by confocal Raman mapping and digitized for authentication. Ten GERT types with 50 × 50-pixel quaternary encoding yield a theoretical encoding capacity of 3.2 × 10^15051, with authentication separating same-label from different-label readouts.
Key findings
- PUF labels were fabricated by drop-casting aqueous GERTs, read using a confocal Raman system, digitized through coarse-grained coding, and authenticated via pixel-by-pixel comparison.
- The labels use three-dimensional encoding: pixel position, GERT type, and Raman intensity level. For ten GERT types at 50 × 50 pixels (2500 pixels) with quaternary encoding, the theoretical capacity is (4^10)^2500 = 3.2 × 10^15051; binary encoding gives (2^10)^2500 = 5.6 × 10^7525. A one-type 4-NBT GERT label at 50 × 50 pixels gives 4^2500 = 1.4 × 10^1505 for quaternary and 2^2500 = 3.8 × 10^752 for binary.
- Authentication used 100 PUF labels, each measured three times. Same-label similarity indexes were around 94% for binary and 84% for quaternary encoding; different-label indexes dropped to around 57% for binary and 30% for quaternary. Suggested error margins were 85% for binary and 70% for quaternary, with distribution gaps of around 20% and 30%, respectively.
- High-speed readout in DuoScan/SWIFT mode acquired a 50 × 50-pixel map in 6 s with about 0.7 ms exposure per pixel, whereas STAGE mode required 20 min for the same resolution. A practical label on Scotch tape (1.8 × 1.8 mm²) was read at 50 × 50 pixels with 10 ms per pixel.
Methods
- Core-shell GERTs with Au core/shell and Raman reporters embedded in a ~1 nm nanogap were synthesized using ten thiolated aromatic reporter molecules. Labels were made by drop-casting 2 μL of GERT solution onto a silica substrate or Scotch tape, using one, three, or ten GERT types.
- Readout used a confocal Raman system (LabRAM XploRA INV, Horiba) with a 785 nm laser, 3 × 10^5 W cm−2, 60× objective, and 10- or 50-ms exposure per pixel. Mapping was performed in STAGE or DuoScan/SWIFT modes at resolutions of 2 × 2, 10 × 10, and 50 × 50 pixels.
- Analysis included Savitzky–Golay smoothing, baseline correction, Z-score standardization, non-negative least squares (NNLS) demultiplexing for ten GERT types, global search threshold determination, and coarse-grained coding to binary {0,1} or quaternary {0,1,2,3}. Authentication used similarity index I by pixel-by-pixel comparison; 100 labels were split into 70 training and 30 test labels, each measured three times.
Limitations
- Stated in the paper: readout speed still lags behind some other PUF labels, such as silicon PUFs, and is not yet enough for manufacturer’s registration; a protection layer and physical robustness need future work; digitization thresholds and error margins are preliminary and could be optimized with more sample data; a possible vulnerability is replacement of digitized signals uploaded to a cloud server, which the authors propose addressing with algorithmic encoding.
- Stated in the paper: real encoding capacity shrinks when an error margin is introduced, and no fabrication method accesses all states with equal probability; small readout variations can significantly reduce real capacity. NNLS demultiplexing caused all GERT types to appear strongest at the same pixel, likely due to spectral overlap and signal bleed from exceptionally bright particles, which could be avoided with more spectrally distinct reporters or an improved algorithm.
- Evident from the text: the 100-label authentication study used only 4-NBT GERT labels at 50 × 50 pixels, so the reported same-label/different-label similarity statistics and error margins are not demonstrated for the ten-type GERT labels.
Model-written summary. Check it against the paper before relying on it.
Integrity signals
Registry
Cites
Statistics
Figures




Verification
Claims the paper makes
0 Valid · 6 Not valid · 24 Not checked · 58 Own results and interpretations
A result the paper states — it cites no source for it, so there is none to check. The quote shows it is in the paper.
In the paper
“Compared to the one-type GERT PUF label, the ten-type label with a resolution of 10 × 10 pixels has a much larger theoretical encoding capacity of (210)100 (1.1 × 10301) and (410)100 (1.1 × 10602) for binary and quaternary encoding, respectively.”
§ Gap-enhanced Raman tags for physically unclonable anticounterfeiting labels > Results > PUF labels composed of multi-types of GERTs
plainstates a cause- Asserted: passes — The authors put it forward as true.
- Checkable: passes — It can be checked against evidence.
- Load-bearing: passes — The paper’s conclusions depend on it.
- Based: passes — The paper gives a reason why it holds.
A result the paper reports from its own data — it cites no other source for it, so there is none to check. The quote shows it is in the paper.
In the paper
“obvious disparity could be observed between these labels and the one displayed in Fig. 5a, b.”
§ Gap-enhanced Raman tags for physically unclonable anticounterfeiting labels > Results > Authentication of PUF labels
hedged- Asserted: passes — The authors put it forward as true.
- Checkable: passes — It can be checked against evidence.
- Load-bearing: passes — The paper’s conclusions depend on it.
- Based: passes — The paper gives a reason why it holds.
A result the paper reports from its own data — it cites no other source for it, so there is none to check. The quote shows it is in the paper.
In the paper
“Table S2 shows that I11′ for binary encoding is larger than that for quaternary encoding”
§ Gap-enhanced Raman tags for physically unclonable anticounterfeiting labels > Results > Authentication of PUF labels
plainstates an association- Asserted: passes — The authors put it forward as true.
- Checkable: passes — It can be checked against evidence.
- Load-bearing: passes — The paper’s conclusions depend on it.
- Based: passes — The paper gives a reason why it holds.
A result the paper states — it cites no source for it, so there is none to check. The quote shows it is in the paper.
In the paper
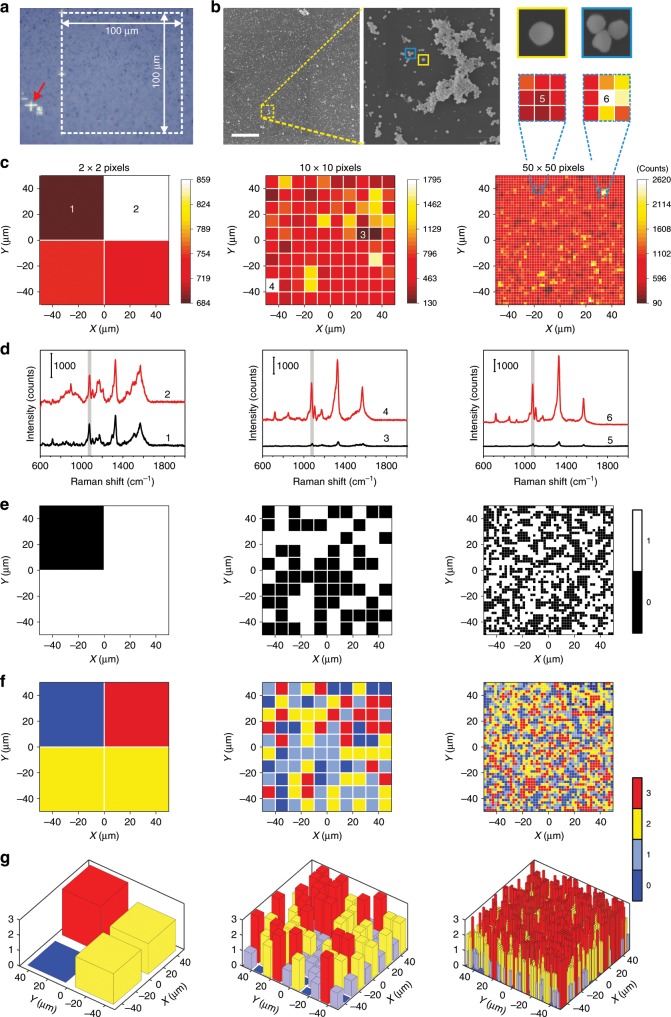
“It is noteworthy that the difference in Raman intensity between the maximum and the minimum values of the measured pixels increases with higher resolution (Fig. 3c, d).”
§ Gap-enhanced Raman tags for physically unclonable anticounterfeiting labels > Results > Fabrication and digitization of PUF labels composed of one-type of GERTs
plainstates a cause- Asserted: passes — The authors put it forward as true.
- Checkable: passes — It can be checked against evidence.
- Load-bearing: passes — The paper’s conclusions depend on it.
- Based: passes — The paper gives a reason why it holds.
A result the paper reports from its own data — it cites no other source for it, so there is none to check. The quote shows it is in the paper.
In the paper
“The digitized mappings in Fig. 3e, f show uniform distributions of different intensity levels, especially the ones with higher resolutions, which is in favor of a large real encoding capacity.”
§ Gap-enhanced Raman tags for physically unclonable anticounterfeiting labels > Results > Fabrication and digitization of PUF labels composed of one-type of GERTs
plainstates an association- Asserted: passes — The authors put it forward as true.
- Checkable: passes — It can be checked against evidence.
- Load-bearing: passes — The paper’s conclusions depend on it.
- Based: passes — The paper gives a reason why it holds.
30 more claims
Create a free account to see all 88 claims and to verify the 47 references still open.
- It may state two separate claims as one. 38
- Probably not a substantial claim. 18
- The quote only partly states this claim. 1
Self-check
Percentages, sums and reported differences re-computed from the paper’s own numbers.
Each contradiction between two passages listed here was confirmed by an independent check.
Rated minor: it would not touch a result — a value no result rests on, a p-value that stays on the same side of the significance level, or a conflict that is clerical, resolved elsewhere in the paper, or outside its own findings.
In the paper
“Herein, N = 70 × 30 = 210.”
§ Gap-enhanced Raman tags for physically unclonable anticounterfeiting labels > Methods > Digitization and authentication of PUF labels
Reported 210 · recomputed 2100
Rated minor: it would not touch a result — a value no result rests on, a p-value that stays on the same side of the significance level, or a conflict that is clerical, resolved elsewhere in the paper, or outside its own findings.
In the paper
§ Gap-enhanced Raman tags for physically unclonable anticounterfeiting labels > Results > PUF labels composed of multi-types of GERTs
“The separated mapping images were then quantized with the Gerchberg–Saxton (GS) algorithm and the coarse-grained coding method.”
§ Gap-enhanced Raman tags for physically unclonable anticounterfeiting labels > Results > Fabrication and digitization of PUF labels composed of one-type of GERTs
“Next, a global search (GS) algorithm was employed for threshold determination”
Citations
Cites
Probing Single Molecules and Single Nanoparticles by Surface-Enhanced Raman Scattering
Nie, S., & Emory, S. R. (1997) · Science · doi:10.1126/science.275.5303.1102 · Cited by 10,238
SERS Tags: Novel Optical Nanoprobes for Bioanalysis
Wang, Y., Yan, B., & Chen, L. (2013) · Chemical Reviews · doi:10.1021/cr300120g · Cited by 1,331
Measurement of the Distribution of Site Enhancements in Surface-Enhanced Raman Scattering
Fang, Y., Seong, N.-H., & Dlott, D. D. (2008) · Science · doi:10.1126/science.1159499 · Cited by 1,146
Physical unclonable functions generated through chemical methods for anti-counterfeiting
Arppe, R., & Sørensen, T. J. (2017) · Nature Reviews Chemistry · doi:10.1038/s41570-017-0031 · Cited by 664
A Comparison of Four Algorithms for Change Detection in an Urban Environment
RIDD, M. K., & Liu, J. (1998) · Remote Sensing of Environment · doi:10.1016/s0034-4257(97)00112-0 · Cited by 643
The Synthesis of SERS-Active Gold Nanoflower Tags for In Vivo Applications
Xie, J., Zhang, Q., Lee, J. Y., & Wang, D. I. C. (2008) · ACS Nano · doi:10.1021/nn800442q · Cited by 622
Kumar, P., Singh, S., & Gupta, B. K. (2016) · Nanoscale · doi:10.1039/c5nr06965c · Cited by 529
von Maltzahn, G., Centrone, A., Park, J., Ramanathan, R., Sailor, M. J., Hatton, T. A., & Bhatia, S. N. (2009) · Advanced Materials · doi:10.1002/adma.200803464 · Cited by 455
Universal process-inert encoding architecture for polymer microparticles
Lee, J., Bisso, P. W., Srinivas, R. L., Kim, J. J., Swiston, A. J., & Doyle, P. S. (2014) · Nature Materials · doi:10.1038/nmat3938 · Cited by 418
Smith, A. F., Patton, P., & Skrabalak, S. E. (2016) · Advanced Functional Materials · doi:10.1002/adfm.201503989 · Cited by 416
Research works printed but not linked: 6
- Jung, L., Hayward, J. A., Liang, M. B. & Berrada, A., Vol. 9, 266, 370 (Google Patents, 2016).
- Sleat, R. & Van Lint, G., Vol. 8, 783, 194 (Google Patents, 2014).
- Kydd, P.H., Vol. 4, 441, 943 (Google Patents, 1984).
- Rührmair, U. et al. Revisiting optical physical unclonable functions. IACR Cryptol. ePrint Arch. 2013, 215 (2013).
- Kreyszig, E. Advanced Engineering Mathematics. 4th edn (John Wiley & Sons, Inc, 1979).
- Gassend, B., Clarke, D., Van Dijk, M. & Devadas, S. in Proceedings of the 9th ACM Conference on Computer and Communications Security. 148–160 (ACM, 2002).
Cited by
Luminescence anti‐counterfeiting: From elementary to advanced
Yu, X., Zhang, H., & Yu, J. (2021) · Aggregate · doi:10.1002/agt2.15 · Cited by 536
Colloidal Self-Assembly Approaches to Smart Nanostructured Materials
Li, Z., Fan, Q., & Yin, Y. (2022) · Chemical Reviews · doi:10.1021/acs.chemrev.1c00482 · Cited by 468
Lin, L. L., Alvarez-Puebla, R., Liz-Marzán, L. M., Trau, M., Wang, J., Fabris, L., Wang, X., Liu, G., Xu, S., Han, X. X., et al. (2025) · ACS Applied Materials & Interfaces · doi:10.1021/acsami.4c17502 · Cited by 247
Nanoscale physical unclonable function labels based on block copolymer self-assembly
Kim, J. H., Jeon, S., In, J. H., Nam, S., Jin, H. M., Han, K. H., Yang, G. G., Choi, H. J., Kim, K. M., Shin, J., et al. (2022) · Nature Electronics · doi:10.1038/s41928-022-00788-w · Cited by 167
Artificial Intelligence for Surface‐Enhanced Raman Spectroscopy
Bi, X., Lin, L. L., Chen, Z., & Ye, J. (2023) · Small Methods · doi:10.1002/smtd.202301243 · Cited by 164
Metadata
- Authors
- Gu, Y., He, C., Zhang, Y., Lin, L., Thackray, B. D., & Ye, J.
- Venue
- Nature Communications
- Published
- 2020-01-24
- Volume
- 11
- Issue
- 1
- Pages
- 516-516
- ISSN
- 2041-1723 (ISSN-L)
- PMC
- PMC6981139
- OpenAlex
- W3002885741
- Cited by
- 268
- References
- 58
- Citations by year
- 2026: 36 · 2025: 51 · 2024: 56 · 2023: 52 · 2022: 41 · 2021: 23 · 2020: 9
- FWCI
- 24.53
- Type
- journal article
- Language
- en
- Open access
- gold
- doi.org
- Licence
- cc-by
- creativecommons.org/licenses/by/4.0 (tdm)
- creativecommons.org/licenses/by/4.0 (vor)
- Locations
- Nature Communications (publishedVersion, cc-by)
- Europe PMC (PubMed Central) (publishedVersion, cc-by)
- PubMed (publishedVersion)
- PubMed Central (publishedVersion, cc-by)
- RePEc: Research Papers in Economics (submittedVersion)
- DOAJ (DOAJ: Directory of Open Access Journals) (submittedVersion, cc-by-sa)
- DOAJ (DOAJ: Directory of Open Access Journals) (submittedVersion)
- Funders
- National Natural Science Foundation of China (81871401, 81622026, 81571763)
- Shanghai Municipal Education Commission (ZXWF082101, No. ZXWF082101)
- Science and Technology Commission of Shanghai Municipality (19441905300)
- Shanghai Jiao Tong University (YG2019QNA28, YG2016MS51, YG2017MS54)
- Ruijin Hospital
- Shanghai Key Laboratory of Gynecologic Oncology
- Topics
- Physical Sciences › Computer Science › Hardware and Architecture › Physical Unclonable Functions (PUFs) and Hardware Security
- Physical Sciences › Materials Science › Electronic, Optical and Magnetic Materials › Gold and Silver Nanoparticles Synthesis and Applications
- Physical Sciences › Computer Science › Information Systems › QR Code Applications and Technologies
- Keywords
- physical unclonable functions, Raman reporters, photostability, encoding capacity
About these checks
Registry, retraction, Cites and statistics results are computed, not judged, with one exception: a printed reference that no index lists is read once by a model before it counts as a citation error. Claims are extracted by a model and kept only when their quote appears verbatim in the text; each cited source is then checked, with a model’s help, for whether it says what the claim relies on. Those verdicts can be wrong — read the claim’s quote and the cited source before relying on one.
A language model drew the claims from the paper on 2026-11-19, under version 3 of the claim definition (model deepseek-v4.1-flash, prompt extract-v3).
A second model labelled each claim on 2026-11-19 (model jev-1.13-20260917, definition revision gold-guideline-v0.2).
Statistics and arithmetic are recomputed, not judged.
Confidence bands are shown only for fields calibrated on our annotated test set. None is calibrated yet, so no band is shown.
What counts as a claim ›How we measure confidence ›How we check this ›
Are you an author, or do you see a problem with this page? Request a review
How to cite
Cite CoChat for the checks on this page, and the paper for its own findings.
- This page
- CoChat. (2026). Citation check: Gap-enhanced Raman tags for physically unclonable anticounterfeiting labels. https://app.cochat.ai/papers/10.1038/s41467-019-14070-9
- The paper
- Gu, Y., He, C., Zhang, Y., Lin, L., Thackray, B. D., & Ye, J. (2020). Gap-enhanced Raman tags for physically unclonable anticounterfeiting labels. Nature Communications. https://doi.org/10.1038/s41467-019-14070-9
Data sources
Bibliographic data: Semantic Scholar, OpenAlex, Crossref.
Contains information from the Semantic Scholar Academic Graph Datasets, made available under the ODC Attribution License (ODC-BY 1.0).
Semantic Scholar’s data is described in: Kinney, R., et al. (2023). The Semantic Scholar Open Data Platform. arXiv:2301.10140.
