Cited by 200Cancer, Hypoxia, and MetabolismAutophagy in Disease and TherapyCancer, Lipids, and Metabolism

The DOI matches its Crossref record; 70 of the 71 references it cites were found in a registry or an index.

Macropinocytosis confers resistance to therapies targeting cancer anabolism

Open access
Jayashankar, Vaishali, Edinger, Aimee L.·2020·Nature Communications

Abstract

Macropinocytic cancer cells scavenge amino acids from extracellular proteins. Here, we show that consuming necrotic cell debris via macropinocytosis (necrocytosis) offers additional anabolic benefits. A click chemistry-based flux assay reveals that necrocytosis provides not only amino acids, but sugars, fatty acids and nucleotides for biosynthesis, conferring resistance to therapies targeting anabolic pathways. Indeed, necrotic cell debris allow macropinocytic breast and prostate cancer cells to proliferate, despite fatty acid synthase inhibition. Standard therapies such as gemcitabine, 5-fluorouracil (5-FU), doxorubicin and gamma-irradiation directly or indirectly target nucleotide biosynthesis, creating stress that is relieved by scavenged nucleotides. Strikingly, necrotic debris also render macropinocytic, but not non-macropinocytic, pancreas and breast cancer cells resistant to these treatments. Selective, genetic inhibition of macropinocytosis confirms that necrocytosis both supports tumor growth and limits the effectiveness of 5-FU in vivo. Therefore, this study establishes necrocytosis as a mechanism for drug resistance.

Overview

The claims and statistics of this paper haven’t been checked yet.

Run the check — free, no account needed. It reads the open-access text and checks the sources it cites.

A few free checks a day · papers already verified open instantly · results are public

Integrity signals

Registry

Crossref · 10.1038/s41467-020-14928-3

Cites

70 of 70 references verified0 citation errors · 0 not checkable

Statistics

Figures

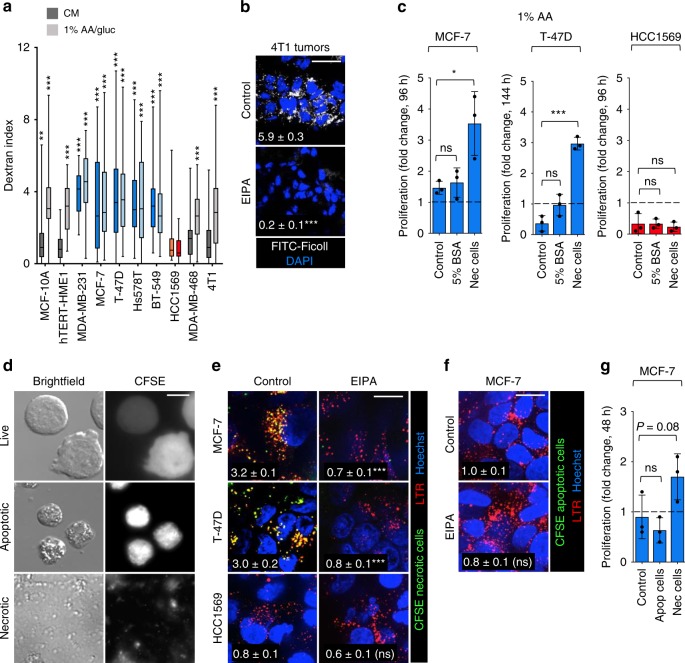
Fig. 1 Macropinocytosis supports proliferation in nutrient-deprived breast cancer cells. a Dextran index in complete medium (CM) or 1% AA/gluc medium. Gray (contextual), blue (constitutive), and red (non-macropinocytic) cell lines. Statistics compare cells ± EIPA (50 μM). Using an unpaired, two-tailed t-test, ***P ≤ 0.001; no asterisk, P > 0.05; 40 cells were evaluated from n = 3 except for MCF10A where n = 2. In box plots, the center line is the median, the box is delimited by the 25th and 75th percentile, and whiskers represent minimum and maximum values. b FITC-Ficoll uptake in orthotopic 4T1 tumors ± EIPA (10 mg/kg). Ficoll field index calculated from 15 fields from four tumor sections; shown in white. Using an unpaired, two-tailed t test, ***P ≤ 0.001. c Proliferation of macropinocytic MCF-7 and T-47D cells or non-macropinocytic HCC1569 cells in 1% AA medium ± albumin (5%) or necrotic debris (0.2% protein). Mean ± SD, n = 3. Using a one-way ANOVA and Dunnett’s correction, *P ≤ 0.05, ***P ≤ 0.001, ns, not significant P > 0.05. d IL-3 was withdrawn from CFSE-labeled FL5.12 cells for 24 or 72 h to produce apoptotic cells or necrotic cell debris, respectively. e Uptake of CFSE-labeled necrotic debris in 1% AA/gluc ± EIPA (50 μM). f As in e but with CFSE-labeled apoptotic cells. In e, f cells were also stained with LysoTracker Red (LTR). Percent of cell area positive for CFSE in white. Using an unpaired, two-tailed t-test, ***P ≤ 0.001; ns, not significant, P > 0.05; n = 40 cells from two independent experiments. g MCF-7 cell proliferation in 1% AA ± apoptotic cells (1% protein) or necrotic cell debris (0.2% protein). Proliferation was evaluated at 48 h to avoid secondary necrosis of apoptotic cells. Mean ± SD, n = 3. Using a one-way ANOVA and Dunnett’s correction, ns, not significant, P > 0.05. Scale bars, 10 µm (d) or 20 µm (b, e and f).
Fig. 1 Macropinocytosis supports proliferation in nutrient-deprived breast cancer cells. a Dextran index in complete medium (CM) or 1% AA/gluc medium. Gray (contextual), blue (constitutive), and red (non-macropinocytic) cell lines. Statistics compare cells ± EIPA (50 μM). Using an unpaired, two-tailed t-test, ***P ≤ 0.001; no asterisk, P > 0.05; 40 cells were evaluated from n = 3 except for MCF10A where n = 2. In box plots, the center line is the median, the box is delimited by the 25th and 75th percentile, and whiskers represent minimum and maximum values. b FITC-Ficoll uptake in orthotopic 4T1 tumors ± EIPA (10 mg/kg). Ficoll field index calculated from 15 fields from four tumor sections; shown in white. Using an unpaired, two-tailed t test, ***P ≤ 0.001. c Proliferation of macropinocytic MCF-7 and T-47D cells or non-macropinocytic HCC1569 cells in 1% AA medium ± albumin (5%) or necrotic debris (0.2% protein). Mean ± SD, n = 3. Using a one-way ANOVA and Dunnett’s correction, *P ≤ 0.05, ***P ≤ 0.001, ns, not significant P > 0.05. d IL-3 was withdrawn from CFSE-labeled FL5.12 cells for 24 or 72 h to produce apoptotic cells or necrotic cell debris, respectively. e Uptake of CFSE-labeled necrotic debris in 1% AA/gluc ± EIPA (50 μM). f As in e but with CFSE-labeled apoptotic cells. In e, f cells were also stained with LysoTracker Red (LTR). Percent of cell area positive for CFSE in white. Using an unpaired, two-tailed t-test, ***P ≤ 0.001; ns, not significant, P > 0.05; n = 40 cells from two independent experiments. g MCF-7 cell proliferation in 1% AA ± apoptotic cells (1% protein) or necrotic cell debris (0.2% protein). Proliferation was evaluated at 48 h to avoid secondary necrosis of apoptotic cells. Mean ± SD, n = 3. Using a one-way ANOVA and Dunnett’s correction, ns, not significant, P > 0.05. Scale bars, 10 µm (d) or 20 µm (b, e and f).CC BY · PubMed Central
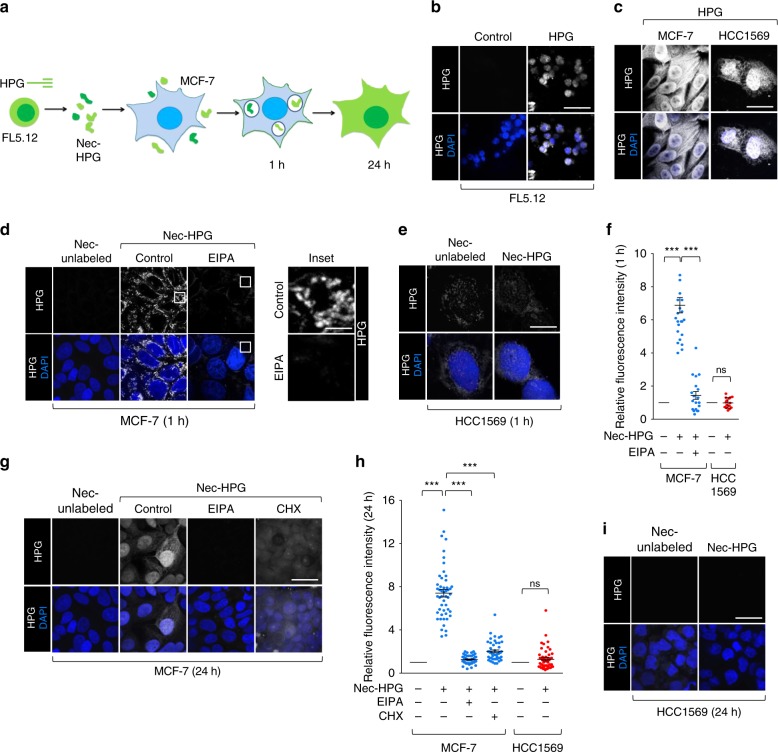
Fig. 2 Measurement of macropinocytic protein flux in breast cancer cells. a Assay schematic. FL5.12 cells were labeled with HPG prior to the induction of necrosis. HPG-labeled necrotic debris was added to macropinocytic MCF7 cells for 1 or 24 h. HPG incorporation into the MCF-7 cell proteome was detected with clickable biotin-azide followed by streptavidin-Alexa488. b FL5.12 cells were labeled with HPG for 24 h in complete medium. c MCF-7 or HCC1569 cells labeled as in b but in 1% AA medium. d, e MCF-7 (d) or HCC1569 (e) cells in 1% AA medium were supplemented with unlabeled or HPG-labeled necrotic cell debris (nec-HPG) for 1 h. MCF-7 cells ± EIPA (50 μM). f Integrated fluorescence intensity per cell in d, e normalized to cells fed unlabeled necrotic debris. A total of 25 cells (MCF-7) or 20 cells (HCC1569) from one biological replicate. g As in d but evaluated at 24 h ± EIPA or ± cycloheximide (50 μg/ml). h Integrated fluorescence intensity per cell from (g, i) normalized to cells fed unlabeled necrotic debris; 50 cells were evaluated from n = 3. i HCC1569 cells were supplemented with necrotic cell debris as in e but for 24 h. Scale bars, 20 µm. In f, h using a one-way ANOVA and Tukey’s correction (MCF-7) or an unpaired, two-tailed t-test (HCC1569), ***P ≤ 0.001; ns, not significant, P > 0.05; mean ± SEM shown.
Fig. 2 Measurement of macropinocytic protein flux in breast cancer cells. a Assay schematic. FL5.12 cells were labeled with HPG prior to the induction of necrosis. HPG-labeled necrotic debris was added to macropinocytic MCF7 cells for 1 or 24 h. HPG incorporation into the MCF-7 cell proteome was detected with clickable biotin-azide followed by streptavidin-Alexa488. b FL5.12 cells were labeled with HPG for 24 h in complete medium. c MCF-7 or HCC1569 cells labeled as in b but in 1% AA medium. d, e MCF-7 (d) or HCC1569 (e) cells in 1% AA medium were supplemented with unlabeled or HPG-labeled necrotic cell debris (nec-HPG) for 1 h. MCF-7 cells ± EIPA (50 μM). f Integrated fluorescence intensity per cell in d, e normalized to cells fed unlabeled necrotic debris. A total of 25 cells (MCF-7) or 20 cells (HCC1569) from one biological replicate. g As in d but evaluated at 24 h ± EIPA or ± cycloheximide (50 μg/ml). h Integrated fluorescence intensity per cell from (g, i) normalized to cells fed unlabeled necrotic debris; 50 cells were evaluated from n = 3. i HCC1569 cells were supplemented with necrotic cell debris as in e but for 24 h. Scale bars, 20 µm. In f, h using a one-way ANOVA and Tukey’s correction (MCF-7) or an unpaired, two-tailed t-test (HCC1569), ***P ≤ 0.001; ns, not significant, P > 0.05; mean ± SEM shown.CC BY · PubMed Central
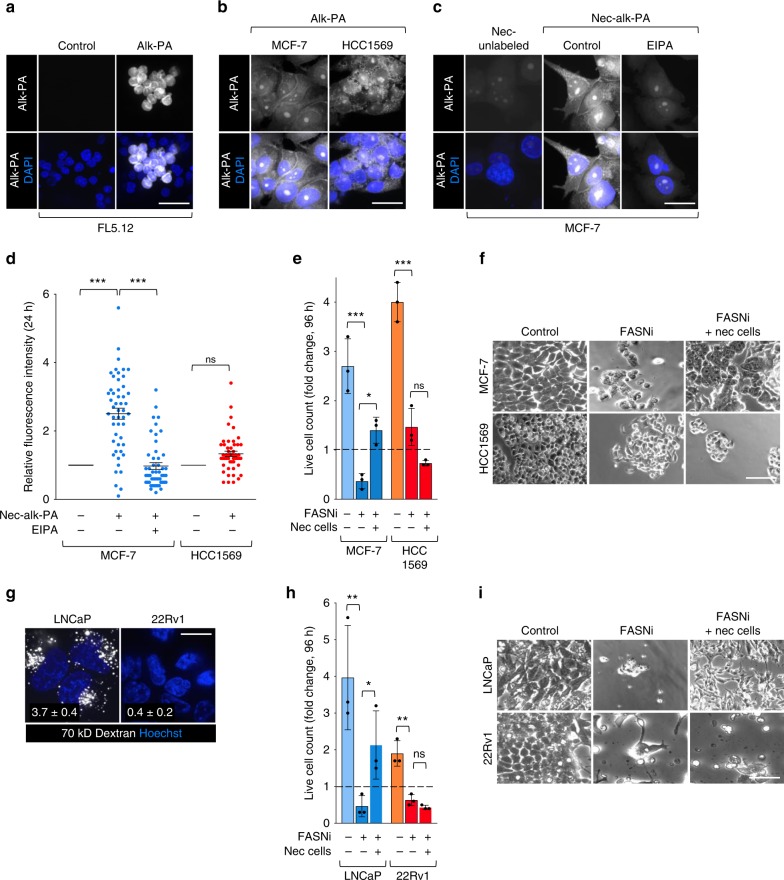
Fig. 3 Necrocytosis supplies fatty acids and confers resistance to fatty acid synthase inhibition. a FL5.12 cells labeled with alkynyl-PA in complete medium for 24 h; alk-PA detected with biotin-azide and streptavidin-Alexa488. b MCF-7 and HCC1569 cells labeled as in a. c Macropinocytic MCF-7 cells maintained for 24 h ± EIPA (50 μM) and supplemented with unlabeled or alk-PA-labeled necrotic cell debris (nec-alk-PA). d Integrated fluorescence intensity per cell from (c, or Supplementary Fig. 4a) normalized to cells fed unlabeled necrotic cell debris. A total of 50 cells were quantified from two independent experiments. Using a one-way ANOVA and Tukey’s correction (MCF-7) or an unpaired, two-tailed t-test (HCC1569); ***P ≤ 0.001, ns, not significant P > 0.05. e Proliferation of macropinocytic MCF-7 or non-macropinocytic HCC1569 cells ± fatty acid synthase inhibitor (FASNi) (GSK2194069, 20 μM) ± necrotic debris (0.2% protein) at 96 h. f Representative bright field images for proliferation assay in e. g 70 kD dextran uptake in LNCaP or 22Rv1 prostate cancer cells. Mean dextran index ± SEM shown in white; 50 cells were quantified from 1 (22Rv1) or 3 (LNCaP) independent experiments. h Proliferation of macropinocytic LNCaP cells or non-macropinocytic 22Rv1 cells ± FASNi (GSK2194069, 20 μM) ± necrotic debris (0.2% protein) at 96 h. i Representative bright field images for proliferation assay in h. For e, h mean ± SD, n = 3. Using a one-way ANOVA and Tukey’s correction, *P ≤ 0.05; **P ≤ 0.01; ***P ≤ 0.001; ns, not significant, P > 0.05. Scale bars, 20 µm.
Fig. 3 Necrocytosis supplies fatty acids and confers resistance to fatty acid synthase inhibition. a FL5.12 cells labeled with alkynyl-PA in complete medium for 24 h; alk-PA detected with biotin-azide and streptavidin-Alexa488. b MCF-7 and HCC1569 cells labeled as in a. c Macropinocytic MCF-7 cells maintained for 24 h ± EIPA (50 μM) and supplemented with unlabeled or alk-PA-labeled necrotic cell debris (nec-alk-PA). d Integrated fluorescence intensity per cell from (c, or Supplementary Fig. 4a) normalized to cells fed unlabeled necrotic cell debris. A total of 50 cells were quantified from two independent experiments. Using a one-way ANOVA and Tukey’s correction (MCF-7) or an unpaired, two-tailed t-test (HCC1569); ***P ≤ 0.001, ns, not significant P > 0.05. e Proliferation of macropinocytic MCF-7 or non-macropinocytic HCC1569 cells ± fatty acid synthase inhibitor (FASNi) (GSK2194069, 20 μM) ± necrotic debris (0.2% protein) at 96 h. f Representative bright field images for proliferation assay in e. g 70 kD dextran uptake in LNCaP or 22Rv1 prostate cancer cells. Mean dextran index ± SEM shown in white; 50 cells were quantified from 1 (22Rv1) or 3 (LNCaP) independent experiments. h Proliferation of macropinocytic LNCaP cells or non-macropinocytic 22Rv1 cells ± FASNi (GSK2194069, 20 μM) ± necrotic debris (0.2% protein) at 96 h. i Representative bright field images for proliferation assay in h. For e, h mean ± SD, n = 3. Using a one-way ANOVA and Tukey’s correction, *P ≤ 0.05; **P ≤ 0.01; ***P ≤ 0.001; ns, not significant, P > 0.05. Scale bars, 20 µm.CC BY · PubMed Central
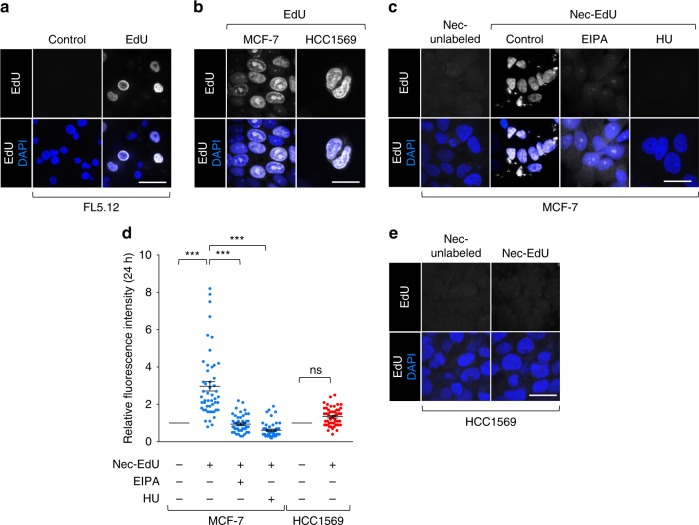
Fig. 4 Necrocytosis provides nucleotides. a FL5.12 cells labeled with EdU in complete medium; EdU detected with biotin-azide and streptavidin-Alexa488. b MCF-7 and HCC1569 cells labeled with free EdU as in a. c Macropinocytic MCF-7 cells ± EIPA (50 μM) or hydroxyurea (HU, 10 mM) were supplemented with unlabeled or EdU-labeled necrotic cell debris (nec-EdU). d Integrated fluorescence intensity per cell in c, e normalized to cells fed unlabeled necrotic cell debris. A total of 50 cells were quantified from three independent experiments except for hydroxyurea treatment where n = 2; mean ± SEM shown. Using a one-way ANOVA and Tukey’s correction (MCF-7) or an unpaired, two-tailed t-test (HCC1569), ***P ≤ 0.001; ns, not significant, P > 0.05. e As in c but for non-macropinocytic HCC1569 cells. Scale bars, 20 µm.
Fig. 4 Necrocytosis provides nucleotides. a FL5.12 cells labeled with EdU in complete medium; EdU detected with biotin-azide and streptavidin-Alexa488. b MCF-7 and HCC1569 cells labeled with free EdU as in a. c Macropinocytic MCF-7 cells ± EIPA (50 μM) or hydroxyurea (HU, 10 mM) were supplemented with unlabeled or EdU-labeled necrotic cell debris (nec-EdU). d Integrated fluorescence intensity per cell in c, e normalized to cells fed unlabeled necrotic cell debris. A total of 50 cells were quantified from three independent experiments except for hydroxyurea treatment where n = 2; mean ± SEM shown. Using a one-way ANOVA and Tukey’s correction (MCF-7) or an unpaired, two-tailed t-test (HCC1569), ***P ≤ 0.001; ns, not significant, P > 0.05. e As in c but for non-macropinocytic HCC1569 cells. Scale bars, 20 µm.CC BY · PubMed Central
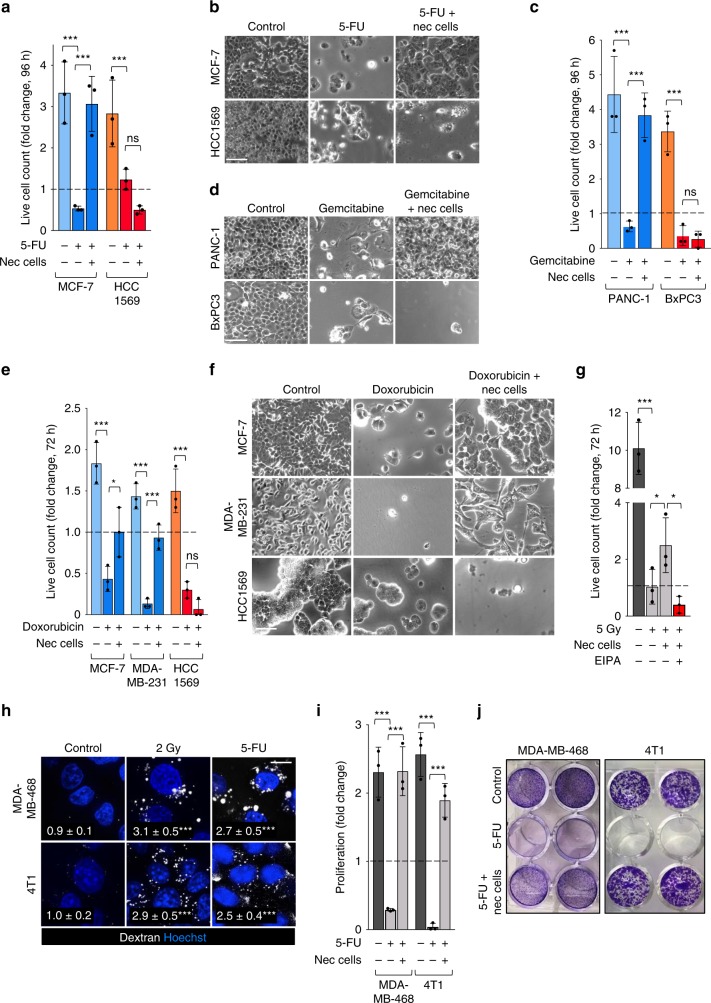
Fig. 5 Necrocytosis confers resistance to standard-of-care therapies that target or create dependence on nucleotide biosynthesis. a Proliferation of macropinocytic MCF-7 or non-macropinocytic HCC1569 cells ± 5-FU (30 μM) ± necrotic debris (0.2% protein) at 96 h. b Representative bright field images for proliferation assay in a. c Proliferation of macropinocytic PANC-1 or non-macropinocytic BxPC-3 cells ± necrotic debris (0.2% protein) ± gemcitabine (20 μM) at 96 h. d Representative bright field images for proliferation assay in c. e Proliferation of macropinocytic MCF-7 and MDA-MB-231 or non-macropinocytic HCC1569 cells ± doxorubicin (1 μM) ± necrotic debris (0.2% protein) at 72 h. f Representative bright field images for proliferation assay in e. g Proliferation of 4T1 cells in CM subjected to 5 Gy of γ-irradiation ± nec cells and ± EIPA (10 μM) at 72 h. h Dextran uptake in 4T1 or MDA-MB-468 cells 2 h after γ-irradiation (2 Gy) or 1 h after treatment with 5-FU (5 μM). Statistics compare dextran index (in white) in control and irradiated or treated cells; 30 cells from two independent experiments were evaluated. Using a one-way ANOVA and Dunnett’s correction, ***P ≤ 0.001. i Proliferation of 4T1 or MDA-MB-468 cells ± 1 μM (4T1) or 20 μM (MDA-MB-468) 5-FU ± necrotic debris (0.2% protein) at 72 h (4T1) or 96 h (MDA-MB-468). j Representative images for i (duplicate wells shown). In a, c, e, g and i, mean ± SD shown, n = 3; Using a one-way ANOVA and Tukey’s correction, *P ≤ 0.05; ***P ≤ 0.001; ns, not significant, P > 0.05.
Fig. 5 Necrocytosis confers resistance to standard-of-care therapies that target or create dependence on nucleotide biosynthesis. a Proliferation of macropinocytic MCF-7 or non-macropinocytic HCC1569 cells ± 5-FU (30 μM) ± necrotic debris (0.2% protein) at 96 h. b Representative bright field images for proliferation assay in a. c Proliferation of macropinocytic PANC-1 or non-macropinocytic BxPC-3 cells ± necrotic debris (0.2% protein) ± gemcitabine (20 μM) at 96 h. d Representative bright field images for proliferation assay in c. e Proliferation of macropinocytic MCF-7 and MDA-MB-231 or non-macropinocytic HCC1569 cells ± doxorubicin (1 μM) ± necrotic debris (0.2% protein) at 72 h. f Representative bright field images for proliferation assay in e. g Proliferation of 4T1 cells in CM subjected to 5 Gy of γ-irradiation ± nec cells and ± EIPA (10 μM) at 72 h. h Dextran uptake in 4T1 or MDA-MB-468 cells 2 h after γ-irradiation (2 Gy) or 1 h after treatment with 5-FU (5 μM). Statistics compare dextran index (in white) in control and irradiated or treated cells; 30 cells from two independent experiments were evaluated. Using a one-way ANOVA and Dunnett’s correction, ***P ≤ 0.001. i Proliferation of 4T1 or MDA-MB-468 cells ± 1 μM (4T1) or 20 μM (MDA-MB-468) 5-FU ± necrotic debris (0.2% protein) at 72 h (4T1) or 96 h (MDA-MB-468). j Representative images for i (duplicate wells shown). In a, c, e, g and i, mean ± SD shown, n = 3; Using a one-way ANOVA and Tukey’s correction, *P ≤ 0.05; ***P ≤ 0.001; ns, not significant, P > 0.05.CC BY · PubMed Central
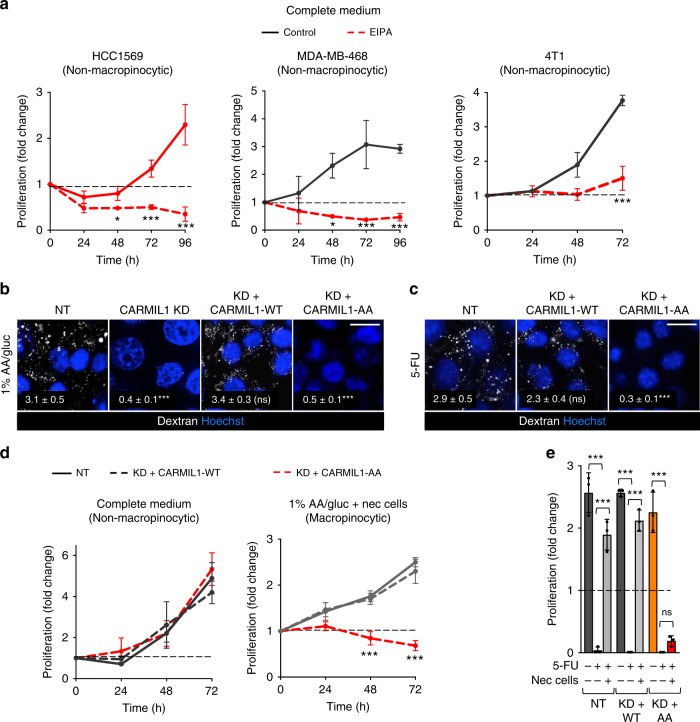
Fig. 6 CARMIL1-AA supports proliferation, but not macropinocytosis, in mammary cancer cells. a Breast cancer cell line proliferation in complete medium ± EIPA (25 μM (HCC1569 and MDA-MB-468) or 10 μM (4T1, 4T1 cells are hypersensitive to EIPA)). Mean ± SD shown, n = 3. Using an unpaired, two-tailed t-test at each time point, *P ≤ 0.05; ***P ≤ 0.001; no asterisk, P > 0.05. b Dextran uptake in 4T1 cells expressing a non-targeting shRNA (NT) or a CARMIL1-shRNA in 1% AA/glucose. Where indicated, CARMIL1 knockdown cells were reconstituted with shRNA-resistant CARMIL1-WT or CARMIL1-AA cDNAs. c As in b, but in complete medium 1 h after treatment with 5-FU (5 μM). For b and c, dextran index in white (mean ± SEM); 30 cells from two independent experiments were evaluated. Using a one-way ANOVA with Dunnett’s correction, ***P ≤ 0.001; ns, not significant, P > 0.05. Scale bars, 20 µm. d Proliferation of 4T1 cells in complete medium or 1% AA/gluc with necrotic cells (0.2% protein). Mean ± SD shown, n = 3. Using a one-way ANOVA at each time point and Dunnett’s correction, ***P ≤ 0.001; no asterisk, P > 0.05. e As in d, but cells in complete medium were treated with 5-FU (1 μM) ± necrotic debris (0.2% protein) and proliferation measured at 72 h. Mean ± SD shown, n = 3. Using a one-way ANOVA and Tukey’s correction, ***P ≤ 0.001; ns, not significant, P > 0.05.
Fig. 6 CARMIL1-AA supports proliferation, but not macropinocytosis, in mammary cancer cells. a Breast cancer cell line proliferation in complete medium ± EIPA (25 μM (HCC1569 and MDA-MB-468) or 10 μM (4T1, 4T1 cells are hypersensitive to EIPA)). Mean ± SD shown, n = 3. Using an unpaired, two-tailed t-test at each time point, *P ≤ 0.05; ***P ≤ 0.001; no asterisk, P > 0.05. b Dextran uptake in 4T1 cells expressing a non-targeting shRNA (NT) or a CARMIL1-shRNA in 1% AA/glucose. Where indicated, CARMIL1 knockdown cells were reconstituted with shRNA-resistant CARMIL1-WT or CARMIL1-AA cDNAs. c As in b, but in complete medium 1 h after treatment with 5-FU (5 μM). For b and c, dextran index in white (mean ± SEM); 30 cells from two independent experiments were evaluated. Using a one-way ANOVA with Dunnett’s correction, ***P ≤ 0.001; ns, not significant, P > 0.05. Scale bars, 20 µm. d Proliferation of 4T1 cells in complete medium or 1% AA/gluc with necrotic cells (0.2% protein). Mean ± SD shown, n = 3. Using a one-way ANOVA at each time point and Dunnett’s correction, ***P ≤ 0.001; no asterisk, P > 0.05. e As in d, but cells in complete medium were treated with 5-FU (1 μM) ± necrotic debris (0.2% protein) and proliferation measured at 72 h. Mean ± SD shown, n = 3. Using a one-way ANOVA and Tukey’s correction, ***P ≤ 0.001; ns, not significant, P > 0.05.CC BY · PubMed Central
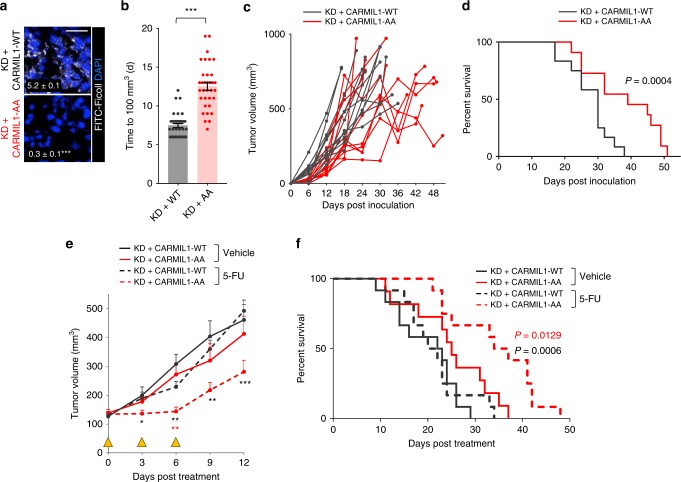
Fig. 7 Macropinocytosis promotes tumor growth and fuels resistance to 5-FU in vivo. a FITC-Ficoll uptake in orthotopic 4T1 tumors generated from CARMIL1-WT or CARMIL1-AA cells. Ficoll field-index was calculated from 10 fields from 3 (CARMIL1-WT) or 4 (CARMIL1-AA) tumor sections; Ficoll field index ± SEM in white. Using an unpaired, two-tailed t test, ***P ≤ 0.001. Scale bar, 20 µm. b Time to reach 100 mm3 for tumors formed from CARMIL1-WT (n = 26) or CARMIL1-AA cells (n = 25); tumor volume was measured with calipers daily starting on day 6. Using an unpaired, two-tailed t test, ***, P ≤ 0.001, mean ± SEM. c Growth of the tumors in b. d Kaplan–Meier survival analysis in mice bearing CARMIL1-WT (n = 12) or CARMIL1-AA (n = 11) 4T1 tumors. P-value calculated using a two-sided log-rank (Mantel-Cox) test. e As in b, but animals were treated with vehicle (CARMIL1-WT, n = 12; CARMIL1-AA, n = 11) or 30 mg/kg 5-FU (CARMIL1-WT, n = 12; CARMIL1-AA, n = 12); mean ± SEM. Yellow triangles mark days 5-FU was administered. Statistics compare CARMIL1-WT vs. CARMIL1-AA tumors treated with 5-FU (black asterisks) or CARMIL1-AA tumors treated with vehicle or 5-FU (red asterisks). Using a one-way ANOVA and Tukey’s correction, *P ≤ 0.05; **P ≤ 0.01; ***P ≤ 0.001; no asterisk, P > 0.05. f Kaplan–Meier survival curve beginning after initiation of 5-FU treatment. P-value calculated using a two-sided log-rank (Mantel-Cox) test and compare 5-FU-treated CARMIL1-WT (n = 12) and CARMIL1-AA tumors (n = 11) in black or CARMIL1-AA tumors treated with vehicle (n = 12) or 5-FU (n = 12) in red.
Fig. 7 Macropinocytosis promotes tumor growth and fuels resistance to 5-FU in vivo. a FITC-Ficoll uptake in orthotopic 4T1 tumors generated from CARMIL1-WT or CARMIL1-AA cells. Ficoll field-index was calculated from 10 fields from 3 (CARMIL1-WT) or 4 (CARMIL1-AA) tumor sections; Ficoll field index ± SEM in white. Using an unpaired, two-tailed t test, ***P ≤ 0.001. Scale bar, 20 µm. b Time to reach 100 mm3 for tumors formed from CARMIL1-WT (n = 26) or CARMIL1-AA cells (n = 25); tumor volume was measured with calipers daily starting on day 6. Using an unpaired, two-tailed t test, ***, P ≤ 0.001, mean ± SEM. c Growth of the tumors in b. d Kaplan–Meier survival analysis in mice bearing CARMIL1-WT (n = 12) or CARMIL1-AA (n = 11) 4T1 tumors. P-value calculated using a two-sided log-rank (Mantel-Cox) test. e As in b, but animals were treated with vehicle (CARMIL1-WT, n = 12; CARMIL1-AA, n = 11) or 30 mg/kg 5-FU (CARMIL1-WT, n = 12; CARMIL1-AA, n = 12); mean ± SEM. Yellow triangles mark days 5-FU was administered. Statistics compare CARMIL1-WT vs. CARMIL1-AA tumors treated with 5-FU (black asterisks) or CARMIL1-AA tumors treated with vehicle or 5-FU (red asterisks). Using a one-way ANOVA and Tukey’s correction, *P ≤ 0.05; **P ≤ 0.01; ***P ≤ 0.001; no asterisk, P > 0.05. f Kaplan–Meier survival curve beginning after initiation of 5-FU treatment. P-value calculated using a two-sided log-rank (Mantel-Cox) test and compare 5-FU-treated CARMIL1-WT (n = 12) and CARMIL1-AA tumors (n = 11) in black or CARMIL1-AA tumors treated with vehicle (n = 12) or 5-FU (n = 12) in red.CC BY · PubMed Central

Verification

Claims the paper makes

The claims and statistics of this paper haven’t been checked yet.

Run the check — free, no account needed. It reads the open-access text and checks the sources it cites.

A few free checks a day · papers already verified open instantly · results are public

Claims other papers make about this one

Each is checked against this paper’s own text: does it say what the citing paper says it does?

Self-check

Percentages, sums and reported differences re-computed from the paper’s own numbers.

The self-check needs the paper’s full text.

Citations

Cites

Show all 71 references

Cited by

Sorted by citations

See all 200

Metadata

Authors
Jayashankar, V., & Edinger, A. L.
Affiliations
University of California, Irvine (US)
Corresponding author
Edinger, Aimee L.
Venue
Nature Communications
Published
2020-02-28
Volume
11
Issue
1
Pages
1121-1121
ISSN
2041-1723 (ISSN-L)
OpenAlex
W3009504922
Cited by
200
References
71
Citations by year
2026: 21 · 2025: 46 · 2024: 40 · 2023: 28 · 2022: 27 · 2021: 29 · 2020: 9
FWCI
7.95
Type
journal article
Language
en
Open access
Locations
  • Nature Communications (publishedVersion, cc-by)
  • PubMed Central (publishedVersion, cc-by)
  • PubMed (publishedVersion)
  • eScholarship (California Digital Library) (submittedVersion, cc-by)
  • RePEc: Research Papers in Economics (submittedVersion)
  • DOAJ (DOAJ: Directory of Open Access Journals) (submittedVersion, cc-by-sa)
  • eScholarship (California Digital Library) (submittedVersion)
Funders
  • Johns Hopkins University
  • Ionis Pharmaceuticals
  • Cancer Research Coordinating Committee (CRR-17-426826)
  • National Institutes of Health (W81XWH-15-1-0010, W81XWH)
  • University of California, Irvine (P30CA‐062203, W81XWH-15-1-0010)
  • National Cancer Institute (R01CA247556, P30CA062203)
  • Chao Family Comprehensive Cancer Center (P30 CA062203)
  • UCI Beall Applied Innovation
  • Congressionally Directed Medical Research Programs (W81XWH-15-1-0010)
Topics
  • Life Sciences › Biochemistry, Genetics and Molecular Biology › Cancer Research › Cancer, Hypoxia, and Metabolism
  • Life Sciences › Biochemistry, Genetics and Molecular Biology › Cell Biology › Autophagy in Disease and Therapy
  • Life Sciences › Biochemistry, Genetics and Molecular Biology › Cancer Research › Cancer, Lipids, and Metabolism
Keywords
macropinocytosis, drug resistance, nucleotide synthesis, fatty acid synthase inhibition, 5-fluorouracil, gemcitabine, doxorubicin, gamma irradiation, breast cancer, prostate cancer, pancreatic cancer, tumor growth
MeSH terms
Nutrients, Animals, Antimetabolites, Antineoplastic, Breast Neoplasms, Female, Fluorouracil, Humans, Microfilament Proteins, Mutation, Pinocytosis, Drug Resistance, Neoplasm, Cell Line, Tumor, Cell Proliferation, Mice, Fatty Acid Synthases, Metabolic Flux Analysis

About these checks

Registry, retraction, Cites and statistics results are computed, not judged, with one exception: a printed reference that no index lists is read once by a model before it counts as a citation error. Claims are extracted by a model and kept only when their quote appears verbatim in the text; each cited source is then checked, with a model’s help, for whether it says what the claim relies on. Those verdicts can be wrong — read the claim’s quote and the cited source before relying on one.

Statistics and arithmetic are recomputed, not judged.

Confidence bands are shown only for fields calibrated on our annotated test set. None is calibrated yet, so no band is shown.

What counts as a claim ›How we measure confidence ›How we check this ›

Are you an author, or do you see a problem with this page? Request a review