

The DOI matches its Crossref record; 49 of the 49 references it cites were found in a registry or an index.
All-dielectric metasurface for high-performance structural color
Open accessAbstract
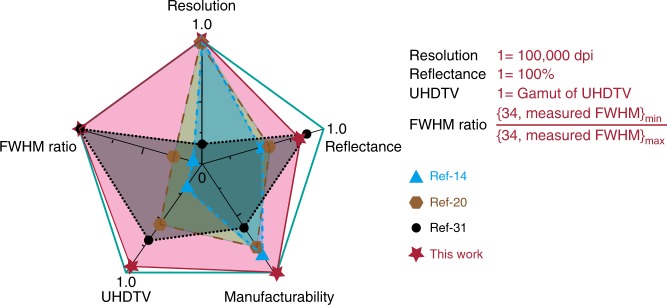
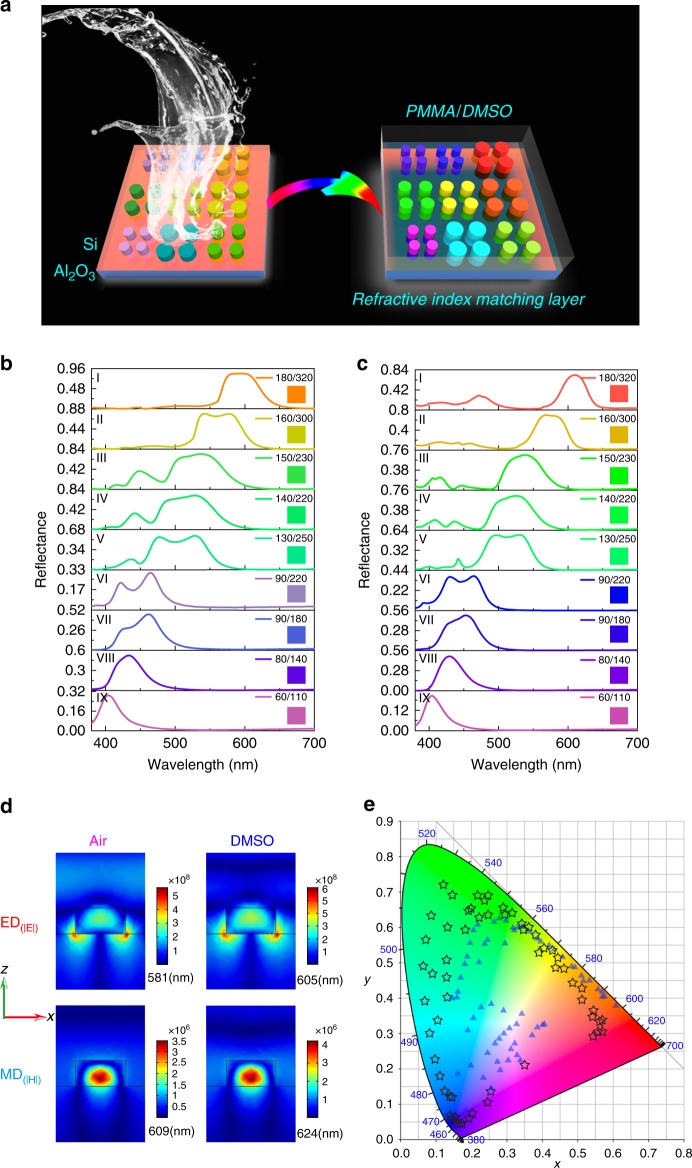
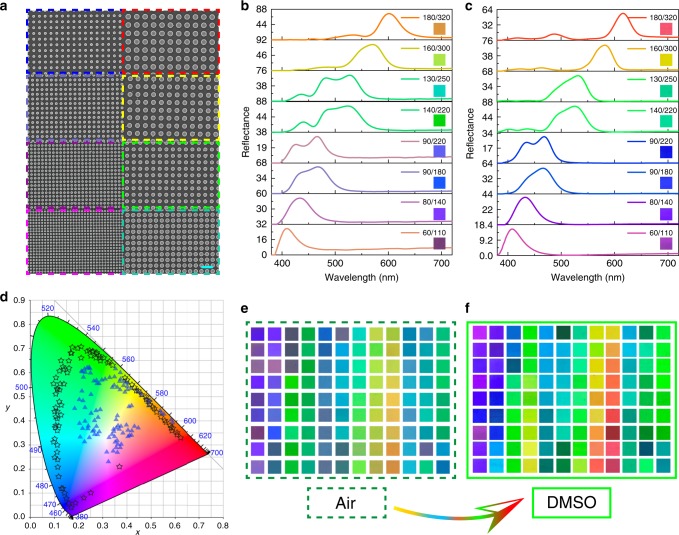
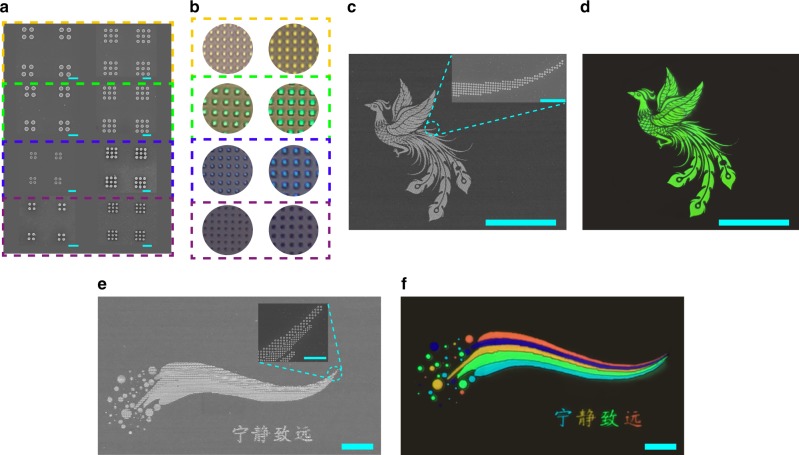
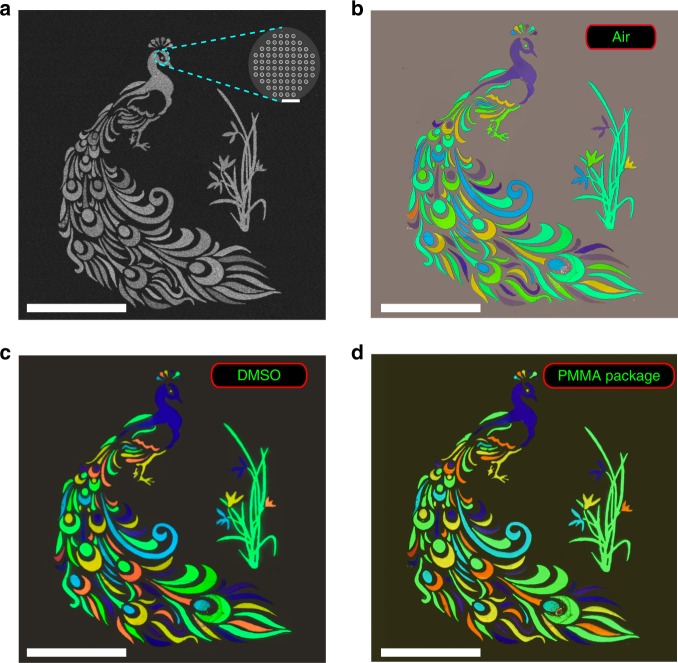
The achievement of structural color has shown advantages in large-gamut, high-saturation, high-brightness, and high-resolution. While a large number of plasmonic/dielectric nanostructures have been developed for structural color, the previous approaches fail to match all the above criterion simultaneously. Herein we utilize the Si metasurface to demonstrate an all-in-one solution for structural color. Due to the intrinsic material loss, the conventional Si metasurfaces only have a broadband reflection and a small gamut of 78% of sRGB. Once they are combined with a refractive index matching layer, the reflection bandwidth and the background reflection are both reduced, improving the brightness and the color purity significantly. Consequently, the experimentally demonstrated gamut has been increased to around 181.8% of sRGB, 135.6% of Adobe RGB, and 97.2% of Rec.2020. Meanwhile, high refractive index of silicon preserves the distinct color in a pixel with 2 × 2 array of nanodisks, giving a diffraction-limit resolution.
Overview
The claims and statistics of this paper haven’t been checked yet.
Run the check — free, no account needed. It reads the open-access text and checks the sources it cites.
Integrity signals
Registry
Cites
Statistics
Figures
Verification
Claims the paper makes
The claims and statistics of this paper haven’t been checked yet.
Run the check — free, no account needed. It reads the open-access text and checks the sources it cites.
Claims other papers make about this one
Each is checked against this paper’s own text: does it say what the citing paper says it does?
The source backs part of the claim, not all of it — or backs it for a different population, condition or comparison.
In the citing paper
“Initial investigations into metasurface spectral filters used plasmonic metals [8–13], but there has been a gradual shift towards all-dielectric metasurfaces (ADM) [14–17] owing to their comparatively lesser optical absorption.”
From Robust inverse design of all-dielectric metasurface transmission-mode color filters (2020) · cites this paper as [15]
Experimental — accuracy not yet measuredIn the citing paper
“Other colors can be achieved by Si meta-surfaces with various geometries and different lattice sizes of different geometric shapes [285,286].”
From The Current State of Optical Sensors in Medical Wearables (2022) · cites this paper as [285]
Self-check
Percentages, sums and reported differences re-computed from the paper’s own numbers.
The self-check needs the paper’s full text.
Citations
Cites
In situ click chemistry generation of cyclooxygenase-2 inhibitors
Bhardwaj, A., Kaur, J., Wuest, M., & Wuest, F. (2017) · Nature Communications · doi:10.1038/s41467-016-0009-6 · Cited by 7,448
Color chemistry syntheses properties and applications of organic dyes and pigments
Zollinger, H. (1987) · Cited by 2,073
Photonic structures in biology
Vukusic, P., & Sambles, J. R. (2003) · Nature · doi:10.1038/nature01941 · Cited by 1,971
Jahani, S., & Jacob, Z. (2016) · Nature Nanotechnology · doi:10.1038/nnano.2015.304 · Cited by 1,969
Printing colour at the optical diffraction limit
Kumar, K., Duan, H., Hegde, R. S., Koh, S. C. W., Wei, J. N., & Yang, J. K. W. (2012) · Nature Nanotechnology · doi:10.1038/nnano.2012.128 · Cited by 984
Photonic-crystal full-colour displays
Arsenault, A. C., Puzzo, D. P., Ian Manners, A., & Ozin, G. A. (2007) · Nature Photonics · doi:10.1038/nphoton.2007.140 · Cited by 910
Plasmonic nanoresonators for high-resolution colour filtering and spectral imaging
Xu, T., Wu, Y.-K., Luo, X., & Guo, L. J. (2010) · Nature Communications · doi:10.1038/ncomms1058 · Cited by 836
Self-citationKristensen, A., Yang, J. K. W., Bozhevolnyi, S. I., Link, S., Nordlander, P. J., Halas, N. J., & Mortensen, N. A. (2016) · Nature Reviews Materials · doi:10.1038/natrevmats.2016.88 · Cited by 816
Dynamic plasmonic colour display
Duan, X., Kamin, S., & Liu, N. (2017) · Nature Communications · doi:10.1038/ncomms14606 · Cited by 563
Beyond the Rayleigh scattering limit in high-Q silicon microdisks: theory and experiment
Borselli, M., Johnson, T. J., & Painter, O. J. (2005) · Optics Express · doi:10.1364/opex.13.001515 · Cited by 496
Cited by
Sorted by citations
Nanophotonic Structural Colors
Rezaei, S. D., Dong, Z., Chan, J. Y. E., Trisno, J., Ng, R. J. H., Ruan, Q., Qiu, C., Mortensen, N. A., & Yang, J. K. W. (2020) · ACS Photonics · doi:10.1021/acsphotonics.0c00947 · Cited by 350
Resonant leaky modes in all-dielectric metasystems: Fundamentals and applications
Huang, L., Xu, L., Powell, D. A., Padilla, W. J., & Miroshnichenko, A. E. (2023) · Physics Reports · doi:10.1016/j.physrep.2023.01.001 · Cited by 342
Reconfigurable metasurfaces towards commercial success
Gu, T., Kim, H. J., Rivero, C., & Hu, J. (2022) · Nature Photonics · doi:10.1038/s41566-022-01099-4 · Cited by 268
Metasurface-Driven Optically Variable Devices
Jung, C., Kim, G., Jeong, M., Jang, J., Dong, Z., Badloe, T., Yang, J. K. W., & Rho, J. (2021) · Chemical Reviews · doi:10.1021/acs.chemrev.1c00294 · Cited by 251
Principles, Functions, and Applications of Optical Meta‐Lens
Chen, M. K., Wu, Y., Feng, L., Fan, Q., Lu, M., Xu, T., & Tsai, D. P. (2021) · Advanced Optical Materials · doi:10.1002/adom.202001414 · Cited by 249
Self-citationArtificial Intelligence in Meta-optics
Chen, M. K., Liu, X., Sun, Y., & Tsai, D. P. (2022) · Chemical Reviews · doi:10.1021/acs.chemrev.2c00012 · Cited by 234
Self-citationVersatile full-colour nanopainting enabled by a pixelated plasmonic metasurface
Song, M., Feng, L., Huo, P., Liu, M., Huang, C., Yan, F., Lu, Y., & Xu, T. (2022) · Nature Nanotechnology · doi:10.1038/s41565-022-01256-4 · Cited by 206
Structural color generation: from layered thin films to optical metasurfaces
Wang, D., Liu, Z., Wang, H., Li, M., Guo, L. J., & Zhang, C. (2023) · Nanophotonics · doi:10.1515/nanoph-2022-0063 · Cited by 204
Badloe, T., Kim, J., Kim, I., Kim, W., Kim, W. S., Kim, Y., & Rho, J. (2022) · Light Science & Applications · doi:10.1038/s41377-022-00806-8 · Cited by 188
Kim, J., Park, C., & Jae Won, H. A. H. N. (2022) · Advanced Optical Materials · doi:10.1002/adom.202101930 · Cited by 178
Dynamic plasmonic color generation enabled by functional materials
Neubrech, F., Duan, X., & Liu, N. (2020) · Science Advances · doi:10.1126/sciadv.abc2709 · Cited by 175
Collective lattice resonances: Plasmonics and beyond
Utyushev, A. D., Zakomirnyi, V. I., & Rasskazov, I. L. (2021) · Reviews in Physics · doi:10.1016/j.revip.2021.100051 · Cited by 167
Jang, J., Badloe, T., Yang, Y., Lee, T., Mun, J., & Rho, J. (2020) · ACS Nano · doi:10.1021/acsnano.0c05656 · Cited by 164
Metasurface-based nanoprinting: principle, design and advances
Fu, R., Chen, K., Li, Z., Yu, S., & Zheng, G. (2022) · Opto-Electronic Science · doi:10.29026/oes.2022.220011 · Cited by 155
Facile full-color printing with a single transparent ink
Li, K., Li, T., Zhang, T., Li, H., Li, A., Li, Z., Lai, X., Hou, X., Wang, Y., Shi, L., et al. (2021) · Science Advances · doi:10.1126/sciadv.abh1992 · Cited by 150
Schrödinger’s red pixel by quasi-bound-states-in-the-continuum
Dong, Z., Jin, L., Rezaei, S. D., Wang, H., Chen, Y., Tjiptoharsono, F., Ho, J., Gorelik, S. R., Ng, R. J. H., Ruan, Q., et al. (2022) · Science Advances · doi:10.1126/sciadv.abm4512 · Cited by 149
Nanofabrication for Nanophotonics
Yang, Y., Jeon, Y., Dong, Z., Yang, J. K. W., Moghaddam, M. H., Kim, D.-S., Oh, D. K., Lee, J. ‐., Hentschel, M., Giessen, H. W., et al. (2025) · ACS Nano · doi:10.1021/acsnano.4c10964 · Cited by 151
Vectorial metasurface holography
Song, Q., Liu, X., Qiu, C.-W., & Genevet, P. (2022) · Applied Physics Reviews · doi:10.1063/5.0078610 · Cited by 139
Self-citationHu, J., Guo, Z., Shi, J., Jiang, X., Chen, Q., Chen, H., He, Z., Song, Q., Xiao, S., Yu, S., et al. (2024) · Nature Communications · doi:10.1038/s41467-024-47105-x · Cited by 139
Self-citationHigh-speed laser writing of structural colors for full-color inkless printing
Geng, J., Xu, L., Yan, W., Shi, L., & Qiu, M. (2023) · Nature Communications · doi:10.1038/s41467-023-36275-9 · Cited by 135
Generation of Perfect Vortex Beams by Dielectric Geometric Metasurface for Visible Light
Zhou, Q., Liu, M., Zhu, W., Chen, L., Ren, Y., Lezec, H. J., Lu, Y., Agrawal, A. K., & Xu, T. (2021) · Laser & Photonics Review · doi:10.1002/lpor.202100390 · Cited by 132
Miniature tunable Airy beam optical meta-device
Zhang, J. C., Chen, M. K., Fan, Y., Chen, Q., Chen, S., Yao, J. L., Liu, X., Xiao, S., & Tsai, D. P. (2024) · Opto-Electronic Advances · doi:10.29026/oea.2024.230171 · Cited by 128
Self-citationThe second optical metasurface revolution: moving from science to technology
Brongersma, M. L., Pala, R. A., Altug, H., Capasso, F., Chen, W. T., Majumdar, A., & Atwater, H. A. (2025) · Nature Reviews Electrical Engineering · doi:10.1038/s44287-024-00136-4 · Cited by 132
Reversible Tuning of Mie Resonances in the Visible Spectrum
Lu, L. B., Dong, Z., Tijiptoharsono, F., Ng, R. J. H., Wang, H., Rezaei, S. D., Wang, Y., Leong, H. S., Lim, P. C., Yang, J. K. W., et al. (2021) · ACS Nano · doi:10.1021/acsnano.1c07114 · Cited by 124
Yang, M., Qiu, S., Coy, E. L., Li, S., Załęski, K., Zhang, Y., Pan, H., & Wang, G. (2021) · Advanced Materials · doi:10.1002/adma.202106314 · Cited by 124
Liquid crystal-integrated metasurfaces for an active photonic platform
Kang, D., Heo, H., Yang, Y., Seong, J., Kim, H., Kim, J., & Rho, J. (2024) · Opto-Electronic Advances · doi:10.29026/oea.2024.230216 · Cited by 123
Phase characterisation of metalenses
Zhao, M., Chen, M. K., Zhuang, Z.-P., Zhang, Y., Chen, A., Chen, Q., Liu, W., Wang, J., Chen, Z.-M., Wang, B., et al. (2021) · Light Science & Applications · doi:10.1038/s41377-021-00492-y · Cited by 119
Self-citationDynamic Bifunctional Metasurfaces for Holography and Color Display
Yang, W., Qu, G., Lai, F., Liu, Y., Ji, Z., Xu, Y., Song, Q., Han, J., & Xiao, S. (2021) · Advanced Materials · doi:10.1002/adma.202101258 · Cited by 116
Self-citationRecent Progress in Responsive Structural Color
Hou, X., Li, F., Song, Y., & Li, M. (2022) · The Journal of Physical Chemistry Letters · doi:10.1021/acs.jpclett.1c04219 · Cited by 109
Optical metasurfaces towards multifunctionality and tunability
Du, K., Barkaoui, H., Zhang, X., Jin, L., Song, Q., & Xiao, S. (2022) · Nanophotonics · doi:10.1515/nanoph-2021-0684 · Cited by 105
Self-citationRecent advances in ultraviolet nanophotonics: from plasmonics and metamaterials to metasurfaces
Zhao, D. Y., Lin, Z., Zhu, W., Lezec, H. J., Xu, T., Agrawal, A. K., Zhang, C., & Huang, K. (2021) · Nanophotonics · doi:10.1515/nanoph-2021-0083 · Cited by 107
The Current State of Optical Sensors in Medical Wearables
Vavrinsky, E., Esfahani, N. E., Hausner, M., Kuzma, A., Rezo, V., Donoval, M., & Kosnacova, H. (2022) · Biosensors · doi:10.3390/bios12040217 · Cited by 103
Cholesteric cellulose liquid crystal ink for three-dimensional structural coloration
Zhang, Z., Wang, C., Wang, Q., Zhao, Y., & Shang, L. (2022) · Proceedings of the National Academy of Sciences · doi:10.1073/pnas.2204113119 · Cited by 104
Stimuli‐responsive active materials for dynamic control of light field
Zheng, R., Wei, Y., Zhang, Z., Wang, Z., Ma, L., Wang, Y., Huang, L., & Lu, Y. (2023) · Responsive materials · doi:10.1002/rpm.20230017 · Cited by 100
Benchmarking deep learning-based models on nanophotonic inverse design problems
Ma, T., Tobah, M., Wang, H., & Guo, L. J. (2022) · Opto-Electronic Science · doi:10.29026/oes.2022.210012 · Cited by 102
Advanced manufacturing of dielectric meta-devices
Yang, W., Zhou, J., Tsai, D. P., & Xiao, S. (2024) · Photonics Insights · doi:10.3788/pi.2024.r04 · Cited by 96
Self-citationDielectric Resonance-Based Optical Metasurfaces: From Fundamentals to Applications
Liu, W., Li, Z., Cheng, H., & Chen, S. (2020) · iScience · doi:10.1016/j.isci.2020.101868 · Cited by 96
Metasurface optofluidics for dynamic control of light fields
Li, Q., van de Groep, J., White, A. K., Song, J., Longwell, S. A., Fordyce, P. M., Quake, S. R., Kik, P. G., & Brongersma, M. L. (2022) · Nature Nanotechnology · doi:10.1038/s41565-022-01197-y · Cited by 95
Zhang, C., Chen, L., Lin, Z., Song, J., Wang, D., Li, M., Koksal, O., Wang, Z., Spektor, G., Carlson, D. R., et al. (2024) · Light Science & Applications · doi:10.1038/s41377-023-01330-z · Cited by 96
Rotational Multiplexing Method Based on Cascaded Metasurface Holography
Wei, Q., Huang, L., Zhao, R., Geng, G., Li, J., Li, X., & Wang, Y. (2022) · Advanced Optical Materials · doi:10.1002/adom.202102166 · Cited by 94
Photorealistic full-color nanopainting enabled by a low-loss metasurface
Huo, P., Song, M., Zhu, W., Zhang, C., Chen, L., Lezec, H. J., Lu, Y., Agrawal, A. K., & Xu, T. (2020) · Optica · doi:10.1364/optica.403092 · Cited by 90
A water-soluble label for food products prevents packaging waste and counterfeiting
Kim, J., Kim, H., Kang, H., Kim, W., Chen, Y., Choi, J., Lee, H., & Rho, J. (2024) · Nature Food · doi:10.1038/s43016-024-00957-4 · Cited by 89
Jung, C., Yang, Y., Jang, J., Badloe, T., Lee, T., Mun, J., Moon, S., & Rho, J. (2020) · Nanophotonics · doi:10.1515/nanoph-2020-0440 · Cited by 88
Li, K., Wang, J., Cai, W., He, H., Cen, M., Liu, J., Luo, D., Mu, Q., Gérard, D., & Liu, Y. J. (2021) · Nano Letters · doi:10.1021/acs.nanolett.1c01947 · Cited by 88
Self-citationBio-inspired shape-memory structural color hydrogel film
Wang, Y., Zhang, Z., Chen, H., Zhang, H., Zhang, H., & Zhao, Y. (2021) · 中国科学通报:英文版 · doi:10.1016/j.scib.2021.10.010 · Cited by 87
Dynamic Structural Colors Based on All‐Dielectric Mie Resonators
Wu, Y., Chen, Y., Song, Q., & Xiao, S. (2021) · Advanced Optical Materials · doi:10.1002/adom.202002126 · Cited by 86
Self-citationA High Aspect Ratio Inverse-Designed Holey Metalens
Lim, S. W. D., Meretska, M. L., & Capasso, F. (2021) · Nano Letters · doi:10.1021/acs.nanolett.1c02612 · Cited by 85
Tunable Polarization-Multiplexed Achromatic Dielectric Metalens
Ou, X., Zeng, T., Zhang, Y., Jiang, Y., Gong, Z., Fan, F., Jia, H., Duan, H., & Hu, Y. (2022) · Nano Letters · doi:10.1021/acs.nanolett.2c03798 · Cited by 85
Hydrogels for active photonics
Ko, B., Jeon, N., Kim, J., Kang, H., Seong, J., Yun, S., Badloe, T., & Rho, J. (2023) · Microsystems & Nanoengineering · doi:10.1038/s41378-023-00609-w · Cited by 83
Electrically tunable optical metasurfaces
Ding, F., Meng, C., & Bozhevolnyi, S. I. (2024) · Photonics Insights · doi:10.3788/pi.2024.r07 · Cited by 85
Lee, T., Kim, J., Koirala, I., Yang, Y., Badloe, T., Jang, J., & Rho, J. (2021) · ACS Applied Materials & Interfaces · doi:10.1021/acsami.1c03427 · Cited by 82
OptoGPT: A foundation model for inverse design in optical multilayer thin film structures
Ma, T., Wang, H., & Guo, L. J. (2024) · Opto-Electronic Advances · doi:10.29026/oea.2024.240062 · Cited by 95
High-Order Photonic Cavity Modes Enabled 3D Structural Colors
Liu, H., Wang, H., Wang, H., Deng, J., Ruan, Q., Zhang, W., Abdelraouf, O. A. M., Ang, N. S. S., Dong, Z., Yang, J. K. W., et al. (2022) · ACS Nano · doi:10.1021/acsnano.2c01999 · Cited by 80
Full Color and Grayscale Painting with 3D Printed Low-Index Nanopillars
Wang, H., Ruan, Q., Wang, H., Rezaei, S. D., Lim, K. T. P., Liu, H., Zhang, W., Trisno, J., Chan, J. Y. E., & Yang, J. K. W. (2021) · Nano Letters · doi:10.1021/acs.nanolett.1c00979 · Cited by 78
High-resolution light field prints by nanoscale 3D printing
Chan, J. Y. E., Ruan, Q., Jiang, M., Wang, H., Wang, H., Zhang, W., Qiu, C., & Yang, J. K. W. (2021) · Nature Communications · doi:10.1038/s41467-021-23964-6 · Cited by 70
Lin, W., Yang, C., Yu, M., Li, S., Zhang, L., Jiang, X., Lv, Y., Poudel, B., Wang, K., Polavarapu, L., et al. (2023) · Advanced Materials · doi:10.1002/adma.202301573 · Cited by 71
Full‐Stokes Polarimetry for Visible Light Enabled by an All‐Dielectric Metasurface
Ren, Y., Guo, S., Zhu, W., Huo, P., Liu, S., Zhang, S., Chen, P., Chen, L., Lezec, H. J., Agrawal, A. K., et al. (2022) · Advanced Photonics Research · doi:10.1002/adpr.202100373 · Cited by 69
Plasmonic high-entropy carbides
Calzolari, A., Oses, C., Toher, C., Esters, M., Campilongo, X., Stepanoff, S. P., Wolfe, D. E., & Stefano Curtarolo, A. (2022) · Nature Communications · doi:10.1038/s41467-022-33497-1 · Cited by 70
Feng, Z., Li, J., Yang, P., Xu, X., Wang, D., Li, J., Zhang, C., Li, J., Zhang, H., Zou, G., et al. (2025) · Nature Communications · doi:10.1038/s41467-025-57649-1 · Cited by 69
Metasurface‐Assisted Optical Encryption Carrying Camouflaged Information
Deng, J., Li, Z., Li, J., Zhou, Z., Gao, F., Qiu, C., & Yan, B. (2022) · Advanced Optical Materials · doi:10.1002/adom.202200949 · Cited by 66
Generation of super-resolved optical needle and multifocal array using graphene oxide metalenses
Wang, H., Hao, C., Lin, H., Wang, Y., Lan, T., Qiu, C., & Jia, B. (2021) · Opto-Electronic Advances · doi:10.29026/oea.2021.200031 · Cited by 63
Recent progress on structural coloration
Li, Y., Hu, J., Zeng, Y., Song, Q., Qiu, C., & Xiao, S. (2024) · Photonics Insights · doi:10.3788/pi.2024.r03 · Cited by 61
Self-citationDeep-learning-enabled electromagnetic near-field prediction and inverse design of metasurfaces
Kanmaz, T. B., Ozturk, E., Demir, H. V., & Gündüz-Demir, Ç. (2023) · Optica · doi:10.1364/optica.498211 · Cited by 60
Twisted bilayer meta-device for on-demand terahertz polarization filtering
Li, H., Zhao, C., Xu, W., Li, J., Zheng, C., Tan, Q., Song, C., Xu, H., Shen, Y., & Yao, J. (2025) · Photonics Research · doi:10.1364/prj.554358 · Cited by 60
Structural color switching with a doped indium-gallium-zinc-oxide semiconductor
Kim, I., Yun, J., Badloe, T., Park, H., Seo, T., Yang, Y., Kim, J., Chung, Y., & Rho, J. (2020) · Photonics Research · doi:10.1364/prj.395749 · Cited by 58
Reconfiguring Colors of Single Relief Structures by Directional Stretching
Ruan, Q., Zhang, W., Wang, H., Chan, J. Y. E., Wang, H., Liu, H., Fan, D., Li, Y., Qiu, C., & Yang, J. K. W. (2021) · Advanced Materials · doi:10.1002/adma.202108128 · Cited by 59
Recent advanced applications of metasurfaces in multi‐dimensions
Yuan, Q., Ge, Q., Chen, L., Zhang, Y., Yang, Y., Cao, X., Wang, S., Zhu, S. N., & Wang, Z. (2023) · Nanophotonics · doi:10.1515/nanoph-2022-0803 · Cited by 59
Self-citationDesign Strategies and Applications of Dimensional Optical Field Manipulation Based on Metasurfaces
Liu, W., Li, Z., Ansari, M. A., Cheng, H., Tian, J., Chen, X., & Chen, S. (2023) · Advanced Materials · doi:10.1002/adma.202208884 · Cited by 58
Seong, J., Jeon, Y., Yang, Y., Badloe, T., & Rho, J. (2023) · International Journal of Precision Engineering and Manufacturing-Green Technology · doi:10.1007/s40684-023-00580-x · Cited by 64
Chen, Q., Nan, X., Chen, M., Pan, D., Yang, X., & Wen, L. (2021) · Advanced Materials · doi:10.1002/adma.202103815 · Cited by 58
Wafer‐Scale Manufacturing of Near‐Infrared Metalenses
Moon, S., Kim, J., Park, C., Kim, W., Yang, Y., Kim, J., Lee, S., Choi, M., Sung, H., Park, J., et al. (2024) · Laser & Photonics Review · doi:10.1002/lpor.202300929 · Cited by 57
Learning the Physics of All‐Dielectric Metamaterials with Deep Lorentz Neural Networks
Khatib, O., Ren, S., Malof, J. M., & Padilla, W. J. (2022) · Advanced Optical Materials · doi:10.1002/adom.202200097 · Cited by 55
Broadband Multichannel Cylindrical Vector Beam Generation by a Single Metasurface
Wen, D., Pan, K., Meng, J., Wu, X., Guo, X., Li, P., Liu, S., Li, D., Wei, B., Xie, X., et al. (2022) · Laser & Photonics Review · doi:10.1002/lpor.202200206 · Cited by 56
Full and gradient structural colouration by lattice amplified gallium nitride Mie-resonators
Jang, J., Badloe, T., Sim, Y. C., Yang, Y., Mun, J., Lee, T., Cho, Y., & Rho, J. (2020) · Nanoscale · doi:10.1039/d0nr05624c · Cited by 55
Full-color nanorouter for high-resolution imaging
Chen, M., Wen, L., Pan, D., Cumming, D. R. S., Yang, X., & Chen, Q. (2021) · Nanoscale · doi:10.1039/d1nr02166d · Cited by 52
Mechanically reconfigurable metasurfaces: fabrications and applications
Zhao, Y., Liu, Z., Li, C., Jiao, W., Jiang, S., Li, X., Duan, J., & Li, J. (2024) · npj Nanophotonics · doi:10.1038/s44310-024-00010-z · Cited by 50
The road to atomically thin metasurface optics
Brongersma, M. L. (2020) · Nanophotonics · doi:10.1515/nanoph-2020-0444 · Cited by 51
Electromagnetic Wave Tailoring: From One Dimension to Multiple Dimensions
Zhang, J. C., Wu, G., Chen, M. K., Che, X., Liang, Y., Tsai, D. P., & Chan, C. H. (2023) · Electromagnetic Science · doi:10.23919/emsci.2023.0013 · Cited by 51
Self-citationPotential of high Q dual band Mid-Infrared metasurfaces with Quasi-BIC for refractive index sensing
Sun, W., Liang, Z., Shi, X., Yang, F., Dong, Y., Dai, R., Jia, Y., Xin, W., Hou, E., & Wu, Z. (2024) · Optics & Laser Technology · doi:10.1016/j.optlastec.2024.110631 · Cited by 49
Lou, Z., Yan, Y., Wang, J., Zhang, A., Cui, H., Li, C., & Geng, Y. (2023) · Optics Express · doi:10.1364/oe.510400 · Cited by 48
Printable Spin-Multiplexed Metasurfaces for Ultraviolet Holographic Displays
Kang, H., Kim, H., Kim, K., & Rho, J. (2024) · ACS Nano · doi:10.1021/acsnano.4c06280 · Cited by 48
Yang, J., Li, Q., Liu, S., Fang, D., Zhang, J., Jin, H., & Li, J. (2024) · Advanced Photonics · doi:10.1117/1.ap.6.4.046006 · Cited by 48
Bright Field Structural Colors in Silicon-on-Insulator Nanostructures
Li, L., Niu, J., Shang, X., Chen, S., Lu, C., Zhang, Y., & Shi, L. (2021) · ACS Applied Materials & Interfaces · doi:10.1021/acsami.0c19126 · Cited by 48
Daytime Sub-Ambient Radiative Cooling with Vivid Structural Colors Mediated by Coupled Nanocavities
Jin, S., Xiao, M., Zhang, W., Wang, B., & Zhao, C. (2022) · ACS Applied Materials & Interfaces · doi:10.1021/acsami.2c15573 · Cited by 48
Li, X., Zhao, J., Yang, J., Huo, Y., & Yu, Y. (2025) · Advanced Science · doi:10.1002/advs.202413027 · Cited by 46
Miniaturizing color-sensitive photodetectors via hybrid nanoantennas toward submicrometer dimensions
Ho, J., Dong, Z., Leong, H. S., Zhang, J., Tjiptoharsono, F., Rezaei, S. D., Goh, K. C. H., Wu, M., Li, S., Chee, J. Y., et al. (2022) · Science Advances · doi:10.1126/sciadv.add3868 · Cited by 45
Thin film block copolymer self-assembly for nanophotonics
Kulkarni, A. A., & Doerk, G. S. (2022) · Nanotechnology · doi:10.1088/1361-6528/ac6315 · Cited by 47
Structural color: an emerging nanophotonic strategy for multicolor and functionalized applications
Wang, W., Wang, L., Fu, Q., Zhang, W., Wang, L., Liu, G., Huang, Y., Huang, J., Zhang, H., Guo, F., et al. (2025) · Opto-Electronic Science · doi:10.29026/oes.2025.240030 · Cited by 45
Absorptive metasurface color filters based on hyperbolic metamaterials for a CMOS image sensor
Hong, J., Son, H., Kim, C., Mun, S., Sung, J., & Lee, B. (2021) · Optics Express · doi:10.1364/oe.415874 · Cited by 44
All-State Switching of the Mie Resonance of Conductive Polyaniline Nanospheres
Lu, Y., Lam, S. H., Lu, W., Shao, L., Chow, T. H., & Wang, J. (2022) · Nano Letters · doi:10.1021/acs.nanolett.1c04969 · Cited by 42
Amorphous to Crystalline Transition in Nanoimprinted Sol–Gel Titanium Oxide Metasurfaces
Kim, J., Kim, W., Choi, M., Park, Y., Kang, D., Lee, E., Park, C., Sung, H., Lee, H., & Rho, J. (2024) · Advanced Materials · doi:10.1002/adma.202405378 · Cited by 42
High‐Performance Transmission Structural Colors Generated by Hybrid Metal‐Dielectric Metasurfaces
Yang, B., Liu, W., Choi, D., Li, Z., Cheng, H., Tian, J., & Chen, S. (2021) · Advanced Optical Materials · doi:10.1002/adom.202100895 · Cited by 40
Magnetically Tunable One-Dimensional Plasmonic Photonic Crystals
Wu, C., Fan, Q., Wu, W., Liang, T. Q., Liu, Y., Yu, H., & Yin, Y. (2023) · Nano Letters · doi:10.1021/acs.nanolett.3c00069 · Cited by 39
Self-citationCellulose Nanocrystals Chiral Nematic Coating with Reversible Multiple-Stimuli-Responsive Coloration
Feng, K., Wei, G., Liu, Y., Wu, Y. J., & Zhou, F. (2023) · ACS Sustainable Chemistry & Engineering · doi:10.1021/acssuschemeng.3c01782 · Cited by 39
Self-citationPark, Y., Kim, J., Yang, Y., Oh, D. K., Kang, H., Kim, H., & Rho, J. (2025) · Advanced Science · doi:10.1002/advs.202409371 · Cited by 39
MEMS cantilever–controlled plasmonic colors for sustainable optical displays
Han, Z., Frydendahl, C., Mazurski, N., & Levy, U. (2022) · Science Advances · doi:10.1126/sciadv.abn0889 · Cited by 39
Emerging Planar Nanostructures Involving Both Local and Nonlocal Modes
Chai, R., Liu, Q., Liu, W., Li, Z., Cheng, H., Tian, J., & Chen, S. (2023) · ACS Photonics · doi:10.1021/acsphotonics.2c01534 · Cited by 38
Diamond Based Optical Metasurfaces for Broadband Wavefront Shaping in Harsh Environment
Yang, X., Wu, B., Chen, P., Xie, Y., Lin, C., Zhang, Z., Dou, W., Ni, P., & Shan, C. (2024) · Laser & Photonics Review · doi:10.1002/lpor.202400007 · Cited by 37
High-Q collective Mie resonances in monocrystalline silicon nanoantenna arrays for the visible light
Zhang, Z., Liu, P., Lu, W., Bai, P., Zhang, B., Chen, Z., Maier, S. A., Rivas, J. G., Wang, S., & Li, X. (2022) · Fundamental Research · doi:10.1016/j.fmre.2022.05.020 · Cited by 38
Self-citationMultiresonant all-dielectric metasurfaces based on high-order multipole coupling in the visible
Allayarov, I., Evlyukhin, A. B., & Lesina, A. C. (2024) · Optics Express · doi:10.1364/oe.511172 · Cited by 39
Metadata
- Authors
- Yang, W., Xiao, S., Song, Q., Liu, Y., Wu, Y., Wang, S., Yu, J., Han, J., & Tsai, D.-P.
- Affiliations
- Harbin Institute of Technology (CN)
- Shanxi University (CN)
- Hong Kong Polytechnic University (HK)
- Corresponding author
- Xiao, Shumin
- Tsai, Din-Ping
- ORCID
- Venue
- Nature Communications
- Published
- 2020-04-20
- Volume
- 11
- Issue
- 1
- Pages
- 1864-1864
- ISSN
- 2041-1723 (ISSN-L)
- PMC
- PMC7171068
- OpenAlex
- W3017271859
- Cited by
- 543
- References
- 49
- Citations by year
- 2026: 68 · 2025: 107 · 2024: 101 · 2023: 76 · 2022: 103 · 2021: 68 · 2020: 20
- FWCI
- 45.98
- Type
- journal article
- Language
- en
- Open access
- gold
- doi.org
- Locations
- Nature Communications (publishedVersion, cc-by)
- PubMed Central (publishedVersion, cc-by)
- PubMed (publishedVersion)
- RePEc: Research Papers in Economics (submittedVersion)
- DOAJ (DOAJ: Directory of Open Access Journals) (submittedVersion, cc-by-sa)
- PolyU Institutional Research Archive (Hong Kong Polytechnic University) (submittedVersion, cc-by)
- Funders
- National Natural Science Foundation of China (2018YFB2200400)
- Science, Technology and Innovation Commission of Shenzhen Municipality (SGDX2019081623281169)
- Topics
- Physical Sciences › Materials Science › Electronic, Optical and Magnetic Materials › Metamaterials and Metasurfaces Applications
- Physical Sciences › Physics and Astronomy › Atomic and Molecular Physics, and Optics › Photonic Crystals and Applications
- Physical Sciences › Physics and Astronomy › Atomic and Molecular Physics, and Optics › Plasmonic and Surface Plasmon Research
- Keywords
- structural color, silicon metasurfaces, color gamut, nanodisk arrays, diffraction-limited resolution, broadband reflection, dielectric metasurfaces
About these checks
Registry, retraction, Cites and statistics results are computed, not judged, with one exception: a printed reference that no index lists is read once by a model before it counts as a citation error. Claims are extracted by a model and kept only when their quote appears verbatim in the text; each cited source is then checked, with a model’s help, for whether it says what the claim relies on. Those verdicts can be wrong — read the claim’s quote and the cited source before relying on one.
Statistics and arithmetic are recomputed, not judged.
Confidence bands are shown only for fields calibrated on our annotated test set. None is calibrated yet, so no band is shown.
What counts as a claim ›How we measure confidence ›How we check this ›
Are you an author, or do you see a problem with this page? Request a review
