Cited by 343RNA Interference and Gene DeliveryNanoparticle-Based Drug DeliveryAdvancements in Transdermal Drug Delivery

The DOI matches its Crossref record; 51 of the 51 references it cites were found in a registry or an index.

Synergistic lipid compositions for albumin receptor mediated delivery of mRNA to the liver

Open access

Abstract

Lipid-like nanoparticles (LNPs) have potential as non-viral delivery systems for mRNA therapies. However, repeated administrations of LNPs may lead to accumulation of delivery materials and associated toxicity. To address this challenge, we have developed biodegradable lipids which improve LNPs clearance and reduce toxicity. We modify the backbone structure of Dlin-MC3-DMA by introducing alkyne and ester groups into the lipid tails. We evaluate the performance of these lipids when co-formulated with other amine containing lipid-like materials. We demonstrate that these formulations synergistically facilitate robust mRNA delivery with improved tolerability after single and repeated administrations. We further identify albumin-associated macropinocytosis and endocytosis as an ApoE-independent LNP cellular uptake pathway in the liver. Separately, the inclusion of alkyne lipids significantly increases membrane fusion to enhance mRNA release, leading to synergistic improvement of mRNA delivery. We believe that the rational design of LNPs with multiple amine-lipids increases the material space for mRNA delivery.

Overview

The claims and statistics of this paper haven’t been checked yet.

Run the check — free, no account needed. It reads the open-access text and checks the sources it cites.

A few free checks a day · papers already verified open instantly · results are public

Integrity signals

Registry

Crossref · 10.1038/s41467-020-16248-y

Cites

51 of 51 references verified0 citation errors · 0 not checkable

Statistics

Figures

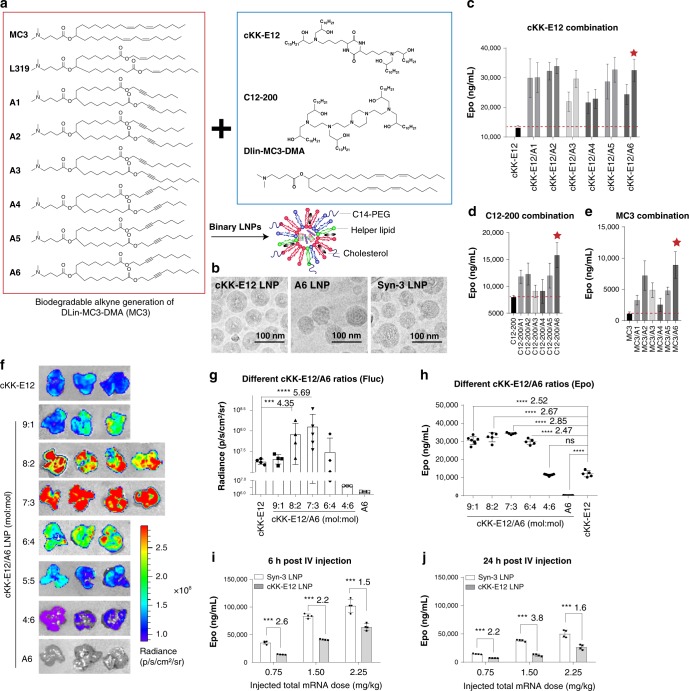
Fig. 1 LNPs containing multiple ionizable lipids demonstrate synergistic mRNA expression in vivo. a Design of biodegradable alkyne lipids and layout of the combination strategy. b Cryo-EM image and schematic illustration of mRNA loaded LNPs. c–e I.v. injection of hEPO mRNA loaded LNPs containing two different ionizable lipids (0.75 mg/kg of hEPO mRNA). c cKK-E12 and alkyne lipid combinations were evaluated at two molar ratios (left: 5:5, right: 7:3); combination of C12-200 and MC3 with alkyne lipids were evaluated at molar ratio 7:3, respectively. Formulation includes a composition of ionizable lipid:DOPE:cholesterol:C14-PEG2000 at the molar ratio of 35:16.0:46.5:2.5. Six hours after injection, hEPO protein in the serum was detected and quantified using hEPO ELISA. Red stars highlight the top-performing synergistic LNPs (n = 4/group). f, g IVIS images and quantification of luciferase expression. mRNA encoding firefly luciferase mRNA (Fluc mRNA) was formulated with LNPs composed of various molar ratios of cKK-E12 and A6. A molar ratio of cKK-E12:A6 at 7:3 (Syn-3) demonstrated the most robust enhancement in Fluc protein expression in the liver (n = 4 in cKK-E12, 9:1, 8:2, 6:4, n = 5 in 7:3 group, n = 3 in 4:6 and A6 groups, representative images were shown in f). h The optimal ratio of cKK-E12:A6 in the LNP formulation was also evaluated using hEPO mRNA. The optimal ratio was also found to be 7:3. i, j Dose-dependent and time-dependent protein expression using Syn-3 (cKK-E12:A6 is 7:3) LNPs was compared with cKK-E12 LNPs, and demonstrated superior gene expression in vivo. Data are presented as mean ± SD. ***P < 0.001, ****P < 0.0001, Student’s T-test comparing to cKK-E12 group.
Fig. 1 LNPs containing multiple ionizable lipids demonstrate synergistic mRNA expression in vivo. a Design of biodegradable alkyne lipids and layout of the combination strategy. b Cryo-EM image and schematic illustration of mRNA loaded LNPs. c–e I.v. injection of hEPO mRNA loaded LNPs containing two different ionizable lipids (0.75 mg/kg of hEPO mRNA). c cKK-E12 and alkyne lipid combinations were evaluated at two molar ratios (left: 5:5, right: 7:3); combination of C12-200 and MC3 with alkyne lipids were evaluated at molar ratio 7:3, respectively. Formulation includes a composition of ionizable lipid:DOPE:cholesterol:C14-PEG2000 at the molar ratio of 35:16.0:46.5:2.5. Six hours after injection, hEPO protein in the serum was detected and quantified using hEPO ELISA. Red stars highlight the top-performing synergistic LNPs (n = 4/group). f, g IVIS images and quantification of luciferase expression. mRNA encoding firefly luciferase mRNA (Fluc mRNA) was formulated with LNPs composed of various molar ratios of cKK-E12 and A6. A molar ratio of cKK-E12:A6 at 7:3 (Syn-3) demonstrated the most robust enhancement in Fluc protein expression in the liver (n = 4 in cKK-E12, 9:1, 8:2, 6:4, n = 5 in 7:3 group, n = 3 in 4:6 and A6 groups, representative images were shown in f). h The optimal ratio of cKK-E12:A6 in the LNP formulation was also evaluated using hEPO mRNA. The optimal ratio was also found to be 7:3. i, j Dose-dependent and time-dependent protein expression using Syn-3 (cKK-E12:A6 is 7:3) LNPs was compared with cKK-E12 LNPs, and demonstrated superior gene expression in vivo. Data are presented as mean ± SD. ***P < 0.001, ****P < 0.0001, Student’s T-test comparing to cKK-E12 group.CC BY · PubMed Central
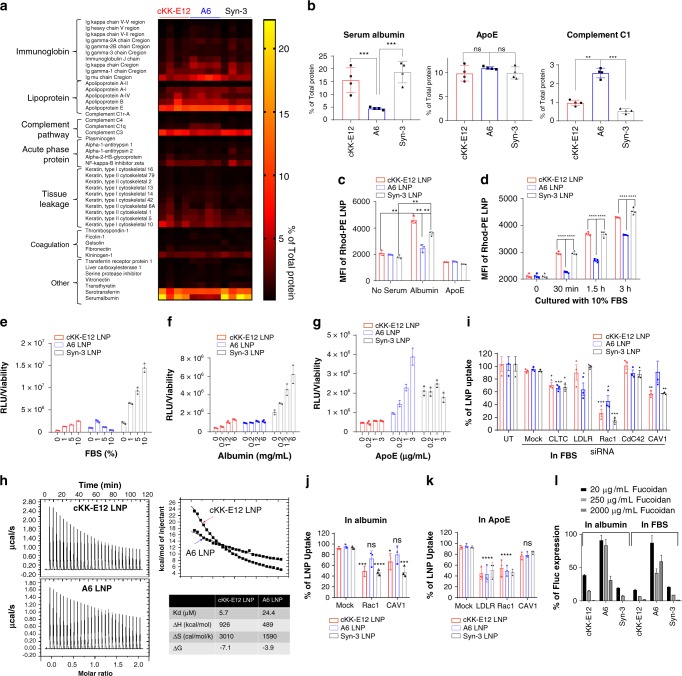
Fig. 2 Protein corona facilitates the binding and internalization of cKK-E12 containing LNPs to primary hepatocytes. a Proteomics analysis of protein coronas isolated from three types of LNPs (n = 4/group). Quantification of % of major proteins are shown in (b). c, d Uptake of Rhod-PE labeled LNPs in primary hepatocytes in the presence or absence of selected proteins (n = 4/group). One-way ANOVA. e, g Expression of luciferase mRNA 6 h post transfection of primary hepatocytes in different protein pretreatment conditions (n = 3/group). h ITC data estimates the binding between LNPs and albumin. One-wat ANOVA. i–k siRNA knockdown of certain endocytosis proteins demonstrates the mechanisms of endocytosis of different LNPs in the presence or absence of serum proteins (n = 3/group). Student’s T-test comparing to Mock group. l The function of albumin in mediating the endocytosis was confirmed using the albumin receptor inhibitor fucoidan (n = 4/group). Data are presented as mean ± S.D. *P < 0.05; **P < 0.01; ***P < 0.001; ****P < 0.0001. Statistical methods used for P value calculates are listed above in the legend.
Fig. 2 Protein corona facilitates the binding and internalization of cKK-E12 containing LNPs to primary hepatocytes. a Proteomics analysis of protein coronas isolated from three types of LNPs (n = 4/group). Quantification of % of major proteins are shown in (b). c, d Uptake of Rhod-PE labeled LNPs in primary hepatocytes in the presence or absence of selected proteins (n = 4/group). One-way ANOVA. e, g Expression of luciferase mRNA 6 h post transfection of primary hepatocytes in different protein pretreatment conditions (n = 3/group). h ITC data estimates the binding between LNPs and albumin. One-wat ANOVA. i–k siRNA knockdown of certain endocytosis proteins demonstrates the mechanisms of endocytosis of different LNPs in the presence or absence of serum proteins (n = 3/group). Student’s T-test comparing to Mock group. l The function of albumin in mediating the endocytosis was confirmed using the albumin receptor inhibitor fucoidan (n = 4/group). Data are presented as mean ± S.D. *P < 0.05; **P < 0.01; ***P < 0.001; ****P < 0.0001. Statistical methods used for P value calculates are listed above in the legend.CC BY · PubMed Central
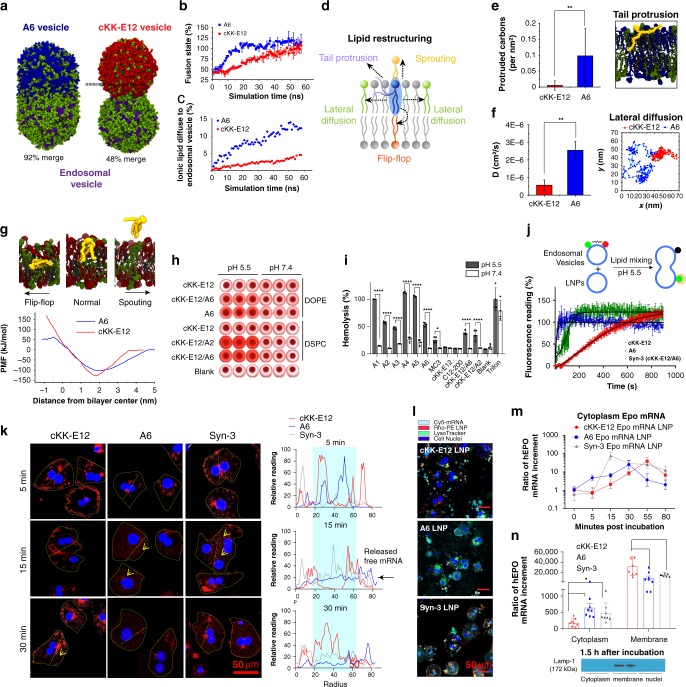
Fig. 3 Alkyne lipids facilitate the endosomal fusion and release of mRNA from LNPs. a Schematic of fusion between A6 (blue) or cKK-E12 (red) vesicles and endosomal vesicles by MD simulation. DOPE and DOPC are in green, LBPA is in purple, cholesterol is in gray. b Estimated vesicle merging states between A6 or cKK-E12 and endosomal vesicles. Merging state is defined as the ratio between the neck area and the largest intersection area of the endosomal vesicle (Error bars: variation of the neck area). c Percentile of A6 or cKK-E12 lipid mixed in endosomal vesicles during fusion simulation. d Schematic of lipid restructuring movements in LNPs during fusion. e MD calculations of lipid tail protrusion in cKK-E12 and A6 membranes (n = 1000). Student’s T-test. Panel on the right: a snapshot of A6 lipid protruding out the membrane with one tail. f Lateral diffusion coefficient of A6 and cKK-E12 lipid in singular membranes calculated from the mean square displacement using linear regression (n = 5000) (Error bars: errors between individual lipids). Student’s T-test. Penal on the right: trajectory of A6 or cKK-E12 lipid within the singular membrane over 40 ns simulation. g Free energy profile of A6 and cKK-E12 lipid sprouting and flip-flop action. h, i hemolysis analysis of variable LNPs in acidic and neutral pH conditions (n = 4), Student’s T-test. j Fluorescence resonance energy transfer (FRET) based membrane fusion assay. Rhodamine-PE and NBD-PE dual labeled endosomal vesicles (donor vesicles) were mixed with non-fluorescent labeled cKK-E12, A6, or Syn-3 LNPs. NBD fluorescence was monitored at 540 nm with excitation at 465 nm upon mixing. Mixing of un-labeled vesicles were subtracted as blank. k Time-lapse images of released free mRNA in primary hepatocytes treated with Cy5-mRNA LNPs in 10% serum. Hepatocytes were highlighted in yellow dotted circles. Yellow arrows indicate released free fluorescent mRNA observed within cytoplasm. Quantifications presented on right were based on the fluorescence intensity around the straight dotted yellow lines across hepatocytes. Blue rectangle highlights the fluorescence distributed near cell nuclei. l Hepatocytes were incubated with Cy5-mRNA-encapsulated Rhob-PE-labeled LNPs for 1 h in 10% serum. Lyso-endosome system was stained with LysoTracker green. The cytoplasmic distribution of LNPs and mRNA were visualized using confocal microscope. m, n Subcellular fractionation of hEPO mRNA from cytoplasm or membrane containing vehicles. m Time-lapse release of free hEPO mRNA into cytoplasm (n = 8). n At 1.5 h after incubation, the distribution of hEPO mRNA in the cytoplasmic compartment and membrane associated compartment was quantified by rt-PCR (n = 4), Student’s T-test. The subcellular isolation was confirmed by membrane associated marker Lamp-1 staining. All data are presented as mean ± SD. *P < 0.05, **P < 0.01, ***P < 0.001, ****P < 0.0001.
Fig. 3 Alkyne lipids facilitate the endosomal fusion and release of mRNA from LNPs. a Schematic of fusion between A6 (blue) or cKK-E12 (red) vesicles and endosomal vesicles by MD simulation. DOPE and DOPC are in green, LBPA is in purple, cholesterol is in gray. b Estimated vesicle merging states between A6 or cKK-E12 and endosomal vesicles. Merging state is defined as the ratio between the neck area and the largest intersection area of the endosomal vesicle (Error bars: variation of the neck area). c Percentile of A6 or cKK-E12 lipid mixed in endosomal vesicles during fusion simulation. d Schematic of lipid restructuring movements in LNPs during fusion. e MD calculations of lipid tail protrusion in cKK-E12 and A6 membranes (n = 1000). Student’s T-test. Panel on the right: a snapshot of A6 lipid protruding out the membrane with one tail. f Lateral diffusion coefficient of A6 and cKK-E12 lipid in singular membranes calculated from the mean square displacement using linear regression (n = 5000) (Error bars: errors between individual lipids). Student’s T-test. Penal on the right: trajectory of A6 or cKK-E12 lipid within the singular membrane over 40 ns simulation. g Free energy profile of A6 and cKK-E12 lipid sprouting and flip-flop action. h, i hemolysis analysis of variable LNPs in acidic and neutral pH conditions (n = 4), Student’s T-test. j Fluorescence resonance energy transfer (FRET) based membrane fusion assay. Rhodamine-PE and NBD-PE dual labeled endosomal vesicles (donor vesicles) were mixed with non-fluorescent labeled cKK-E12, A6, or Syn-3 LNPs. NBD fluorescence was monitored at 540 nm with excitation at 465 nm upon mixing. Mixing of un-labeled vesicles were subtracted as blank. k Time-lapse images of released free mRNA in primary hepatocytes treated with Cy5-mRNA LNPs in 10% serum. Hepatocytes were highlighted in yellow dotted circles. Yellow arrows indicate released free fluorescent mRNA observed within cytoplasm. Quantifications presented on right were based on the fluorescence intensity around the straight dotted yellow lines across hepatocytes. Blue rectangle highlights the fluorescence distributed near cell nuclei. l Hepatocytes were incubated with Cy5-mRNA-encapsulated Rhob-PE-labeled LNPs for 1 h in 10% serum. Lyso-endosome system was stained with LysoTracker green. The cytoplasmic distribution of LNPs and mRNA were visualized using confocal microscope. m, n Subcellular fractionation of hEPO mRNA from cytoplasm or membrane containing vehicles. m Time-lapse release of free hEPO mRNA into cytoplasm (n = 8). n At 1.5 h after incubation, the distribution of hEPO mRNA in the cytoplasmic compartment and membrane associated compartment was quantified by rt-PCR (n = 4), Student’s T-test. The subcellular isolation was confirmed by membrane associated marker Lamp-1 staining. All data are presented as mean ± SD. *P < 0.05, **P < 0.01, ***P < 0.001, ****P < 0.0001.CC BY · PubMed Central
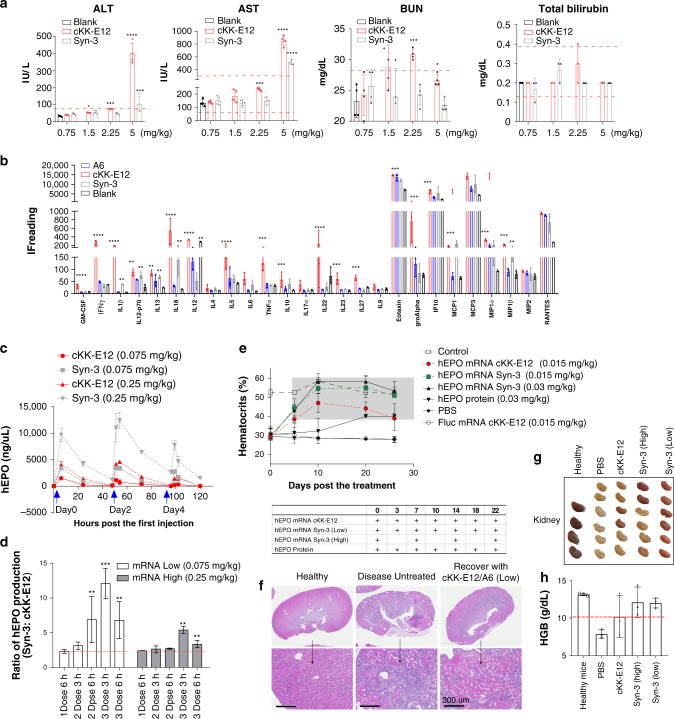
Fig. 4 Tolerability and multiple dosing efficacy of synergistic LNPs. a Dose-dependent blood chemistry assay demonstrated decreased toxicity of Syn-3 LNPs as compared with cKK-E12 LNPs with relatively low values of AST, ALT, BUN, and total bilirubin (n = 4/group), Student’s T-test comparing to blank. b The multi-plex cytokine assay of blank LNPs (equivalent to 1.5 mg/kg mRNA LNPs) after single dose (n = 4/group), Student’s T-test comparing to blank. c mRNA expression kinetics after multiple dosing of mRNA containing LNPs. Protein expression ratio of Syn-3 LNPs were compared with mono cKK-E12 LNPs at different time points (n = 4). d Student’s T-test comparing to 1 Dose 6 h. e treatment of renal anemia by different forms of hEPO containing LNPs (n = 6–8). f, g Morphology and structure of kidney after treatments. h HGB levels were also compared in different groups (n = 6). Data are presented as mean ± SD. *P < 0.05, **P < 0.01, ***P < 0.001, ****P < 0.0001.
Fig. 4 Tolerability and multiple dosing efficacy of synergistic LNPs. a Dose-dependent blood chemistry assay demonstrated decreased toxicity of Syn-3 LNPs as compared with cKK-E12 LNPs with relatively low values of AST, ALT, BUN, and total bilirubin (n = 4/group), Student’s T-test comparing to blank. b The multi-plex cytokine assay of blank LNPs (equivalent to 1.5 mg/kg mRNA LNPs) after single dose (n = 4/group), Student’s T-test comparing to blank. c mRNA expression kinetics after multiple dosing of mRNA containing LNPs. Protein expression ratio of Syn-3 LNPs were compared with mono cKK-E12 LNPs at different time points (n = 4). d Student’s T-test comparing to 1 Dose 6 h. e treatment of renal anemia by different forms of hEPO containing LNPs (n = 6–8). f, g Morphology and structure of kidney after treatments. h HGB levels were also compared in different groups (n = 6). Data are presented as mean ± SD. *P < 0.05, **P < 0.01, ***P < 0.001, ****P < 0.0001.CC BY · PubMed Central

Verification

Claims the paper makes

The claims and statistics of this paper haven’t been checked yet.

Run the check — free, no account needed. It reads the open-access text and checks the sources it cites.

A few free checks a day · papers already verified open instantly · results are public

Claims other papers make about this one

Each is checked against this paper’s own text: does it say what the citing paper says it does?

Self-check

Percentages, sums and reported differences re-computed from the paper’s own numbers.

The self-check needs the paper’s full text.

Citations

Cites

Show all 51 references

Research works printed but not linked: 3

  1. Kauffman, K. J. et al. Optimization of lipid nanoparticle formulations for mRNA delivery in vivo with fractional factorial and definitive screening designs. Nano Lett. 15, 7300–7306 (2015). · DOI · Paper page
  2. Jorgensen, W. L. M. D. S. & Tirado-Rives, J. Development and testing of the OPLS all-atom force field on conformational energetics and properties of organic liquids. J. Am. Chem. Soc. 118, 12 (1996).
  3. Jorgensen, W., Gao, J. & Carlo, M. Simulations of the hydration of ammonium and carboxylate ions. J. Phys. Chem. 47907, 9 (1986).

Cited by

Sorted by citations

See all 343

Metadata

Authors
Miao, L., Lin, J., Huang, Y., Li, L., Delcassian, D., Ge, Y., Shi, Y., & Anderson, D. G.
Affiliations
  • Koch Institute for Integrative Cancer Research At MIT (US)
  • Karolinska Institutet (SE)
  • Boston Children's Hospital (US)
  • Harvard University (US)
Corresponding author
Anderson, Daniel G.
Venue
Nature Communications
Published
2020-05-15
Volume
11
Issue
1
Pages
2424-2424
ISSN
2041-1723 (ISSN-L)
OpenAlex
W3024523552
Cited by
343
References
51
Citations by year
2026: 39 · 2025: 76 · 2024: 77 · 2023: 60 · 2022: 52 · 2021: 31 · 2020: 8
FWCI
12.24
Type
journal article
Language
en
Open access
Locations
  • Nature Communications (publishedVersion, cc-by)
  • PubMed Central (publishedVersion, cc-by)
  • PubMed (publishedVersion)
  • DSpace@MIT (Massachusetts Institute of Technology) (submittedVersion, cc-by)
  • RePEc: Research Papers in Economics (submittedVersion)
  • DOAJ (DOAJ: Directory of Open Access Journals) (submittedVersion, cc-by-sa)
Funders
Juvenile Diabetes Research Foundation (17-2007-1063, 3-PDF-2015-91-A-N)
Topics
  • Life Sciences › Biochemistry, Genetics and Molecular Biology › Molecular Biology › RNA Interference and Gene Delivery
  • Physical Sciences › Materials Science › Biomaterials › Nanoparticle-Based Drug Delivery
  • Life Sciences › Pharmacology, Toxicology and Pharmaceutics › Pharmaceutical Science › Advancements in Transdermal Drug Delivery
Keywords
mRNA delivery, liver targeting, albumin receptor, biodegradable lipids, macropinocytosis, endocytosis, membrane fusion, mRNA release
MeSH terms
Alkynes, Amines, Animals, Apolipoproteins E, Biocompatible Materials, Erythrocytes, Erythropoietin, Esters, Humans, Lipids, Liver, Male, Mice, Inbred C57BL, Endosomes, RNA, Messenger, Drug Delivery Systems, Receptors, Albumin, Hepatocytes, RNA, Small Interfering, Mice, Nanoparticles, Molecular Dynamics Simulation

About these checks

Registry, retraction, Cites and statistics results are computed, not judged, with one exception: a printed reference that no index lists is read once by a model before it counts as a citation error. Claims are extracted by a model and kept only when their quote appears verbatim in the text; each cited source is then checked, with a model’s help, for whether it says what the claim relies on. Those verdicts can be wrong — read the claim’s quote and the cited source before relying on one.

Statistics and arithmetic are recomputed, not judged.

Confidence bands are shown only for fields calibrated on our annotated test set. None is calibrated yet, so no band is shown.

What counts as a claim ›How we measure confidence ›How we check this ›

Are you an author, or do you see a problem with this page? Request a review