

The DOI matches its Crossref record; 84 of the 85 references it cites were found in a registry or an index.
Raman-guided subcellular pharmaco-metabolomics for metastatic melanoma cells
Open accessAbstract
Non-invasively probing metabolites within single live cells is highly desired but challenging. Here we utilize Raman spectro-microscopy for spatial mapping of metabolites within single cells, with the specific goal of identifying druggable metabolic susceptibilities from a series of patient-derived melanoma cell lines. Each cell line represents a different characteristic level of cancer cell de-differentiation. First, with Raman spectroscopy, followed by stimulated Raman scattering (SRS) microscopy and transcriptomics analysis, we identify the fatty acid synthesis pathway as a druggable susceptibility for differentiated melanocytic cells. We then utilize hyperspectral-SRS imaging of intracellular lipid droplets to identify a previously unknown susceptibility of lipid mono-unsaturation within de-differentiated mesenchymal cells with innate resistance to BRAF inhibition. Drugging this target leads to cellular apoptosis accompanied by the formation of phase-separated intracellular membrane domains. The integration of subcellular Raman spectro-microscopy with lipidomics and transcriptomics suggests possible lipid regulatory mechanisms underlying this pharmacological treatment. Our method should provide a general approach in spatially-resolved single cell metabolomics studies.
Overview
The claims and statistics of this paper haven’t been checked yet.
Run the check — free, no account needed. It reads the open-access text and checks the sources it cites.
Integrity signals
Registry
Cites
Statistics
Figures
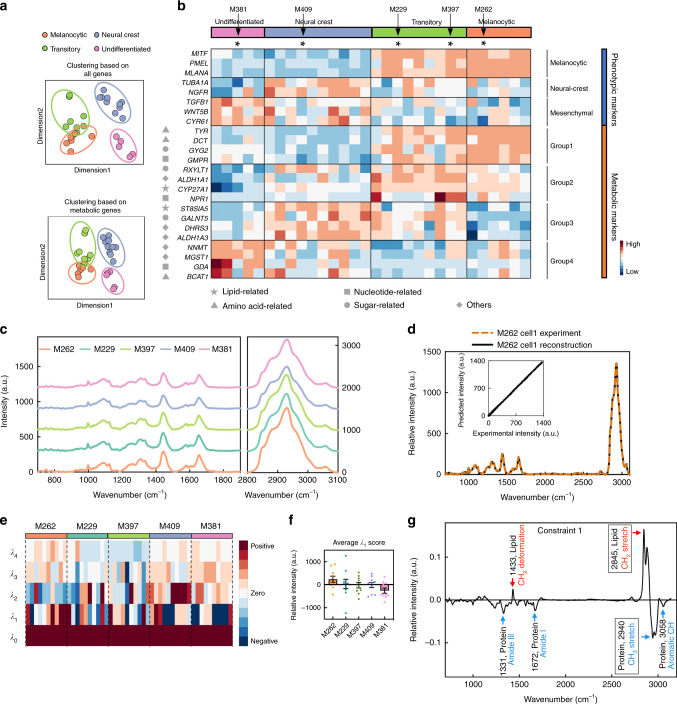
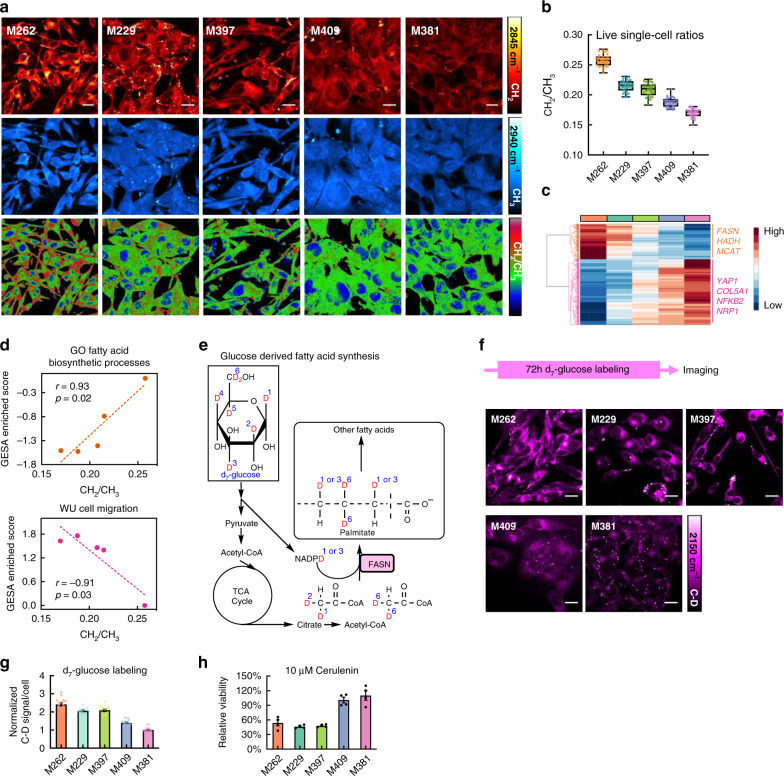
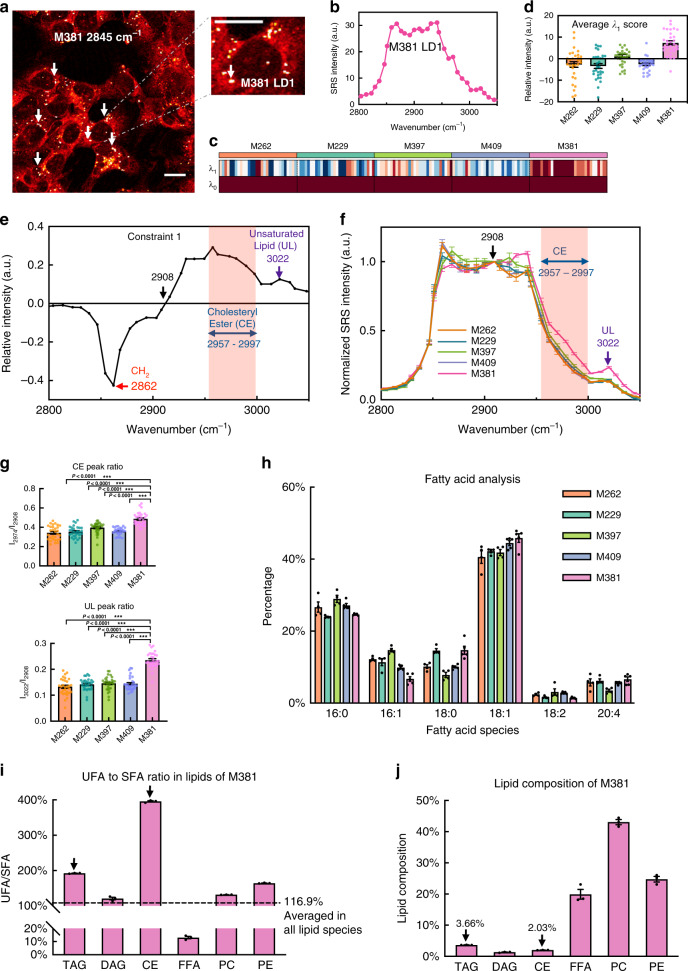
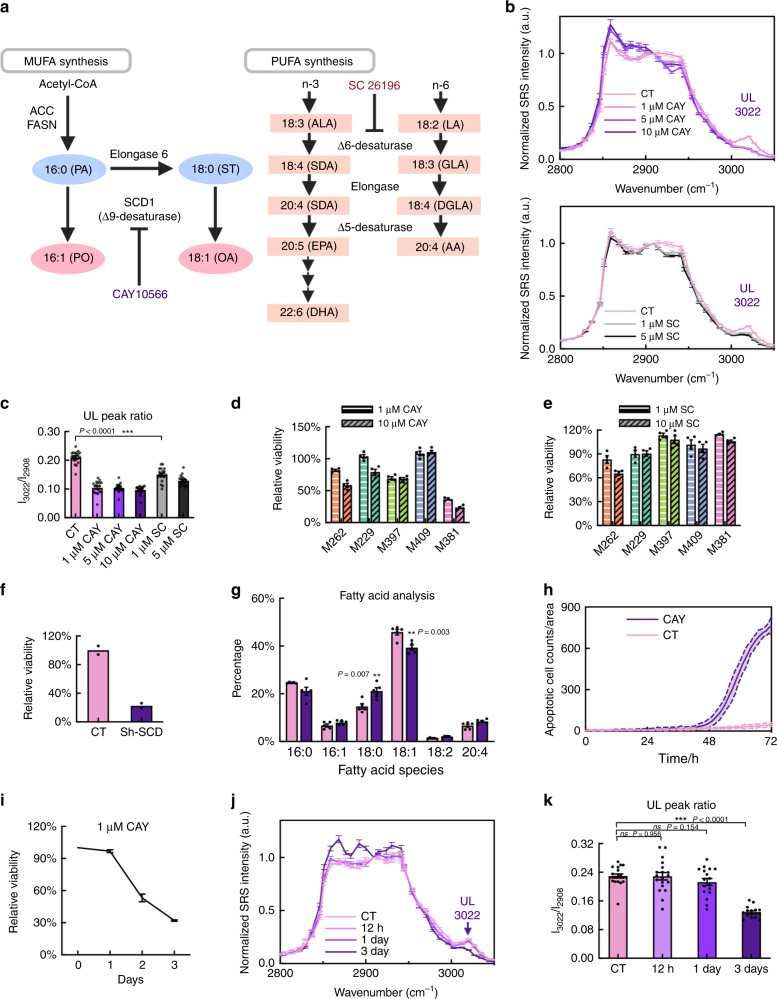
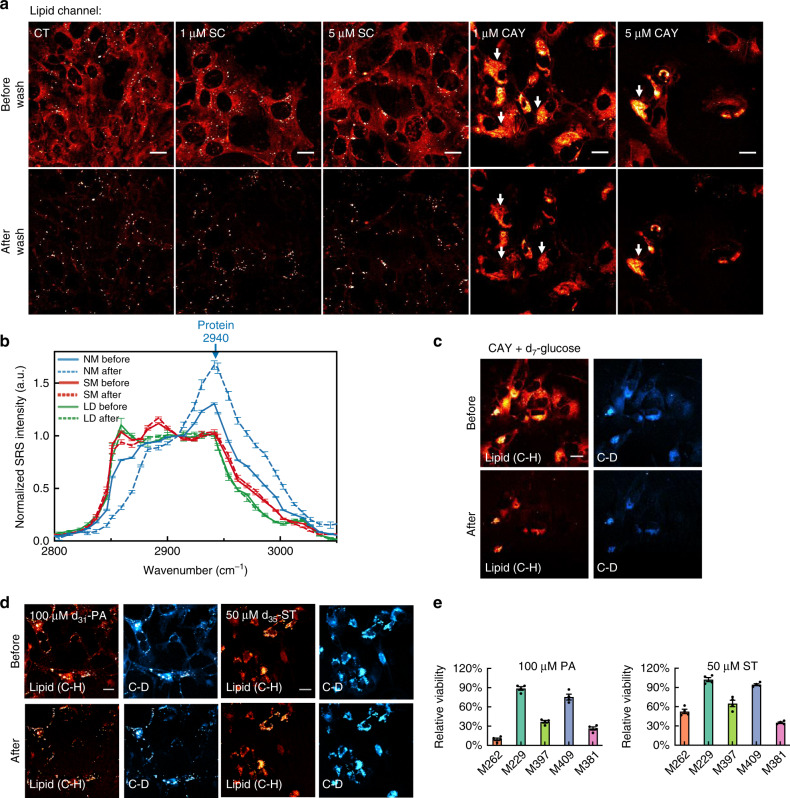
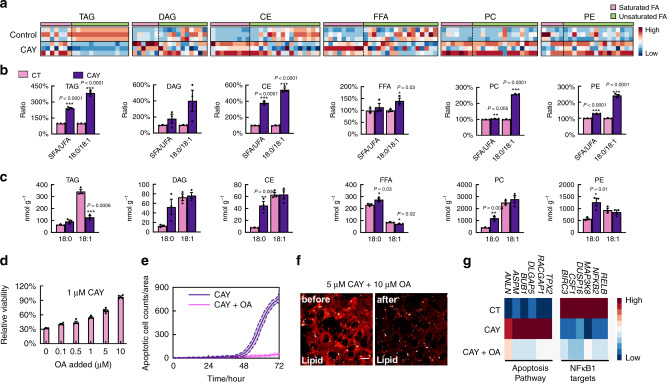
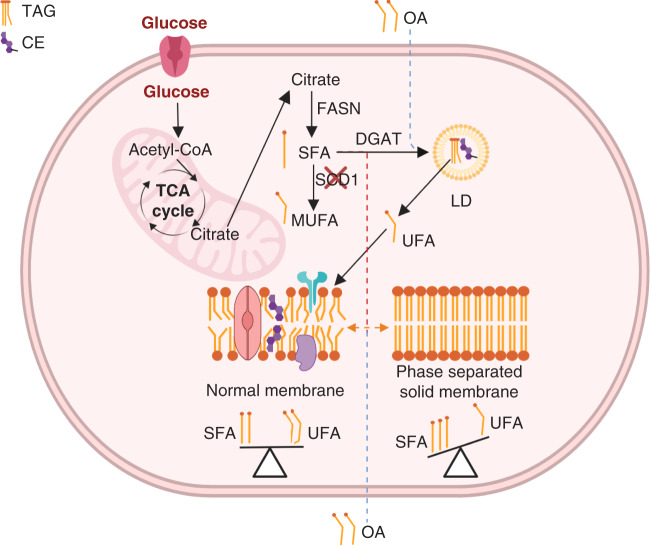
Verification
Claims the paper makes
The claims and statistics of this paper haven’t been checked yet.
Run the check — free, no account needed. It reads the open-access text and checks the sources it cites.
Claims other papers make about this one
Each is checked against this paper’s own text: does it say what the citing paper says it does?
The source backs part of the claim, not all of it — or backs it for a different population, condition or comparison.
In the citing paper
“The drug-resistant, U cancer cell state displays increased activity of enzymes promoting the synthesis and uptake of PUFAs (16, 17), such as arachidonic acid (AA, C20:4) and linolenic acid (C18:2), which are major substrates for ROS attack.”
From Secreted Apoe rewires melanoma cell state vulnerability to ferroptosis (2024) · cites this paper as [16]
Experimental — accuracy not yet measured
Self-check
Percentages, sums and reported differences re-computed from the paper’s own numbers.
The self-check needs the paper’s full text.
Citations
Cites
1 retracted
RETRACTED ARTICLE: LncMAPK6 drives MAPK6 expression and liver TIC self-renewal
Huang, G., Jiang, H., He, Y., Lin, Y., Xia, W., Luo, Y., Liang, M., Shi, B., Zhou, X., & Jian, Z. (2018) · Journal of Experimental & Clinical Cancer Research · doi:10.1186/s13046-018-0770-y · Cited by 19
RetractedSubramanian, A., Tamayo, P., Mootha, V. K., Mukherjee, S., Ebert, B. L., Gillette, M. A., Paulovich, A., Pomeroy, S. L., Golub, T. R., Lander, E. S., et al. (2005) · Proceedings of the National Academy of Sciences · doi:10.1073/pnas.0506580102 · Cited by 53,625
Mutations of the BRAF gene in human cancer
Davies, H., Bignell, G. R., Cox, C., Stephens, P., Edkins, S., Clegg, S., Teague, J., Woffendin, H., Garnett, M. J., Bottomley, W., et al. (2002) · Nature · doi:10.1038/nature00766 · Cited by 10,674
Santos, A. G., da Rocha, G. O., & de Andrade, J. B. (2019) · Scientific Reports · doi:10.1038/s41598-018-37186-2 · Cited by 8,495
Membrane lipids: where they are and how they behave
van Meer, G., Voelker, D. R., & Feigenson, G. W. (2008) · Nature Reviews Molecular Cell Biology · doi:10.1038/nrm2330 · Cited by 7,157
Single-cell RNA-seq highlights intratumoral heterogeneity in primary glioblastoma
Patel, A. P., Tirosh, I., Trombetta, J. J., Shalek, A. K., Gillespie, S. M., Wakimoto, H., Cahill, D. P., Nahed, B. V., Curry, W. T., Martuza, R. L., et al. (2014) · Science · doi:10.1126/science.1254257 · Cited by 5,063
Dissecting the multicellular ecosystem of metastatic melanoma by single-cell RNA-seq
Tirosh, I., Izar, B., Prakadan, S. M., Wadsworth, M. H., Treacy, D., Trombetta, J. J., Rotem, A., Rodman, C., Lian, C., Murphy, G., et al. (2016) · Science · doi:10.1126/science.aad0501 · Cited by 4,944
Genomic and Transcriptomic Features of Response to Anti-PD-1 Therapy in Metastatic Melanoma
Hugo, W., Zaretsky, J. M., Sun, L., Song, C., Moreno, B. H., Hu-Lieskovan, S., Berent-Maoz, B., Pang, J., Chmielowski, B., Cherry, G., et al. (2016) · Cell · doi:10.1016/j.cell.2016.02.065 · Cited by 3,448
Self-citationMetabolic Reprogramming: A Cancer Hallmark Even Warburg Did Not Anticipate
Ward, P. S., & Thompson, C. B. (2012) · Cancer Cell · doi:10.1016/j.ccr.2012.02.014 · Cited by 3,233
Dynamics and functions of lipid droplets
Olzmann, J. A., & Carvalho, P. (2019) · Nature Reviews Molecular Cell Biology · doi:10.1038/s41580-018-0085-z · Cited by 2,740
Cited by
Sorted by citations
Items 101–171 of 171
Mukherjee, D. A. (2026) · Clinical Immunology Communications · doi:10.1016/j.clicom.2026.01.004 · Cited by 6
RamEx: an R package for high-throughput microbial ramanome analyses with accurate quality assessment
Zhang, Y., Jing, G., Chen, R., Gong, Y., Li, Y., Wang, Y., Wang, X., Zhang, J., Mao, Y., He, Y., et al. (2026) · Microbiome · doi:10.1186/s40168-026-02339-3 · Cited by 6
Non-mass spectrometric targeted single-cell metabolomics
Cheng, H., Tang, Y., Li, Z., Guo, Z., Heath, J. R., Xue, M., & Wei, W. (2023) · TrAC Trends in Analytical Chemistry · doi:10.1016/j.trac.2023.117300 · Cited by 6
Self-citationTo Acquire or Not to Acquire: Evaluating Compressive Sensing for Raman Spectroscopy in Biology
Raj, P., Wu, L., Kim, J. H., Bhatt, R., Glunde, K., & Barman, I. (2024) · ACS Sensors · doi:10.1021/acssensors.4c01732 · Cited by 5
A Two‐Photon Excited Organic Laser Material for Nano‐Theranostics
Sun, C., Li, J., Yuan, F., Liu, Z., Yang, R., Ye, J., Fu, H., Yao, J., & Zhang, H. (2025) · Laser & Photonics Review · doi:10.1002/lpor.202500299 · Cited by 5
AI-based hardware and software tools in microscopy to boost research in immunology and virology
Morone, D., & D’Antuono, R. (2025) · Frontiers in Immunology · doi:10.3389/fimmu.2025.1610345 · Cited by 5
Recent advances in Raman probes for multiplexed bioimaging
Togo, T., Fujioka, H., & Kamiya, M. (2025) · Inflammation and Regeneration · doi:10.1186/s41232-025-00400-6 · Cited by 6
Coherent Raman spectroscopy: Quo vadis?
Brzozowski, K., Korona, W., Nowakowska, A. M., Borek-Dorosz, A., Pieczara, A., Orzechowska, B., Wislocka, A., Schmitt, M. P., Popp, J., & Barańśka, M. (2024) · Vibrational Spectroscopy · doi:10.1016/j.vibspec.2024.103684 · Cited by 6
In situ single-cell spontaneous Raman spectroscopy differentiates tumor-associated macrophages
Xie, J., Wei, Y., Liang, X., Ma, C., & Su, X. (2024) · Sensors and Actuators B Chemical · doi:10.1016/j.snb.2024.136053 · Cited by 5
Malarvannan, M., Sabavath, B. T. N., Gaddam, V., & Paul, D. (2025) · Talanta · doi:10.1016/j.talanta.2025.127855 · Cited by 6
Stimulated Raman scattering imaging with small vibrational probes
Wang, H., Du, J., Lee, D., & Wei, L. (2022) · Elsevier eBooks · doi:10.1016/b978-0-323-85158-9.00023-3 · Cited by 5
Self-citationElucidating Iron Metabolism through Molecular Imaging
Liao, F., Yang, W., Long, L., Yu, R., Qu, H., Peng, Y., Lu, J., Ren, C., Wang, Y., & Fu, C. (2024) · Current Issues in Molecular Biology · doi:10.3390/cimb46040175 · Cited by 4
Wang, Y., Wang, Y., Chen, X., Zhu, M., Yang, X., Wu, Y., Gao, S., Zhang, M., Su, L., Han, W., et al. (2024) · Applied Spectroscopy · doi:10.1177/00037028241254403 · Cited by 4
Shuo, 张. Z., Tinghe, 房. F., & Shuhua, 岳. Y. (2024) · Chinese Journal of Lasers · doi:10.3788/cjl240743 · Cited by 4
He, W., Wang, M., Li, M., Zhong, Z., Chen, H., Xi, S., Luan, Z., Li, C., & Zhang, X. (2022) · Frontiers in Marine Science · doi:10.3389/fmars.2022.1077595 · Cited by 4
Optical metabolic imaging of the tricarboxylic acid cyclePreprint
Chadha, R. S., Kocheril, P. A., Colazo, A., Kapelczak, E. D., Suen, B., Yang, Z., TeSlaa, T. A., & Wei, L. (2026) · bioRxiv (Cold Spring Harbor Laboratory) · doi:10.64898/2026.01.28.702395 · Cited by 5
Self-citationZeng, J., Liu, C., Shi, Q., Zhang, S., Li, Y., Liu, J., Wang, N., Wu, G., Wang, J., Liu, S., et al. (2025) · Analytical Chemistry · doi:10.1021/acs.analchem.5c00308 · Cited by 3
Murali, M., & Maiti, K. K. (2025) · The Analyst · doi:10.1039/d5an00586h · Cited by 3
Su, Y., Thelen, A. M., Wirth, L. V., Jenkins, C. M., Mak, S. R., Chen, D. G., Gottardo, R., & Greenberg, P. D. (2025) · Proceedings of the National Academy of Sciences · doi:10.1073/pnas.2516951122 · Cited by 3
Self-citationMa, C., Zhou, H., 滕竞飞, Wang, R., Zhao, F., Zhou, W., Guan, Y., Wu, Z., Li, S., Ai, X., et al. (2026) · Analytical Chemistry · doi:10.1021/acs.analchem.6c00220 · Cited by 4
Prasad, M., Ghosh, M., & Kumar, R. (2022) · Elsevier eBooks · doi:10.1016/b978-0-323-85062-9.00013-1 · Cited by 3
Miniaturized Chemical Tags for Optical Imaging
Benson, S., Moliner, F. D., Tipping, W. J., & Vendrell, M. (2022) · Angewandte Chemie · doi:10.1002/ange.202204788 · Cited by 3
Li, J., Tan, Y., Zhao, G., Huang, K., Cárdenas, H., Matei, D. E., & Cheng, J. (2021) · bioRxiv (Cold Spring Harbor Laboratory) · doi:10.1101/2021.05.17.444564 · Cited by 3
Seeing beyond Labels: Optical Technologies Reshaping Cell Culture Monitoring in Biomedicine
Charconnet, M., & Plou, J. (2024) · ACS Applied Engineering Materials · doi:10.1021/acsaenm.4c00613 · Cited by 3
Raman metabolic imaging: an emerging tool for the study of drug resistance in cancer
Zhao, W., & Yue, S. (2025) · Journal of Physics D Applied Physics · doi:10.1088/1361-6463/adbfa2 · Cited by 2
Zhou, Y., Lü, W., & Lee, H. J. (2025) · Journal of Innovative Optical Health Sciences · doi:10.1142/s179354582544002x · Cited by 2
SIP‐SRS Imaging of Cell Wall Synthesis Identifies a Synergy between Micafungin and Amphotericin B
Zhang, M., Zhan, Y., Lin, H., Chen, J., Seleem, M. N., Mansour, M. K., & Cheng, J. (2025) · Advanced Science · doi:10.1002/advs.202507331 · Cited by 2
Zhao, W., Yin, S., Liu, J., Zou, J., Wang, J., Xi, J., & Yue, S. (2026) · Journal of Innovative Optical Health Sciences · doi:10.1142/s1793545826500033 · Cited by 2
3D multi-omics tumour atlases: from technology to biology and clinical translation
Liu, M., Villazon, J. I., Forjaz, A., Tian, X., Fan, R., Wang, S., Shi, L., Wirtz, D., & Kiemen, A. L. (2026) · Nature reviews. Cancer · doi:10.1038/s41568-026-00940-0 · Cited by 3
Zhang, Y., Ma, K., Jiang, L., Xu, L., Luo, Y., Wu, J., & Li, Y. (2023) · ACS Omega · doi:10.1021/acsomega.3c00122 · Cited by 2
Bin, 杨. Y., Shuhua, 岳. Y., & Pu, 王. W. (2024) · Chinese Journal of Lasers · doi:10.3788/cjl240447 · Cited by 2
Morsy, Y., Hubeli, B., Turko, P., Barysch, M. J., Gómez, J. M. M., Zamboni, N., Rogler, G., Dummer, R., Levesque, M. P., & Scharl, M. M. (2025) · Cell Reports Medicine · doi:10.1016/j.xcrm.2025.102283 · Cited by 2
Stimulated Raman scattering imaging of cancer metabolism: New avenue to precision medicine
Yue, S. (2022) · Elsevier eBooks · doi:10.1016/b978-0-323-85158-9.00027-0 · Cited by 2
Pharmacometabolomics-Based Translational Biomarkers: How to Navigate the Data Ocean
Bafiti, V., & Κάτσιλα, Θ. (2022) · OMICS A Journal of Integrative Biology · doi:10.1089/omi.2022.0097 · Cited by 2
SRS-FISH: High-Throughput Platform Linking Microbiome Function to Identity at the Single Cell LevelPreprint
Ge, X., Pereira, F. C., Mitteregger, M., Berry, D., Zhang, M., Wagner, M., & Cheng, J. (2021) · bioRxiv (Cold Spring Harbor Laboratory) · doi:10.1101/2021.07.23.453601 · Cited by 2
Photothermally Detected Stimulated Raman Microscopy towards Ultrasensitive Chemical ImagingPreprint
Zhu, Y., Ge, X., Ni, H., Yin, J., Lin, H., Wang, L., Tan, Y., Dessai, C. V. P., & Cheng, J. (2023) · bioRxiv (Cold Spring Harbor Laboratory) · doi:10.1101/2023.03.06.531387 · Cited by 2
Episymbiotic bacterium induces intracellular lipid droplet production in its host bacteriaPreprint
Dong, P., Tian, J., Kobayashi-Kirschvink, K. J., Cen, L., McLean, J. S., Bor, B., Shi, W., & He, X. (2023) · bioRxiv (Cold Spring Harbor Laboratory) · doi:10.1101/2023.09.06.556576 · Cited by 2
Label‐Free Prediction of Tumor Metastatic Potential via Ramanome
Zhang, Y., Zhang, Y., Gong, R., Liu, X., Zhang, Y., Sun, L., Ma, Q., Wang, J., Lei, K., Ren, L., et al. (2024) · Small Methods · doi:10.1002/smtd.202400861 · Cited by 1
Loss of fatty acid-binding protein 7 promotes B16F10 melanoma metastasis
Wannakul, T., Miyazaki, H., Maekawa, M., Kagawa, Y., Yamamoto, Y., & Owada, Y. (2025) · Scientific Reports · doi:10.1038/s41598-024-80874-5 · Cited by 2
Metal-organic framework nanomaterials alter cellular metabolism in bladder cancer
Wang, N., Song, W., Ji, J., Guo, W., & Du, Q. (2025) · Ecotoxicology and Environmental Safety · doi:10.1016/j.ecoenv.2025.118292 · Cited by 1
Xianzhen, 周. Z., Mengjie, 王. W., Jiaojiao, 张. Z., Lin, 石. S., Nan, 王. W., Dongjie, 张. Z., Zeng, Q., & Xueli, 陈. C. (2025) · Laser & Optoelectronics Progress · doi:10.3788/lop251161 · Cited by 1
Advanced Imaging for Live-Cell Spatiotemporal Monitoring: Technologies and Applications
Zhuang, Z., Feng, Z., Wang, J., Liu, X., Song, L., Sun, C., Liu, H., & Ren, N. (2025) · Research · doi:10.34133/research.1085 · Cited by 3
Raman microscopy unmixed: Technical advances, bio-orthogonal tags, and applications in life sciences
Alvarado, E., Li, Z., Li, Y., & Shi, L. (2026) · PhotoniX Life · doi:10.3724/pxlife.2025-0016 · Cited by 1
Guo, T., Wang, T. Y., Gong, E., Wang, T., Li, J., Xiang, J., Zhang, G., Han, W., Zheng, X., & Ren, L. (2026) · Analytical Chemistry · doi:10.1021/acs.analchem.6c00796 · Cited by 1
True One Cell Chemical Analysis in Cancer Research: A Review
Reyes, K., & Verbeck, G. F. (2023) · Journal of Analytical Oncology · doi:10.30683/1927-7229.2023.12.06 · Cited by 1
He, W., Wang, M., Zhong, Z., Chen, H., Xi, S., Zhang, H., Li, M., Sun, W., Zhang, Y., Wang, Y., et al. (2025) · iScience · doi:10.1016/j.isci.2025.113558 · Cited by 1
Jia, D., Li, X., & Su, Y. (2023) · Frontiers in Oncology · doi:10.3389/fonc.2023.1217212 · Cited by 1
Self-citationMass Spectrometry-Based Spatial Metabolomic Approaches to Study Health and DiseasePreprint
Wheeler, K., Gosmanov, C., Sandoval, M. J., Yang, Z., & McCall, L. (2022) · SSRN Electronic Journal · doi:10.2139/ssrn.4119540
Tan, Z. H., Zhu, C., Han, L., Liao, X., & Wang, C. (2022) · SSRN Electronic Journal · doi:10.2139/ssrn.4164534
Zhang, M., Dong, P., Eldesouky, H. E., Zhan, Y., Lin, H., Wang, Z., Salama, E. A., Jusurf, S., Zong, C., Chen, Z., et al. (2022) · bioRxiv (Cold Spring Harbor Laboratory) · doi:10.1101/2022.12.09.519679
The 2022 Emerging Leader in Molecular Spectroscopy Award
Workman, J. (2022) · Spectroscopy · doi:10.56530/spectroscopy.oc2988c1
Shen, S., Huang, B., Peng, Z., Yu, L., Ren, L., Liu, J., & Chen, G. (2024) · New Journal of Chemistry · doi:10.1039/d4nj00036f
Raman Imaging for Biomedical Applications
Marzi, J., Becker, L., & Schenke‐Layland, K. (2023) · Reference series in biomedical engineering · doi:10.1007/978-3-030-85569-7_7-1
In Situ Lipid Profiling at Submicron Resolution by Hyperspectral Stimulated Raman Imaging
Zhou, Y., Huang, X., & Lee, H. J. (2024) · doi:10.1364/cleo_at.2024.ath3b.2
Lipid profiling at submicron resolution by hyperspectral stimulated Raman imaging
Huang, X., Zhou, Y., Zhang, D., & Lee, H. J. (2025) · Advanced Chemical Microscopy for Life Science and Translational Medicine · doi:10.1117/12.3046769
Raman–gene integration provides a novel space of information to explore metabolism and gene function
Germond, A., & Kumar, V. (2025) · Elsevier eBooks · doi:10.1016/b978-0-443-21834-7.00009-8
Imaging Technology Platforms, State-of-the-art and Future Developments
Qian, C., & Andrews, D. (2025) · Royal Society of Chemistry eBooks · doi:10.1039/9781837676941-00099
Self-citationWang, Y., Wan, J., Zhang, W., & Zhong, L. (2024) · International Academic Exchange Conference on Science and Technology Innovation (IAECST) · doi:10.1109/iaecst64597.2024.11117648
Lin, L., Bi, X., Colazo, A., Wang, H., & Wei, L. (2026) · Chemical & Biomedical Imaging · doi:10.1021/cbmi.6c00011
Self-citationBond-Selective Imaging via Vibrational Relaxation Encoded Fluorescence
Abu‐Aqil, G., Dong, D., Yin, J., Ao, J., He, H., Ding, G., Xia, Q., & Cheng, J. (2025) · The Journal of Physical Chemistry Letters · doi:10.1021/acs.jpclett.5c03266
Technical Advancements in Microbial Single-Cell Omics Analysis
Takeyama, H., Hosokawa, M., Ando, M., & Nishikawa, Y. (2025) · The microbiomes of humans, animals, plants, and the environment · doi:10.1007/978-3-032-07527-7_6
Raman Spectral Signatures of Human Neutrophils: A Single‐Cell Approach
Vaňková, L., Bufka, J., Šigutová, P., Holubová, M., & Křížková, V. (2026) · Journal of Biophotonics · doi:10.1002/jbio.70251
Hao, Z., Kong, W., Zhao, W., Zheng, Y., Sun, D., Jia, H., Yao, L., & Yue, S. (2026) · Journal of Innovative Optical Health Sciences · doi:10.1142/s1793545826400134
Cholesteryl Ester as a Prognostic Biomarker In IDH-wildtype GlioblastomaPreprint
wang, N., Wang, J., Liu, J., Zou, J., Yang, B., Wang, P., Ji, N., & Yue, S. (2026) · bioRxiv (Cold Spring Harbor Laboratory) · doi:10.64898/2026.05.05.722825
Non-invasive Raman biomarkers for monitoring fentanyl-induced neurotoxicity in human microglia
Ghazanfarpour, S., Das, R. K., Pourrahimi, M., Aalinkeel, R., Sharikova, A. V., Petruccelli, J. C., Khmaladze, A. T., & Mahajan, S. D. (2026) · NeuroImmune Pharmacology and Therapeutics · doi:10.1515/nipt-2026-0007
Cheng, X., Chen, M., Li, Q., Dai, L., Liu, J., Wang, H., & Zhou, Y. (2026) · Frontiers in Immunology · doi:10.3389/fimmu.2026.1926870
Yadav, A., Pal, S., Mayur, A., Dutta, J., Verma, S. K., & Gartia, M. R. (2026) · ACS Nano Medicine · doi:10.1021/acsnanomed.6c00039
Chen, M., Wu, Y., & Zhao, M. (2026) · Frontiers in Molecular Biosciences · doi:10.3389/fmolb.2026.1948743
Kandrashina, S., Shvedov, M., & Sherstyukova, E. A. (2026) · Journal of Clinical Medicine · doi:10.3390/jcm15218222
Alcolea-Rodriguez, V., Bresci, A., Mühlig, A., Agrimi, C., Morasso, C., Polli, D., Guntinas‐Lichius, O., & Vanna, R. (2026) · Chemical Society Reviews · doi:10.1039/d6cs00966b
Metadata
- Authors
- Du, J., Su, Y., Qian, C., Yuan, D., Miao, K., Lee, D., Ng, A. H. C., Wijker, R. S., Ribas, A., Levine, R. D., Heath, J. R., & Wei, L.
- Affiliations
- California Institute of Technology (US)
- Institute for Systems Biology (US)
- University of California, Los Angeles (US)
- Corresponding author
- Heath, James R.
- Wei, Lu
- ORCID
- Venue
- Nature Communications
- Published
- 2020-09-24
- Volume
- 11
- Issue
- 1
- Pages
- 4830-4830
- ISSN
- 2041-1723 (ISSN-L)
- PMC
- PMC7518429
- OpenAlex
- W3087886129
- Cited by
- 171
- References
- 85
- Citations by year
- 2026: 18 · 2025: 34 · 2024: 32 · 2023: 44 · 2022: 28 · 2021: 14 · 2020: 1
- FWCI
- 10.35
- Type
- journal article
- Language
- en
- Open access
- gold
- doi.org
- Locations
- Nature Communications (publishedVersion, cc-by)
- PubMed Central (publishedVersion, cc-by)
- PubMed (publishedVersion)
- eScholarship (California Digital Library) (submittedVersion, cc-by)
- CaltechAUTHORS (California Institute of Technology) (submittedVersion, cc-by)
- RePEc: Research Papers in Economics (submittedVersion)
- DOAJ (DOAJ: Directory of Open Access Journals) (submittedVersion, cc-by-sa)
- eScholarship (California Digital Library) (submittedVersion)
- Funders
- California Institute of Technology (start-up)
- U.S. Department of Health & Human Services | National Institutes of Health (U01 CA217655)
- The Parker Institute for Cancer Immunotherapy, the WA State Andy Hill CARE Foundation, and an ISB Innovator Award.
- Topics
- Life Sciences › Biochemistry, Genetics and Molecular Biology › Biophysics › Spectroscopy Techniques in Biomedical and Chemical Research
- Life Sciences › Biochemistry, Genetics and Molecular Biology › Cancer Research › Cancer, Lipids, and Metabolism
- Life Sciences › Biochemistry, Genetics and Molecular Biology › Molecular Biology › Metabolomics and Mass Spectrometry Studies
- Keywords
- metastatic melanoma, Raman spectroscopy, stimulated Raman scattering microscopy, single-cell metabolomics, fatty acid synthesis, lipid droplets, BRAF inhibitor resistance, dedifferentiation, lipidomics, transcriptomics, membrane phase separation, apoptosis
- MeSH terms
- Lipidomics, Fatty Acids, Humans, Lipids, Melanoma, Microscopy, Spectrum Analysis, Raman, Stearoyl-CoA Desaturase, Apoptosis, Oleic Acid, Cell Line, Tumor, Lipid Metabolism, Metabolomics, Transcriptome, Lipid Droplets
About these checks
Registry, retraction, Cites and statistics results are computed, not judged, with one exception: a printed reference that no index lists is read once by a model before it counts as a citation error. Claims are extracted by a model and kept only when their quote appears verbatim in the text; each cited source is then checked, with a model’s help, for whether it says what the claim relies on. Those verdicts can be wrong — read the claim’s quote and the cited source before relying on one.
Statistics and arithmetic are recomputed, not judged.
Confidence bands are shown only for fields calibrated on our annotated test set. None is calibrated yet, so no band is shown.
What counts as a claim ›How we measure confidence ›How we check this ›
Are you an author, or do you see a problem with this page? Request a review
