Cited by 77

The DOI matches its Crossref record; 5 of the 5 references it cites were found in a registry or an index.

Telomere dysfunction activates YAP1 to drive tissue inflammation

Chakravarti, Deepavali, Hu, Baoli, Mao, Xizeng, Rashid, Asif, Li, Jiexi, Li, Jun, Liao, Wen-ting, Whitley, Elizabeth M., Dey, Prasenjit, Hou, Pingping, LaBella, Kyle A., Chang, Andrew, Wang, Guocan, Spring, Denise J., Deng, Pingna, Zhao, Di, Liang, Xin, Lan, Zhengdao, Lin, Yiyun, Sarkar, Sharmistha, Terranova, Christopher, Deribe, Yonathan Lissanu, Blutt, Sarah E., Okhuysen, Pablo, Zhang, Jianhua, Vilar, Eduardo, Nielsen, Ole Haagen, Dupont, Andrew, Younes, Mamoun, Patel, Kalyani R., Shroyer, Noah F., Rai, Kunal, Estes, Mary K., Wang, Y. Alan, Bertuch, Alison A., DePinho, Ronald A.·2020·Nature Communications

Abstract

Germline telomere maintenance defects are associated with an increased incidence of inflammatory diseases in humans, yet whether and how telomere dysfunction causes inflammation are not known. Here, we show that telomere dysfunction drives pATM/c-ABL-mediated activation of the YAP1 transcription factor, up-regulating the major pro-inflammatory factor, pro-IL-18. The colonic microbiome stimulates cytosolic receptors activating caspase-1 which cleaves pro-IL-18 into mature IL-18, leading to recruitment of interferon (IFN)-γ-secreting T cells and intestinal inflammation. Correspondingly, patients with germline telomere maintenance defects exhibit DNA damage (γH2AX) signaling together with elevated YAP1 and IL-18 expression. In mice with telomere dysfunction, telomerase reactivation in the intestinal epithelium or pharmacological inhibition of ATM, YAP1, or caspase-1 as well as antibiotic treatment, dramatically reduces IL-18 and intestinal inflammation. Thus, telomere dysfunction-induced activation of the ATM-YAP1-pro-IL-18 pathway in epithelium is a key instigator of tissue inflammation.

Overview

The claims and statistics of this paper haven’t been checked yet.

Run the check — free, no account needed. It reads the open-access text and checks the sources it cites.

A few free checks a day · papers already verified open instantly · results are public

Integrity signals

Registry

Crossref · 10.1038/s41467-020-18420-w

Cites

5 of 5 references verified0 citation errors · 0 not checkable

Statistics

Figures

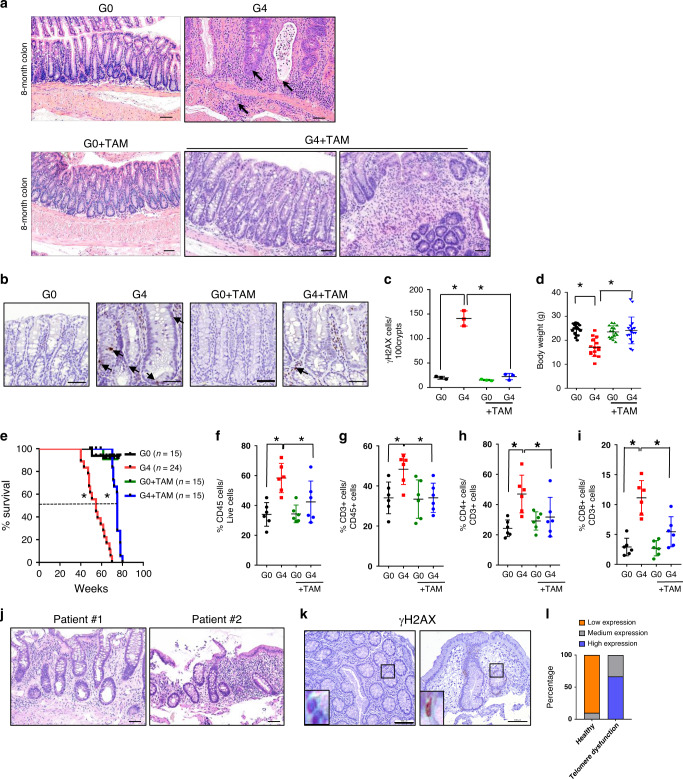
Fig. 1 Telomere dysfunction in the gut epithelia drives inflammation. a Hematoxylin and eosin staining of colon tissue from 8-month old G0 and G4 mice treated with and without tamoxifen (n = 15), scale bar 100 µm. Arrows indicate cryptitis, crypt abscess and submucosal inflammation. b Immunohistochemical staining for γH2AX (arrows) in the colon of mice at 8-month old G0 and G4 mice treated with and without tamoxifen (n = 3), scale bar 50 µm. c Quantification of the γH2AX stained cells in 100 colonic crypts from G0 and G4 mice treated with and without tamoxifen (n = 3). P values were calculated using two sided t test between G0 and G4 (p < 0.0002), between G4 and G4 + TAM (p < 0.0003). d Change in body weight (g) at time of death of telomere proficient G0 and telomere deficient G4 mice treated with and without tamoxifen (G0, n = 18, G4, n = 15, G0 = TAM, n = 16, G4 + TAM, n = 17). P values were calculated using two sided t test between G0 and G4 (p = <0.0001), between G4 and G4 + TAM (p < 0.0003). e Survival curves of mice of the indicated genotypes treated with or without tamoxifen. Dotted line indicates 50% survival of G4 mice (54.6 weeks) and G4 + TAM mice (75 weeks) (G0 mice, n = 15; G4, n = 24; G0 + TAM, n = 15; G4 + TAM, n = 15). P values were calculated using Mantel-cox test, between G0 and G4 (p < 0.0001) and between G4 and G4 + TAM (p < 0.0001). f–i Percentage of lamina propria and intestinal epithelial immune cells present in the colon of the mice of the indicated genotypes treated with or without tamoxifen (n = 6). P values were calculated using two sided t test between G0 and G4, G4 and G4 + TAM. f CD45, p value between G0 and G4, p = 0.0008, between G4 and G4 = TAM, p = 0.0451. g CD3, p value between G0 and G4, p = 0.0097, between G4 and G4 + TAM, p = 0.0079. h CD4, p value between G0 and G4, p = 0.0022, between G4 and G4 + TAM, p = 0.0551. i CD8, p value between G0 and G4, p < 0.0001, between G4 and G4 + TAM, p = 0.0045. j Hematoxylin and eosin staining of colonic biopsies from patients with mutations in TERT or proteins of the shelterin complex, TIN2 (n = 3). Colonic biopsies from two patients show cryptitis, increased apoptosis, increased chronic inflammation in the lamina propria, and mild crypt distortion. k Immunohistochemistry with the colonic epithelium from healthy pediatric patients/(controls) and patients with telomeropathies for γH2AX (Control, n = 10; telomere dysfunctional patients, n = 3). l Histogram depicting the quantification of staining intensity for γH2AX in the colonic epithelium of healthy (control) and telomere dysfunctional patients. γH2AX, p = 0.0001. P values were calculated using Fisher’s exact test. *statistically significant, p < 0.05 by unpaired Student’s t test, two tailed. n, number of mice or patient biopsies used in the study. Data are represented as mean ± SEM. Experiments were conducted at least two independent times. Also refer to Supplementary Fig. 1, Supplementary Fig. 2, and Supplementary Fig. 3 and Supplementary Table 1 and 2.
Fig. 1 Telomere dysfunction in the gut epithelia drives inflammation. a Hematoxylin and eosin staining of colon tissue from 8-month old G0 and G4 mice treated with and without tamoxifen (n = 15), scale bar 100 µm. Arrows indicate cryptitis, crypt abscess and submucosal inflammation. b Immunohistochemical staining for γH2AX (arrows) in the colon of mice at 8-month old G0 and G4 mice treated with and without tamoxifen (n = 3), scale bar 50 µm. c Quantification of the γH2AX stained cells in 100 colonic crypts from G0 and G4 mice treated with and without tamoxifen (n = 3). P values were calculated using two sided t test between G0 and G4 (p < 0.0002), between G4 and G4 + TAM (p < 0.0003). d Change in body weight (g) at time of death of telomere proficient G0 and telomere deficient G4 mice treated with and without tamoxifen (G0, n = 18, G4, n = 15, G0 = TAM, n = 16, G4 + TAM, n = 17). P values were calculated using two sided t test between G0 and G4 (p = <0.0001), between G4 and G4 + TAM (p < 0.0003). e Survival curves of mice of the indicated genotypes treated with or without tamoxifen. Dotted line indicates 50% survival of G4 mice (54.6 weeks) and G4 + TAM mice (75 weeks) (G0 mice, n = 15; G4, n = 24; G0 + TAM, n = 15; G4 + TAM, n = 15). P values were calculated using Mantel-cox test, between G0 and G4 (p < 0.0001) and between G4 and G4 + TAM (p < 0.0001). f–i Percentage of lamina propria and intestinal epithelial immune cells present in the colon of the mice of the indicated genotypes treated with or without tamoxifen (n = 6). P values were calculated using two sided t test between G0 and G4, G4 and G4 + TAM. f CD45, p value between G0 and G4, p = 0.0008, between G4 and G4 = TAM, p = 0.0451. g CD3, p value between G0 and G4, p = 0.0097, between G4 and G4 + TAM, p = 0.0079. h CD4, p value between G0 and G4, p = 0.0022, between G4 and G4 + TAM, p = 0.0551. i CD8, p value between G0 and G4, p < 0.0001, between G4 and G4 + TAM, p = 0.0045. j Hematoxylin and eosin staining of colonic biopsies from patients with mutations in TERT or proteins of the shelterin complex, TIN2 (n = 3). Colonic biopsies from two patients show cryptitis, increased apoptosis, increased chronic inflammation in the lamina propria, and mild crypt distortion. k Immunohistochemistry with the colonic epithelium from healthy pediatric patients/(controls) and patients with telomeropathies for γH2AX (Control, n = 10; telomere dysfunctional patients, n = 3). l Histogram depicting the quantification of staining intensity for γH2AX in the colonic epithelium of healthy (control) and telomere dysfunctional patients. γH2AX, p = 0.0001. P values were calculated using Fisher’s exact test. *statistically significant, p < 0.05 by unpaired Student’s t test, two tailed. n, number of mice or patient biopsies used in the study. Data are represented as mean ± SEM. Experiments were conducted at least two independent times. Also refer to Supplementary Fig. 1, Supplementary Fig. 2, and Supplementary Fig. 3 and Supplementary Table 1 and 2.CC BY · PubMed Central
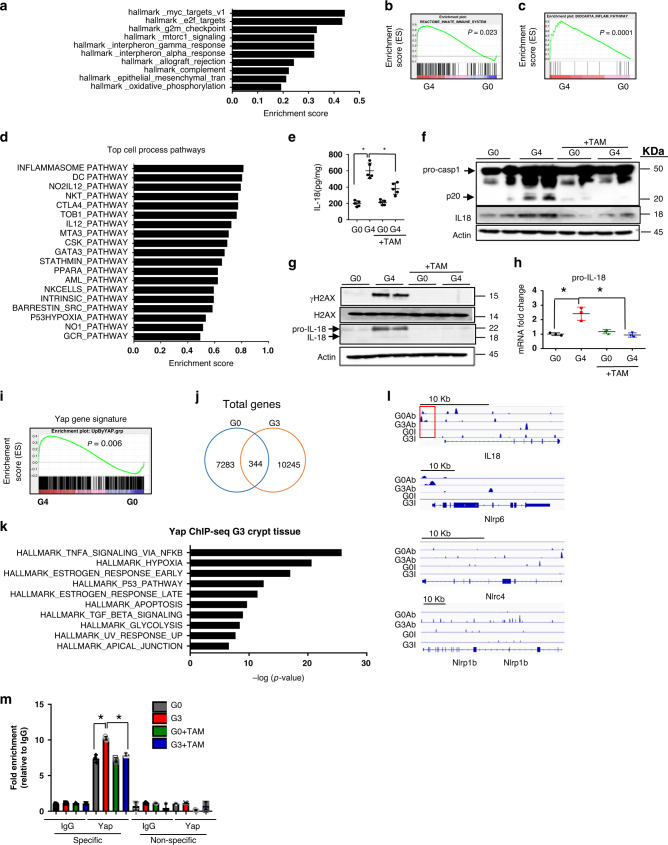
Fig. 2 Identification of YAP1 as a key regulator of immune pathways including IL-18. a RNA-seq analysis and pathway analysis of colonic crypts from G0 and G4 mice identified several inflammation-related pathways (n = 2). b Gene set enrichment analysis curve from the RNA-seq analysis in panel (a) depicting the innate immune system pathway with a significant p value of 0.02. (n = 2). c Gene set enrichment analysis curve depicting the inflammasome pathway that was identified as the topmost deregulated pathway by RNA-seq from the GFP+ sorted colonic epithelial cells of G0 and G4 mice (n = 3). d Top cell process pathways identified by GSEA analysis from the GFP+ colonic sorted cells of G0 and G4 mice. (n = 2). e ELISA for IL-18 with the colonic lysates from the mice of the indicated genotypes (n = 5). P values were calculated using two sided t test between G0 and G4, G4 and G4 + TAM. P value between G0 and G4, p < 0.0001, between G4 and G4 + TAM, p = 0.0031. f Immunoblotting with caspase-1 and IL18 antibody of colonic epithelial lysates from G0 and G4 mice treated with or without tamoxifen (n = 2). g Immunoblotting of enteroid lysates from G0 and G4 mice treated with or without tamoxifen with the indicated antibodies (n = 2). h qRT-PCR analysis of the inflammasome pathway genes from enteroids derived from the G0 and G4 mice treated with or without tamoxifen, pro-IL-18 (n = 3). P values were calculated using two sided t test between G0 and G4, G4 and G4 + TAM. P value between G0 and G4, p = 0.0067, between G4 and G4 + TAM, p = 0.0063. i GSEA plot showing an enrichment of Yap1 gene signature in the G4 epithelium compared to the G0 epithelium (p = 0.006). j Overlap of genes identified with YAP1 antibody in G0 and G3 crypt epithelium. k Gene enrichment analysis for the differentially bound genes by YAP1 in the G3 epithelium (n = 4). l ChIP-seq data showing increased YAP1 occupancy at the promoters and the gene body of the inflammasome pathway genes in G3 telomere dysfunctional epithelium compared to the G0 telomere proficient epithelium. m Chromatin immunoprecipitation for YAP1 or IgG in the G0 and G3 enteroids treated with or without tamoxifen. qRT-PCR for the indicated genes was performed with primers directed towards the specific site boxed in red and a non-specific site 1Kb away from the YAP1 binding site. (n = 3). P values were calculated using two sided t test between G0 and G4, G4 and G4 + TAM. P value between G0 and G4, p = 0.0013, between G4 and G4 + TAM, p = 0.0003. *statistically significant, p < 0.05 by unpaired Student’s t test, two-tailed and Fisher’s Exact Test. n, number of mice used in the study. Data are represented as mean ± SEM. Experiments were conducted at least two independent times. Also refer to Supplementary Fig. 2.
Fig. 2 Identification of YAP1 as a key regulator of immune pathways including IL-18. a RNA-seq analysis and pathway analysis of colonic crypts from G0 and G4 mice identified several inflammation-related pathways (n = 2). b Gene set enrichment analysis curve from the RNA-seq analysis in panel (a) depicting the innate immune system pathway with a significant p value of 0.02. (n = 2). c Gene set enrichment analysis curve depicting the inflammasome pathway that was identified as the topmost deregulated pathway by RNA-seq from the GFP+ sorted colonic epithelial cells of G0 and G4 mice (n = 3). d Top cell process pathways identified by GSEA analysis from the GFP+ colonic sorted cells of G0 and G4 mice. (n = 2). e ELISA for IL-18 with the colonic lysates from the mice of the indicated genotypes (n = 5). P values were calculated using two sided t test between G0 and G4, G4 and G4 + TAM. P value between G0 and G4, p < 0.0001, between G4 and G4 + TAM, p = 0.0031. f Immunoblotting with caspase-1 and IL18 antibody of colonic epithelial lysates from G0 and G4 mice treated with or without tamoxifen (n = 2). g Immunoblotting of enteroid lysates from G0 and G4 mice treated with or without tamoxifen with the indicated antibodies (n = 2). h qRT-PCR analysis of the inflammasome pathway genes from enteroids derived from the G0 and G4 mice treated with or without tamoxifen, pro-IL-18 (n = 3). P values were calculated using two sided t test between G0 and G4, G4 and G4 + TAM. P value between G0 and G4, p = 0.0067, between G4 and G4 + TAM, p = 0.0063. i GSEA plot showing an enrichment of Yap1 gene signature in the G4 epithelium compared to the G0 epithelium (p = 0.006). j Overlap of genes identified with YAP1 antibody in G0 and G3 crypt epithelium. k Gene enrichment analysis for the differentially bound genes by YAP1 in the G3 epithelium (n = 4). l ChIP-seq data showing increased YAP1 occupancy at the promoters and the gene body of the inflammasome pathway genes in G3 telomere dysfunctional epithelium compared to the G0 telomere proficient epithelium. m Chromatin immunoprecipitation for YAP1 or IgG in the G0 and G3 enteroids treated with or without tamoxifen. qRT-PCR for the indicated genes was performed with primers directed towards the specific site boxed in red and a non-specific site 1Kb away from the YAP1 binding site. (n = 3). P values were calculated using two sided t test between G0 and G4, G4 and G4 + TAM. P value between G0 and G4, p = 0.0013, between G4 and G4 + TAM, p = 0.0003. *statistically significant, p < 0.05 by unpaired Student’s t test, two-tailed and Fisher’s Exact Test. n, number of mice used in the study. Data are represented as mean ± SEM. Experiments were conducted at least two independent times. Also refer to Supplementary Fig. 2.CC BY · PubMed Central
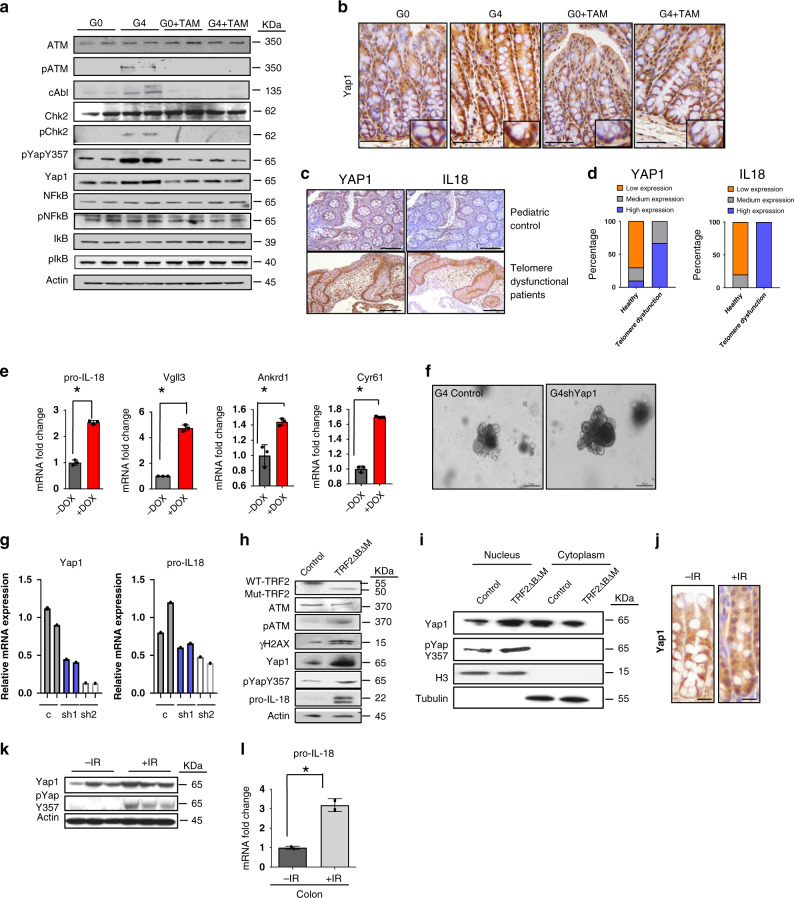
Fig. 3 Telomere dysfunction activates YAP1. a Immunoblotting of intestinal enteroid lysate from G0 and G4 mice treated with or without tamoxifen for the indicated antibodies (n = 2). b Immunohistochemistry for YAP1 in the colonic crypts from the G0 and G4 mice treated with or without tamoxifen (n = 3). Scale bars, 50 µm. Insets are shown to illustrate the higher nuclear localization of YAP1 in the G4 mice than in others. c Immunohistochemistry with the colonic epithelium from healthy pediatric patients(control) and patients with telomeropathies for YAP1 and IL-18. (Control, n = 10; telomere dysfunctional patients, n = 3) d Histogram depicting the quantification of staining intensity for YAP1 and IL-18 in the colonic epithelium of healthy (control) and telomere dysfunctional patients. YAP1, p = 0.0035 IL-18, p = 0.0001. (Control, n = 10; telomere dysfunctional patients, n = 3). e qRT-PCR for the indicated genes from enteroids isolated from the YAP1(S127A) transgenic mouse treated with or without doxycycline to inhibit degradation and increase stabilization and nuclear localization (n = 3). P values were calculated using two sided t test between dox untreated and dox treated organoids. The following are the p-values for pro-Il18, p < .0001, Vgll3, p = 0.0067, Cyr61, p < 0.0001. f Microscopic images of the enteroids from a control vector transduced or YAP1 shRNAs transduced enteroids (n = 2). Scale bars, 30 µm. g qRT-PCR for the indicated genes from G4 enteroids transduced with either a control or YAP1 shRNAs (n = 2). Histogram shown with individual bar for each sample. h Western blot for the indicated proteins in CRL-1831 cells overexpressing TRF2ΔBΔM plasmid or control vector 1-day post selection with puromycin. i Cell fractionation performed with CRL-1831 cells overexpressing TRF2ΔBΔM plasmid or control vector 1-day post selection with puromycin. j Immunohistochemistry for YAP1 in irradiated or control G0 colon crypts showing higher nuclear positive staining for YAP1 after irradiation. Scale bars, 50 μm. k Western blot for the YAP1 and pYAPY357 phosphorylated proteins in irradiated or control G0 colon crypts showing higher levels of phosphorylation after irradiation (n = 3). l qRT-PCR of RNA from control or irradiated colonic G0 mouse crypts for pro-IL-18 (n = 3). P values were calculated using two sided t test, p = 0.0122. *statistically significant, p < 0.05 by unpaired Student’s t test, two-tailed and Fisher’s Exact Test. n represents number of mice used in the study. “Ab” denotes antibody and “I” denotes Input samples. Each experiment was conducted at least two times. Data are represented as mean ± SEM. Also refer to Supplementary Fig. 3.
Fig. 3 Telomere dysfunction activates YAP1. a Immunoblotting of intestinal enteroid lysate from G0 and G4 mice treated with or without tamoxifen for the indicated antibodies (n = 2). b Immunohistochemistry for YAP1 in the colonic crypts from the G0 and G4 mice treated with or without tamoxifen (n = 3). Scale bars, 50 µm. Insets are shown to illustrate the higher nuclear localization of YAP1 in the G4 mice than in others. c Immunohistochemistry with the colonic epithelium from healthy pediatric patients(control) and patients with telomeropathies for YAP1 and IL-18. (Control, n = 10; telomere dysfunctional patients, n = 3) d Histogram depicting the quantification of staining intensity for YAP1 and IL-18 in the colonic epithelium of healthy (control) and telomere dysfunctional patients. YAP1, p = 0.0035 IL-18, p = 0.0001. (Control, n = 10; telomere dysfunctional patients, n = 3). e qRT-PCR for the indicated genes from enteroids isolated from the YAP1(S127A) transgenic mouse treated with or without doxycycline to inhibit degradation and increase stabilization and nuclear localization (n = 3). P values were calculated using two sided t test between dox untreated and dox treated organoids. The following are the p-values for pro-Il18, p < .0001, Vgll3, p = 0.0067, Cyr61, p < 0.0001. f Microscopic images of the enteroids from a control vector transduced or YAP1 shRNAs transduced enteroids (n = 2). Scale bars, 30 µm. g qRT-PCR for the indicated genes from G4 enteroids transduced with either a control or YAP1 shRNAs (n = 2). Histogram shown with individual bar for each sample. h Western blot for the indicated proteins in CRL-1831 cells overexpressing TRF2ΔBΔM plasmid or control vector 1-day post selection with puromycin. i Cell fractionation performed with CRL-1831 cells overexpressing TRF2ΔBΔM plasmid or control vector 1-day post selection with puromycin. j Immunohistochemistry for YAP1 in irradiated or control G0 colon crypts showing higher nuclear positive staining for YAP1 after irradiation. Scale bars, 50 μm. k Western blot for the YAP1 and pYAPY357 phosphorylated proteins in irradiated or control G0 colon crypts showing higher levels of phosphorylation after irradiation (n = 3). l qRT-PCR of RNA from control or irradiated colonic G0 mouse crypts for pro-IL-18 (n = 3). P values were calculated using two sided t test, p = 0.0122. *statistically significant, p < 0.05 by unpaired Student’s t test, two-tailed and Fisher’s Exact Test. n represents number of mice used in the study. “Ab” denotes antibody and “I” denotes Input samples. Each experiment was conducted at least two times. Data are represented as mean ± SEM. Also refer to Supplementary Fig. 3.CC BY · PubMed Central
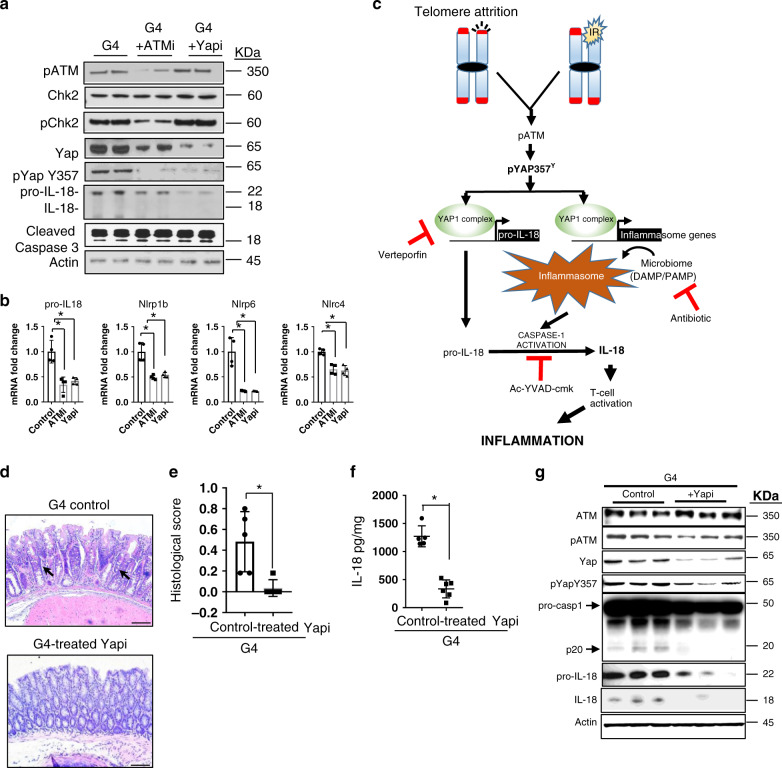
Fig. 4 Inhibition of ATM and YAP1 reduces IL-18 secretion and ameliorates inflammation. a Immunoblots of intestinal enteroid lysate from G4 enteroids treated with or without ATM or YAP1 inhibitors for the indicated antibodies (n = 2). b qRT-PCR for the indicated genes with RNA from enteroids treated with DMSO only or inhibitors for ATM or YAP1 (n = 4). P values were calculated using two sided t test. The following are the p-values, pro-IL18, p = 0.0030, Nlrp1b, p = 0.0018, Nlrp6, p = 0.0015, Nlrc4, p = 0.0010. c Model representing the telomere dysfunction-mediated inflammasome pathway and the nodes at which the inhibitors for YAP1, caspase-1 or antibiotics inhibit the pathway leading to reduced secretion cleavage of caspase-1 and secretion of IL-18 by the colonic epithelium. d Hematoxylin and eosin staining of colon tissue from G4 mice treated with or without the YAP inhibitor, verteporfin. (control, n = 5; inhibitor treated, n = 6). Scale bars, 50 μm. e Histopathological score of the intestinal phenotype of the G4 mice treated with or without verteporfin (Yapi) (control, n = 5; inhibitor treated, n = 6). P values were calculated using two sided t test, p = 0.0048. f ELISA for the quantification of mature IL-18 from the colonic epithelium of the G4 mice treated with or without verteporfin (Yapi) (control, n = 5; inhibitor treated, n = 6).P values were calculated using two sided t test, p < 0.0001. g Western blot of colonic lysate from the colonic epithelium of the G4 mice treated with or without verteporfin (Yapi), for the indicated antibodies (n = 3). *statistically significant, p < 0.05 by unpaired Student’s t test, two-tailed. n represents number of mice used in the study. Data are represented as mean ± SEM. Experiments were conducted at least two independent times.
Fig. 4 Inhibition of ATM and YAP1 reduces IL-18 secretion and ameliorates inflammation. a Immunoblots of intestinal enteroid lysate from G4 enteroids treated with or without ATM or YAP1 inhibitors for the indicated antibodies (n = 2). b qRT-PCR for the indicated genes with RNA from enteroids treated with DMSO only or inhibitors for ATM or YAP1 (n = 4). P values were calculated using two sided t test. The following are the p-values, pro-IL18, p = 0.0030, Nlrp1b, p = 0.0018, Nlrp6, p = 0.0015, Nlrc4, p = 0.0010. c Model representing the telomere dysfunction-mediated inflammasome pathway and the nodes at which the inhibitors for YAP1, caspase-1 or antibiotics inhibit the pathway leading to reduced secretion cleavage of caspase-1 and secretion of IL-18 by the colonic epithelium. d Hematoxylin and eosin staining of colon tissue from G4 mice treated with or without the YAP inhibitor, verteporfin. (control, n = 5; inhibitor treated, n = 6). Scale bars, 50 μm. e Histopathological score of the intestinal phenotype of the G4 mice treated with or without verteporfin (Yapi) (control, n = 5; inhibitor treated, n = 6). P values were calculated using two sided t test, p = 0.0048. f ELISA for the quantification of mature IL-18 from the colonic epithelium of the G4 mice treated with or without verteporfin (Yapi) (control, n = 5; inhibitor treated, n = 6).P values were calculated using two sided t test, p < 0.0001. g Western blot of colonic lysate from the colonic epithelium of the G4 mice treated with or without verteporfin (Yapi), for the indicated antibodies (n = 3). *statistically significant, p < 0.05 by unpaired Student’s t test, two-tailed. n represents number of mice used in the study. Data are represented as mean ± SEM. Experiments were conducted at least two independent times.CC BY · PubMed Central

Verification

Claims the paper makes

The claims and statistics of this paper haven’t been checked yet.

Run the check — free, no account needed. It reads the open-access text and checks the sources it cites.

A few free checks a day · papers already verified open instantly · results are public

Claims other papers make about this one

Each is checked against this paper’s own text: does it say what the citing paper says it does?

Self-check

Percentages, sums and reported differences re-computed from the paper’s own numbers.

The self-check needs the paper’s full text.

Citations

Cites

Research works printed but not linked: 42

  1. Griffith, J. D. et al. Mammalian telomeres end in a large duplex loop. Cell 97, 503–514 (1999). · DOI · Paper page
  2. Autexier, C. & Greider, C. W. Telomerase and cancer: revisiting the telomere hypothesis. Trends Biochem. Sci. 21, 387–391 (1996). · DOI
  3. Armanios, M. Syndromes of telomere shortening. Annu. Rev. Genomics Hum. Genet. 10, 45–61 (2009). · DOI · Paper page
  4. Calado, R. T. et al. Constitutional telomerase mutations are genetic risk factors for cirrhosis. Hepatology 53, 1600–1607 (2011). · DOI
  5. Savage, S. A. & Bertuch, A. A. The genetics and clinical manifestations of telomere biology disorders. Genet. Med. 12, 753–764 (2010). · DOI
  6. Jonassaint, N. L., Guo, N., Califano, J. A., Montgomery, E. A. & Armanios, M. The gastrointestinal manifestations of telomere-mediated disease. Aging Cell 12, 319–323 (2013). · DOI
  7. Risques, R. A. et al. Ulcerative colitis-associated colorectal cancer arises in a field of short telomeres, senescence, and inflammation. Cancer Res. 71, 1669–1679 (2011). · DOI
  8. Risques, R. A. et al. Ulcerative colitis is a disease of accelerated colon aging: evidence from telomere attrition and DNA damage. Gastroenterology 135, 410–418 (2008). · DOI
  9. Thorsteinsdottir, S., Gudjonsson, T., Nielsen, O. H., Vainer, B. & Seidelin, J. B. Pathogenesis and biomarkers of carcinogenesis in ulcerative colitis. Nat. Rev. Gastroenterol. Hepatol. 8, 395–404 (2011). · DOI
  10. Nassour, J. et al. Autophagic cell death restricts chromosomal instability during replicative crisis. Nature 565, 659–663 (2019). · DOI · Paper page
  11. Eri, R., McGuckin, M. A. & Wadley, R. T cell transfer model of colitis: a great tool to assess the contribution of T cells in chronic intestinal inflammation. Methods Mol. Biol. 844, 261–275 (2012). · DOI
  12. Lamkanfi, M. & Dixit, V. M. Mechanisms and functions of inflammasomes. Cell 157, 1013–1022 (2014). · DOI
  13. Christgen, S. & Kanneganti, T. D. Inflammasomes and the fine line between defense and disease. Curr. Opin. Immunol. 62, 39–44 (2019). · DOI
  14. Bianco, A. M., Girardelli, M. & Tommasini, A. Genetics of inflammatory bowel disease from multifactorial to monogenic forms. World J. Gastroenterol. 21, 12296–12310 (2015). · DOI
  15. Davis, B. K. et al. Emerging significance of NLRs in inflammatory bowel disease. Inflamm. Bowel Dis. 20, 2412–2432 (2014). · DOI
  16. Pizarro, T. T. et al. IL-18, a novel immunoregulatory cytokine, is up-regulated in Crohn’s disease: expression and localization in intestinal mucosal cells. J. Immunol. 162, 6829–6835 (1999). · DOI
  17. Tamura, K. et al. IL18 polymorphism is associated with an increased risk of Crohn’s disease. J. Gastroenterol. 37, 111–116 (2002). · DOI
  18. Villani, A. C. et al. Common variants in the NLRP3 region contribute to Crohn’s disease susceptibility. Nat. Genet. 41, 71–76 (2009). · DOI
  19. Zhernakova, A. et al. Genetic analysis of innate immunity in Crohn’s disease and ulcerative colitis identifies two susceptibility loci harboring CARD9 and IL18RAP. Am. J. Hum. Genet. 82, 1202–1210 (2008). · DOI
  20. Harrison, O. J. et al. Epithelial-derived IL-18 regulates Th17 cell differentiation and Foxp3(+) Treg cell function in the intestine. Mucosal Immunol. 8, 1226–1236 (2015). · DOI
  21. Nowarski, R. et al. Epithelial IL-18 equilibrium controls barrier function in colitis. Cell 163, 1444–1456 (2015). · DOI
  22. Smillie, C. S. et al. Intra- and Inter-cellular rewiring of the human colon during ulcerative colitis. Cell 178, 714–730 e22 (2019). · DOI
  23. Levy, D., Adamovich, Y., Reuven, N. & Shaul, Y. Yap1 phosphorylation by c-Abl is a critical step in selective activation of proapoptotic genes in response to DNA damage. Mol. Cell 29, 350–361 (2008). · DOI
  24. Shafman, T. et al. Interaction between ATM protein and c-Abl in response to DNA damage. Nature 387, 520–523 (1997). · DOI
  25. Gregorieff, A., Liu, Y., Inanlou, M. R., Khomchuk, Y. & Wrana, J. L. Yap-dependent reprogramming of Lgr5(+) stem cells drives intestinal regeneration and cancer. Nature 526, 715–718 (2015). · DOI
  26. Camargo, F. D. et al. YAP1 increases organ size and expands undifferentiated progenitor cells. Curr. Biol. 17, 2054–2060 (2007). · DOI · Paper page
  27. Akita, K. et al. Involvement of caspase-1 and caspase-3 in the production and processing of mature human interleukin 18 in monocytic THP.1 cells. J. Biol. Chem. 272, 26595–26603 (1997). · DOI
  28. Zhang, F. et al. The caspase-1 inhibitor AC-YVAD-CMK attenuates acute gastric injury in mice: involvement of silencing NLRP3 inflammasome activities. Sci. Rep. 6, 24166 (2016).
  29. Donaldson, G. P., Lee, S. M. & Mazmanian, S. K. Gut biogeography of the bacterial microbiota. Nat. Rev. Microbiol. 14, 20–32 (2016). · DOI · Paper page
  30. Thadepalli, H., Lou, M. A., Bach, V. T., Matsui, T. K. & Mandal, A. K. Microflora of the human small-intestine. Am. J. Surg. 138, 845–850 (1979). · DOI
  31. Tahara, T. et al. Telomere length in non-neoplastic colonic mucosa in ulcerative colitis (UC) and its relationship to the severe clinical phenotypes. Clin. Exp. Med. 15, 327–332 (2015). · DOI
  32. Krtolica, A., Parrinello, S., Lockett, S., Desprez, P. Y. & Campisi, J. Senescent fibroblasts promote epithelial cell growth and tumorigenesis: a link between cancer and aging. Proc. Natl Acad. Sci. USA 98, 12072–12077 (2001). · DOI · Paper page
  33. Liu, J. Z. et al. Association analyses identify 38 susceptibility loci for inflammatory bowel disease and highlight shared genetic risk across populations. Nat. Genet. 47, 979–986 (2015). · DOI · Paper page
  34. Taniguchi, K. et al. A gp130-Src-YAP module links inflammation to epithelial regeneration. Nature 519, 57–62 (2015). · DOI · Paper page
  35. Barker, N. et al. Identification of stem cells in small intestine and colon by marker gene Lgr5. Nature 449, 1003–1007 (2007). · DOI · Paper page
  36. Su, X. et al. TAp63 suppresses metastasis through coordinate regulation of Dicer and miRNAs. Nature 467, 986–990 (2010). · DOI
  37. Geem, D., Medina-Contreras, O., Kim, W., Huang, C. S. & Denning, T. L. Isolation and characterization of dendritic cells and macrophages from the mouse intestine. J. Vis. Exp. 63, e4040 (2012). · DOI
  38. Sato, T. et al. Single Lgr5 stem cells build crypt-villus structures in vitro without a mesenchymal niche. Nature 459, 262–265 (2009). · DOI · Paper page
  39. Terranova, C. et al. An integrated platform for genome-wide mapping of chromatin states using high-throughput ChIP-sequencing in tumor tissues. J. Vis. Exp. https://doi.org/10.3791/56972 (2018). · DOI
  40. Langmead, B., Trapnell, C., Pop, M. & Salzberg, S. L. Ultrafast and memory-efficient alignment of short DNA sequences to the human genome. Genome Biol. 10, R25 (2009).
  41. Li, H. et al. The sequence alignment/map format and SAMtools. Bioinformatics 25, 2078–2079 (2009). · DOI · Paper page
  42. Zhang, Y. et al. Model-based analysis of ChIP-Seq (MACS). Genome Biol. 9, R137 (2008).

Cited by

Sorted by citations

See all 77

Metadata

Authors
Chakravarti, D., Hu, B., Mao, X., Rashid, A., Li, J., Li, J., Liao, W.-T., Whitley, E. M., Dey, P., Hou, P., LaBella, K. A., Chang, A., Wang, G., Spring, D. J., Deng, P., Zhao, D., Liang, X., Lan, Z., Lin, Y., Sarkar, S., Terranova, C., Deribe, Y. L., Blutt, S. E., Okhuysen, P., Zhang, J., Vilar, E., Nielsen, O. H., Dupont, A., Younes, M., Patel, K. R., Shroyer, N. F., Rai, K., Estes, M. K., Wang, Y. A., Bertuch, A. A., & DePinho, R. A.
Venue
Nature Communications
Published
2020-09-21
Volume
11
Issue
1
ISSN
2041-1723
Cited by
77
References
5
Language
en
Funders
U.S. Department of Health & Human Services | National Institutes of Health (K99 CA218891, R01 CA084628)

About these checks

Registry, retraction, Cites and statistics results are computed, not judged, with one exception: a printed reference that no index lists is read once by a model before it counts as a citation error. Claims are extracted by a model and kept only when their quote appears verbatim in the text; each cited source is then checked, with a model’s help, for whether it says what the claim relies on. Those verdicts can be wrong — read the claim’s quote and the cited source before relying on one.

Statistics and arithmetic are recomputed, not judged.

Confidence bands are shown only for fields calibrated on our annotated test set. None is calibrated yet, so no band is shown.

What counts as a claim ›How we measure confidence ›How we check this ›

Are you an author, or do you see a problem with this page? Request a review