

The DOI matches its Crossref record; 158 of the 158 references it cites were found in a registry or an index.
Deep learning suggests that gene expression is encoded in all parts of a co-evolving interacting gene regulatory structure
Open accessPublished version of a preprint
Abstract
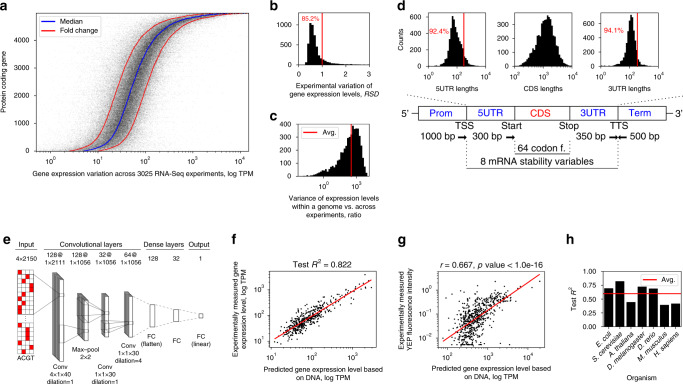
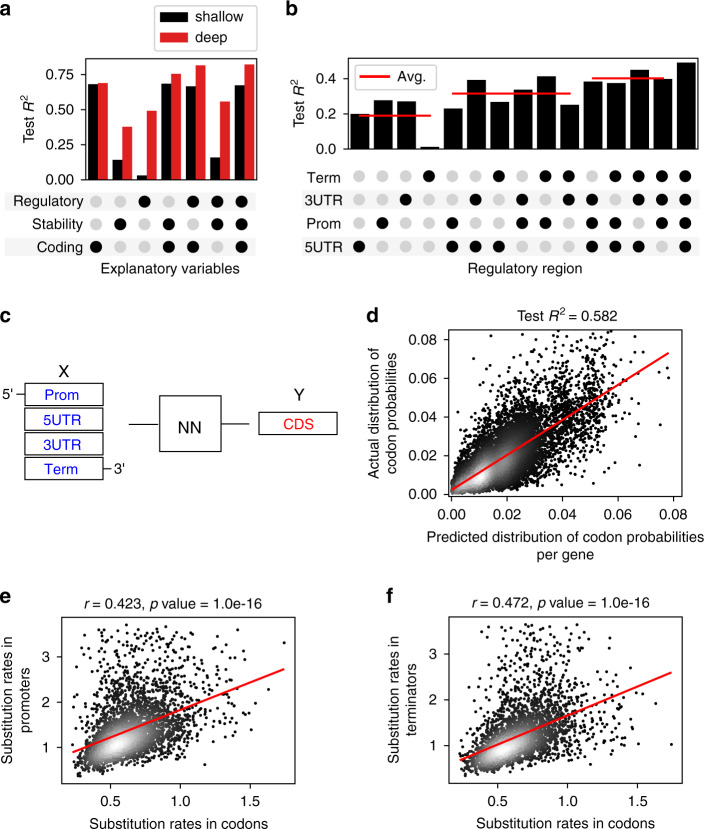
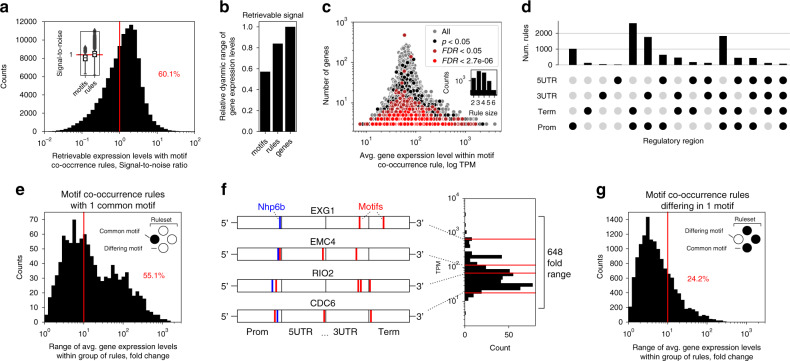
Abstract Understanding the genetic regulatory code governing gene expression is an important challenge in molecular biology. However, how individual coding and non-coding regions of the gene regulatory structure interact and contribute to mRNA expression levels remains unclear. Here we apply deep learning on over 20,000 mRNA datasets to examine the genetic regulatory code controlling mRNA abundance in 7 model organisms ranging from bacteria to Human. In all organisms, we can predict mRNA abundance directly from DNA sequence, with up to 82% of the variation of transcript levels encoded in the gene regulatory structure. By searching for DNA regulatory motifs across the gene regulatory structure, we discover that motif interactions could explain the whole dynamic range of mRNA levels. Co-evolution across coding and non-coding regions suggests that it is not single motifs or regions, but the entire gene regulatory structure and specific combination of regulatory elements that define gene expression levels.
Overview
The claims and statistics of this paper haven’t been checked yet.
Run the check — free, no account needed. It reads the open-access text and checks the sources it cites.
Integrity signals
Registry
Cites
Statistics
Figures
Verification
Claims the paper makes
The claims and statistics of this paper haven’t been checked yet.
Run the check — free, no account needed. It reads the open-access text and checks the sources it cites.
Claims other papers make about this one
Each is checked against this paper’s own text: does it say what the citing paper says it does?
The cited source says what the claim attributes to it.
In the citing paper
“Deep learning has been applied and shown great performance in modelling chemical spaces 18 , gene expression 19 , enzyme-related parameters such as enzyme affinity 20 and EC numbers 21 .”
From Deep learning-based kcat prediction enables improved enzyme-constrained model reconstruction (2022) · cites this paper as [19]
Self-check
Percentages, sums and reported differences re-computed from the paper’s own numbers.
The self-check needs the paper’s full text.
Citations
Cites
ImageNet classification with deep convolutional neural networks
Krizhevsky, A., Sutskever, I., & Hinton, G. E. (2017) · Communications of the ACM · doi:10.1145/3065386 · Cited by 112,155
Hochreiter, S., & Schmidhuber, J. (1997) · Neural Computation · doi:10.1162/neco.1997.9.8.1735 · Cited by 102,318
Adam: A Method for Stochastic Optimization
Kingma, D. P., & Ba, J. (2014) · arXiv · doi:10.48550/arxiv.1412.6980 · Cited by 98,946
Going deeper with convolutions
Szegedy, C., Liu, W., Jia, Y., Sermanet, P., Reed, S., Anguelov, D., Erhan, D., Vanhoucke, V., & Rabinovich, A. (2015) · 2015 IEEE Conference on Computer Vision and Pattern Recognition (CVPR) · doi:10.1109/cvpr.2015.7298594 · Cited by 48,562
MAFFT Multiple Sequence Alignment Software Version 7: Improvements in Performance and Usability
Katoh, K., & Standley, D. M. (2013) · Molecular Biology and Evolution · doi:10.1093/molbev/mst010 · Cited by 46,209
Gene Ontology: tool for the unification of biology
Ashburner, M., Ball, C. A., Blake, J. A., Botstein, D., Butler, H., Cherry, J. M., Davis, A. P., Dolinski, K., Dwight, S. S., Eppig, J. T., et al. (2000) · Nature Genetics · doi:10.1038/75556 · Cited by 43,206
(2014) · Cited by 33,419
MrBayes 3: Bayesian phylogenetic inference under mixed models
Ronquist, F., & Huelsenbeck, J. P. (2003) · Bioinformatics · doi:10.1093/bioinformatics/btg180 · Cited by 29,194
The Elements of Statistical Learning
Hastie, T., Tibshirani, R., & Friedman, J. (2009) · Springer Series in Statistics · doi:10.1007/978-0-387-84858-7 · Cited by 25,970
Delving Deep into Rectifiers: Surpassing Human-Level Performance on ImageNet Classification
He, K., Zhang, X., Ren, S., & Sun, J. (2015) · 2015 IEEE International Conference on Computer Vision (ICCV) · doi:10.1109/iccv.2015.123 · Cited by 19,741
Research works printed but not linked: 2
- Kuhn, M. & Johnson, K. Applied predictive modelling. (Springer, New York, Heidelberg, Dordrecht, London, 2013).
- Shalizi, C. Advanced data analysis from an elementary point of view. (Cambridge University Press, 2013).
Cited by
Sorted by citations
Deep learning-based kcat prediction enables improved enzyme-constrained model reconstruction
Li, F., Yuan, L., Lu, H., Li, G., Chen, Y., Engqvist, M. K. M., Kerkhoven, E. J., & Nielsen, J. (2022) · Nature Catalysis · doi:10.1038/s41929-022-00798-z · Cited by 466
Self-citationMachine learning in clinical decision making
Adlung, L., Cohen, Y., Mor, U., & Elinav, E. (2021) · Med · doi:10.1016/j.medj.2021.04.006 · Cited by 321
Kim, J. I., Maguire, F., Tsang, K. K., Gouliouris, T., Peacock, S. J., McAllister, T. A., McArthur, A. G., & Beiko, R. G. (2022) · Clinical Microbiology Reviews · doi:10.1128/cmr.00179-21 · Cited by 295
Goshisht, M. K. (2024) · ACS Omega · doi:10.1021/acsomega.3c05913 · Cited by 173
A review of deep learning applications in human genomics using next-generation sequencing data
Alharbi, W., & Rashid, M. (2022) · Human Genomics · doi:10.1186/s40246-022-00396-x · Cited by 179
Diffusion models in bioinformatics and computational biology
Guo, Z., Liu, J., Wang, Y., Chen, M., Wang, D., Xu, D., & Cheng, J. (2023) · Nature Reviews Bioengineering · doi:10.1038/s44222-023-00114-9 · Cited by 193
A foundational large language model for edible plant genomes
Mendoza‐Revilla, J., Trop, E., Gonzalez, L., Roller, M., Dalla-Torre, H., de Almeida, B. P., Richard, G., Caton, J., Carranza, N. L., Skwark, M. J., et al. (2024) · Communications Biology · doi:10.1038/s42003-024-06465-2 · Cited by 129
Yasmeen, E., Wang, J., Riaz, M., Zhang, L., & Zuo, K. (2023) · Plant Communications · doi:10.1016/j.xplc.2023.100558 · Cited by 106
Controlling gene expression with deep generative design of regulatory DNA
Zrimec, J., Fu, X., Muhammad, A. S., Skrekas, C., Jauniškis, V., Speicher, N. K., Börlin, C. S., Verendel, V., Chehreghani, M. H., Dubhashi, D., et al. (2022) · Nature Communications · doi:10.1038/s41467-022-32818-8 · Cited by 113
Self-citationComputational scoring and experimental evaluation of enzymes generated by neural networks
Johnson, S. R., Fu, X., Viknander, S., Goldin, C., Monaco, S., Zelezniak, A., & Yang, K. K. (2025) · Nature Biotechnology · doi:10.1038/s41587-024-02214-2 · Cited by 99
Self-citationPredicting gene expression from DNA sequence using deep learning models
Barbadilla-Martínez, L., Klaassen, N. H. M., van Steensel, B., & de Ridder, J. (2025) · Nature Reviews Genetics · doi:10.1038/s41576-025-00841-2 · Cited by 89
Enabling technology and core theory of synthetic biology
Zhang, X., Liu, C., Dai, J., Yuan, Y., Gao, C., Feng, Y. F., Wu, B., Wei, P., You, C., Wang, X., et al. (2023) · Science China Life Sciences · doi:10.1007/s11427-022-2214-2 · Cited by 69
Big data and deep learning for RNA biology
Hwang, H., Jeon, H., Yeo, N., & Baek, D. (2024) · Experimental & Molecular Medicine · doi:10.1038/s12276-024-01243-w · Cited by 64
A multi-scale expression and regulation knowledge base forEscherichia coli
Lamoureux, C. R., Decker, K., Sastry, A. V., Rychel, K., Gao, Y., McConn, J. L., Zielinski, D. C., & Palsson, B. Ø. (2023) · Nucleic Acids Research · doi:10.1093/nar/gkad750 · Cited by 70
Synonymous codon usage regulates translation initiation
Barrington, C. L., Galindo, G., Koch, A., Horton, E. R., Morrison, E. J., Tisa, S., Stasevich, T. J., & Rissland, O. S. (2023) · Cell Reports · doi:10.1016/j.celrep.2023.113413 · Cited by 64
Large language models in plant biology
Lam, H. Y. I., Ong, X. E., & Mutwil, M. (2024) · Trends in Plant Science · doi:10.1016/j.tplants.2024.04.013 · Cited by 70
Species-aware DNA language models capture regulatory elements and their evolution
Karollus, A., Hingerl, J., Gankin, D., Grosshauser, M., Klemon, K., & Gagneur, J. (2024) · Genome biology · doi:10.1186/s13059-024-03221-x · Cited by 66
Wang, T., Xiang, G., He, S., Su, L., Wang, Y., Yan, X., & Lu, H. (2024) · Briefings in Bioinformatics · doi:10.1093/bib/bbae409 · Cited by 57
Machine learning for the advancement of genome-scale metabolic modeling
Kundu, P., Beura, S., Mondal, S., Das, A. K., & Ghosh, A. (2024) · Biotechnology Advances · doi:10.1016/j.biotechadv.2024.108400 · Cited by 53
Why Do Some Vertebrates Have Microchromosomes?
Srikulnath, K., Ahmad, S. F., Singchat, W., & Panthum, T. (2021) · Cells · doi:10.3390/cells10092182 · Cited by 44
Gorjifard, S., Jores, T., Tonnies, J., Mueth, N. A., Bubb, K. L., Wrightsman, T., Buckler, E. S., Fields, S., Cuperus, J. T., & Queitsch, C. (2024) · Nature Communications · doi:10.1038/s41467-024-50174-7 · Cited by 44
Cong, Y., & Endo, T. (2022) · OMICS A Journal of Integrative Biology · doi:10.1089/omi.2022.0068 · Cited by 47
Learning the Regulatory Code of Gene Expression
Zrimec, J., Buric, F., Kokina, M., García, V., & Zelezniak, A. (2021) · Frontiers in Molecular Biosciences · doi:10.3389/fmolb.2021.673363 · Cited by 45
Self-citationMonti, M. M., Fiorentino, J., Milanetti, E., Gosti, G., & Tartaglia, G. G. (2022) · Entropy · doi:10.3390/e24020141 · Cited by 44
Genomics enters the deep learning era
Routhier, E., & Mozziconacci, J. (2022) · PeerJ · doi:10.7717/peerj.13613 · Cited by 45
Parthiban, S., Vijeesh, T., Thashanamoorthi, G., Shanmugaraj, B., Sharma, A. K., & Ramalingam, S. (2023) · Frontiers in Plant Science · doi:10.3389/fpls.2023.1252166 · Cited by 43
Li, Y., Wang, F., Yang, J., Han, Z., Chen, L., Jiang, W., Zhou, H., Li, T., Tang, Z., Deng, J., et al. (2025) · Nature Communications · doi:10.1038/s41467-025-64894-x · Cited by 37
Labels in a haystack: Approaches beyond supervised learning in biomedical applications
Yakimovich, A., Beaugnon, A., Huang, Y., & Özkırımlı, E. (2021) · Patterns · doi:10.1016/j.patter.2021.100383 · Cited by 41
Codon Optimization Using a Recurrent Neural Network
Goulet, D. R., Yan, Y., Agrawal, P., Waight, A. B., Mak, A. N.-S., & Zhu, Y. (2022) · Journal of Computational Biology · doi:10.1089/cmb.2021.0458 · Cited by 36
Liu, B., Gao, J., Liu, X. F., Rao, G., Luo, J., Peng, H., Hu, W., Zhang, Z., Zhao, Q., Han, L., et al. (2023) · Journal of Clinical Microbiology · doi:10.1128/jcm.00617-23 · Cited by 33
Yuan, L., Lu, H., Li, F., Nielsen, J., & Kerkhoven, E. J. (2023) · Briefings in Bioinformatics · doi:10.1093/bib/bbad035 · Cited by 31
Self-citationDeep neural network prediction of genome-wide transcriptome signatures – beyond the Black-box
Magnusson, R., Tegner, J. N., & Gustafsson, M. (2022) · npj Systems Biology and Applications · doi:10.1038/s41540-022-00218-9 · Cited by 31
An Overview of Deep Generative Models in Functional and Evolutionary Genomics
Yelmen, B., & Jay, F. (2023) · Annual Review of Biomedical Data Science · doi:10.1146/annurev-biodatasci-020722-115651 · Cited by 31
Li, T. H., Xu, H., Teng, S., Suo, M., Bahitwa, R., Xu, M., Qian, Y., Ramstein, G. P., Song, B., Buckler, E. S., et al. (2024) · Proceedings of the National Academy of Sciences · doi:10.1073/pnas.2319811121 · Cited by 33
A Suite of Constitutive Promoters for Tuning Gene Expression in Plants
Zhou, A., Kirkpatrick, L. D., Ornelas, I. J., Washington, L. J., Hummel, N. F. C., Gee, C. W., Tang, S. N., Barnum, C. R., Scheller, H. V., & Shih, P. M. (2023) · ACS Synthetic Biology · doi:10.1021/acssynbio.3c00075 · Cited by 30
A primer on the use of machine learning to distil knowledge from data in biological psychiatry
Quinn, T. P., Hess, J., Marshe, V. S., Barnett, M. M., Hauschild, A.-C., Maciukiewicz, M., Elsheikh, S. S. M., Men, X., Schwarz, E., Trakadis, Y. J., et al. (2024) · Molecular Psychiatry · doi:10.1038/s41380-023-02334-2 · Cited by 38
Wang, X., Li, F., Zhang, Y., Imoto, S., Shen, H., Li, S., Guo, Y., Yang, J., & Song, J. (2024) · Briefings in Bioinformatics · doi:10.1093/bib/bbae446 · Cited by 35
Importance of the 5′ regulatory region to bacterial synthetic biology applications
Tietze, L., & Lale, R. R. (2021) · Microbial Biotechnology · doi:10.1111/1751-7915.13868 · Cited by 30
Deep Learning Concepts and Applications for Synthetic Biology
Beardall, W., Stan, G.-B. V., & Dunlop, M. J. (2022) · GEN Biotechnology · doi:10.1089/genbio.2022.0017 · Cited by 32
Smet, D., Opdebeeck, H., & Vandepoele, K. (2023) · Frontiers in Plant Science · doi:10.3389/fpls.2023.1212073 · Cited by 28
Gardiner, L., Rusholme‐Pilcher, R., Colmer, J., Rees, H., Crescente, J. M., Carrieri, A. P., Duncan, S. H., Pyzer‐Knapp, E. O., Krishna, R., & Hall, A. J. W. (2021) · Proceedings of the National Academy of Sciences · doi:10.1073/pnas.2103070118 · Cited by 28
Accelerating promoter identification and design by deep learning
Wang, X., Xu, K., Huang, Z., Lin, Y., Zhou, J., Zhou, L., & Ma, F. (2025) · Trends in biotechnology · doi:10.1016/j.tibtech.2025.05.008 · Cited by 30
Performance of Regression Models as a Function of Experiment Noise
Li, G., Zrimec, J., Ji, B., Geng, J., Larsbrink, J., Zelezniak, A., Nielsen, J., & Engqvist, M. K. M. (2021) · Bioinformatics and Biology Insights · doi:10.1177/11779322211020315 · Cited by 37
Self-citationEndogenous p53 expression in human and mouse is not regulated by its 3′UTR
Mitschka, S., & Mayr, C. (2021) · eLife · doi:10.7554/elife.65700 · Cited by 26
Milito, A., Aschern, M., McQuillan, J. L., & Yang, J. (2023) · Journal of Experimental Botany · doi:10.1093/jxb/erad100 · Cited by 26
Machine learning enables identification of an alternative yeast galactose utilization pathway
Harrison, M., Ubbelohde, E. J., LaBella, A. L., Opulente, D. A., Wolters, J. F., Zhou, X., Shen, X., Groenewald, M., Hittinger, C. T., & Rokas, A. (2024) · Proceedings of the National Academy of Sciences · doi:10.1073/pnas.2315314121 · Cited by 24
Promoting lignocellulosic biorefinery by machine learning: progress, perspectives and challenges
Huang, X., Zhang, X., Xing, L., Huang, S., Zhang, C., Hu, X.-C., & Liu, C. (2025) · Bioresource Technology · doi:10.1016/j.biortech.2025.132434 · Cited by 24
Chemical imaging for biological systems: techniques, AI-driven processing, and applications
Cui, Y., Zhang, Z., Shi, Y., & Hu, Y. (2025) · Journal of Materials Chemistry B · doi:10.1039/d4tb02876g · Cited by 23
Barazandeh, S., Özden, F., Hınçer, A., Şeker, U. Ö. Ş., & Çiçek, A. E. (2024) · Bioinformatics Advances · doi:10.1093/bioadv/vbaf134 · Cited by 24
Transcriptional regulation in plants: Using omics data to crack the cis-regulatory code
Zemlyanskaya, E. V., Dolgikh, V. A., Levitsky, V. G., & Mironova, V. (2021) · Current Opinion in Plant Biology · doi:10.1016/j.pbi.2021.102058 · Cited by 22
Precise engineering of gene expression by editing plasticity
Qiu, Y., Liu, L., Yan, J., Xianglei, X., Wang, S., Luo, Y., Deng, K., Xu, J., Jin, M., Wu, X., et al. (2025) · Genome biology · doi:10.1186/s13059-025-03516-7 · Cited by 23
Unveiling the frontiers of deep learning: Innovations shaping diverse domains
Ahmed, S. F., Alam, M. S. B., Kabir, M., Afrin, S., Rafa, S. J., Mehjabin, A., & Gandomi, A. H. (2025) · Applied Intelligence · doi:10.1007/s10489-025-06259-x · Cited by 30
Wang, Z., Peng, Y., Li, J., Li, J., Yuan, H., Yang, S., Ding, X., Xie, A., Zhang, J., Wang, S., et al. (2024) · Plant Communications · doi:10.1016/j.xplc.2024.100985 · Cited by 21
Programmed versus non-programmed evolution of aging. What is the evidence?
Pamplona, R., Jové, M., Gómez, J., & Barja, G. (2023) · Experimental Gerontology · doi:10.1016/j.exger.2023.112162 · Cited by 27
Constant, D. A., Gutierrez, J. M., Sastry, A. V., Viazzo, R., Smith, N. R., Hossain, J., Spencer, D. A., Carter, H., Ventura, A. B., Louie, M. T. M., et al. (2023) · bioRxiv (Cold Spring Harbor Laboratory) · doi:10.1101/2023.02.11.528149 · Cited by 21
Levy, B., Xu, Z., Zhao, L., Kremling, K. A. G., Altman, R., Wong, P., & Tanner, C. (2022) · Research Square · doi:10.21203/rs.3.rs-1927200/v1 · Cited by 20
From text to traits: exploring the role of large language models in plant breeding
Yoosefzadeh-Najafabadi, M. (2025) · Frontiers in Plant Science · doi:10.3389/fpls.2025.1583344 · Cited by 21
Synthetic Biology of Plants and Microbes for Agriculture, Environment, and Future Applications
Clauer, P. R., Nou, A., Toth, T., Yu, Q., Chemla, Y., Boo, A., Yoon, K. S., & Voigt, C. A. (2026) · Chemical Reviews · doi:10.1021/acs.chemrev.4c00687 · Cited by 21
Ma, X., Ma, L., & Huo, Y. (2021) · Trends in biotechnology · doi:10.1016/j.tibtech.2021.11.002 · Cited by 17
A multi-scale transcriptional regulatory network knowledge base for Escherichia coliPreprint
Lamoureux, C. R., Decker, K., Sastry, A. V., Rychel, K., Gao, Y., McConn, J. L., Zielinski, D. C., & Palsson, B. Ø. (2021) · bioRxiv (Cold Spring Harbor Laboratory) · doi:10.1101/2021.04.08.439047 · Cited by 17
Markova, E. A., Shaw, R. E., & Reynolds, C. R. (2022) · Engineering Biology · doi:10.1049/enb2.12025 · Cited by 17
mRNA-LM: full-length integrated SLM for mRNA analysis
Li, S., Noroozizadeh, S., Moayedpour, S., Kogler-Anele, L., Xue, Z., Zheng, D., Montoya, F. U., Agarwal, V., Bar‐Joseph, Z., & Jäger, S. (2025) · Nucleic Acids Research · doi:10.1093/nar/gkaf044 · Cited by 18
High-Dimensional Single-Cell Transcriptomics in Melanoma and Cancer Immunotherapy
Quek, C. Y. J., Bai, X., Long, G. V., Scolyer, R. A., & Wilmott, J. S. (2021) · Genes · doi:10.3390/genes12101629 · Cited by 16
De novo promoter design method based on deep generative and dynamic evolution algorithm
Gu, Y., Su, J., Xia, J., Wu, P., Wu, H., Su, Y., Wei, P.-J., & Zheng, C.-H. (2025) · Nucleic Acids Research · doi:10.1093/nar/gkaf833 · Cited by 14
The Expanding Computational Toolbox for Engineering Microbial Phenotypes at the Genome Scale
Zielinski, D. C., Patel, A., & Palsson, B. Ø. (2020) · Microorganisms · doi:10.3390/microorganisms8122050 · Cited by 15
Performance of Regression Models as a Function of Experiment Noise
Li, G., Zrimec, J., Ji, B., Geng, J., Larsbrink, J., Zelezniak, A., Nielsen, J., & Engqvist, M. K. M. (2021) · Technical University of Denmark, DTU Orbit (Technical University of Denmark, DTU) · Cited by 14
Self-citationFrontiers and techniques in plant gene regulation
Jores, T., Hamm, M. O., Cuperus, J. T., & Queitsch, C. (2023) · Current Opinion in Plant Biology · doi:10.1016/j.pbi.2023.102403 · Cited by 15
Orantes-Bonilla, M., Wang, H., Lee, H., Golicz, A. A., Hu, D., Li, W., Zou, J., & Snowdon, R. J. (2023) · Theoretical and Applied Genetics · doi:10.1007/s00122-023-04345-7 · Cited by 13
Popović, M. C., Stanišić, M. D., & Prodanović, R. (2024) · Fermentation · doi:10.3390/fermentation10020093 · Cited by 14
Lin, J., Luo, R., & Pinello, L. (2024) · bioRxiv (Cold Spring Harbor Laboratory) · doi:10.1101/2024.08.01.606099 · Cited by 13
Predicting gene expression state and prioritizing putative enhancers using 5hmC signal
González‐Avalos, E., Onodera, A., Samaniego‐Castruita, D., Rao, A., & Ay, F. (2024) · Genome biology · doi:10.1186/s13059-024-03273-z · Cited by 13
Rich, A., Acar, O., & Carvunis, A. (2024) · Genome biology · doi:10.1186/s13059-024-03287-7 · Cited by 13
Amino acid sequence encodes protein abundance shaped by protein stability at reduced synthesis cost
(2024) · doi:10.1002/pro.5239 · Cited by 12
Self-citationChromatin enables precise and scalable gene regulation with factors of limited specificity
Perkins, M. L., Crocker, J., & Tkačik, G. (2024) · Proceedings of the National Academy of Sciences · doi:10.1073/pnas.2411887121 · Cited by 11
Intelligent host engineering for metabolic flux optimisation in biotechnology
Munro, L. J., & Kell, D. B. (2021) · Biochemical Journal · doi:10.1042/bcj20210535 · Cited by 12
Inference on the structure of gene regulatory networks
Wang, Y., & Wang, Z. (2022) · Journal of Theoretical Biology · doi:10.1016/j.jtbi.2022.111055 · Cited by 13
Multigene engineering in plants: Technologies, applications, and future prospects
Rajput, R., Boone, B. A., Mandlik, R., Islam, M. T., Qi, Y., Wang, J., Barrangou, R., Sozzani, R., Eckert, C. A., Tuskan, G. A., et al. (2025) · Biotechnology Advances · doi:10.1016/j.biotechadv.2025.108697 · Cited by 11
Advances in promoter engineering strategies for enhanced recombinant protein expression in plants
Sadravi, S., Lee, J., & JianFeng, X. (2026) · Frontiers in Plant Science · doi:10.3389/fpls.2025.1747353 · Cited by 11
DeePromClass: Delineator for Eukaryotic Core Promoters Employing Deep Neural Networks
Kari, H., Bandi, S. M. S., Kumar, A., & Yella, V. R. (2022) · IEEE/ACM Transactions on Computational Biology & Bioinformatics · doi:10.1109/tcbb.2022.3163418 · Cited by 8
Interpretable deep residual network uncovers nucleosome positioning and associated features
Masoudi‐Sobhanzadeh, Y., Li, S., Peng, Y., & Panchenko, A. R. (2024) · Nucleic Acids Research · doi:10.1093/nar/gkae623 · Cited by 11
Chen, H., Yang, Y., & Dong, Z. (2025) · Scientific Reports · doi:10.1038/s41598-025-87663-8 · Cited by 11
FUN-PROSE: A deep learning approach to predict condition-specific gene expression in fungi
Nambiar, A., Dubinkina, V. B., Liu, S., & Maslov, S. (2023) · PLoS Computational Biology · doi:10.1371/journal.pcbi.1011563 · Cited by 10
Prinz, R., Bücher, P., Kun, Á., Paredes, O., Aragno, A., Shelby, C. L., Gumbel, M., Fimmel, E., & Strüngmann, L. (2025) · Biosystems · doi:10.1016/j.biosystems.2025.105515 · Cited by 9
In silico prediction of variant effects: promises and limitations for precision plant breeding
Sendrowski, J., Bataillon, T. M., & Ramstein, G. P. (2025) · Theoretical and Applied Genetics · doi:10.1007/s00122-025-04973-1 · Cited by 12
A Genetic Algorithm-Based Ensemble Learning Framework for Drug Combination Prediction
Wu, L., Ye, X., Zhang, Y., Gao, J., Lin, Z., Sui, B., Wen, Y., Wu, Q., Liu, K., He, S., et al. (2023) · Journal of Chemical Information and Modeling · doi:10.1021/acs.jcim.3c00260 · Cited by 10
Szymczyk, P., & Majewska, M. (2024) · Applied Sciences · doi:10.3390/app14114877 · Cited by 10
Cutting-edge deep-learning based tools for metagenomic research
Karin, E. L., & Steinegger, M. (2025) · National Science Review · doi:10.1093/nsr/nwaf056 · Cited by 10
Generation of Realistic Gene Regulatory Networks by Enriching for Feed-Forward Loops
Zhivkoplias, E. K., Vavulov, O., Hillerton, T., & Sonnhammer, E. L. L. (2022) · Frontiers in Genetics · doi:10.3389/fgene.2022.815692 · Cited by 9
Gao, S., Rehman, J., & Dai, Y. D. (2022) · Computational and Structural Biotechnology Journal · doi:10.1016/j.csbj.2022.07.014 · Cited by 9
Feasibility of predicting allele specific expression from DNA sequencing using machine learning
Zhang, Z., van Dijk, F., de Klein, N., van Gijn, M. E., Franke, L., Sinke, R. J., Swertz, M. A., & van der Velde, K. J. (2021) · Scientific Reports · doi:10.1038/s41598-021-89904-y · Cited by 9
Toward learning the principles of plant gene regulation
Zrimec, J., Zelezniak, A., & Gruden, K. (2022) · Trends in Plant Science · doi:10.1016/j.tplants.2022.08.010 · Cited by 9
Self-citationMachine learning applications for transcription level and phenotype predictions
Chantaraamporn, J., Phumikhet, P., Nguantad, S., Techo, T., & Charoensawan, V. (2022) · IUBMB Life · doi:10.1002/iub.2693 · Cited by 8
Deep Learning for Lung Cancer Nodal Staging and Real-World Clinical Practice
Park, C. M., & Lee, J. H. (2021) · Radiology · doi:10.1148/radiol.2021211981 · Cited by 8
Predicting cold-stress responsive genes in cotton with machine learning models
Zhang, M., Deng, Y., Shi, W., Wang, L., Zhou, N., Wang, H., Zhang, Z., Guan, X., & Zhao, T. (2024) · Crop Design · doi:10.1016/j.cropd.2024.100085 · Cited by 7
Rashid, A., Al-Obeidat, F. N., Hafez, W., Benakatti, G., Malik, R. A., Koutentis, C. A., Sharief, J., Brierley, J., Quraishi, N. A., Malik, Z. A., et al. (2023) · Shock · doi:10.1097/shk.0000000000002227 · Cited by 7
Shrimankar, D. D., Durge, A. R., & Sawarkar, A. D. (2022) · Current Genomics · doi:10.2174/1389202923666220927105311 · Cited by 8
Sequence-based modelling of bacterial genomes enables accurate antibiotic resistance predictionPreprint
Wiatrak, M., Weimann, A., Dinan, A. M., Brbić, M., & Floto, R. A. (2024) · bioRxiv (Cold Spring Harbor Laboratory) · doi:10.1101/2024.01.03.574022 · Cited by 8
Toward Identification of Functional Sequences and Variants in Noncoding DNA
Monti, R., & Ohler, U. (2023) · Annual Review of Biomedical Data Science · doi:10.1146/annurev-biodatasci-122120-110102 · Cited by 6
Wang, C. C. Q., Dong, Y., Li, C., Oberstaller, J., Zhang, M., Gibbons, J., Pires, C. V., Xiao, M., Zhu, L., Jiang, R. H. Y., et al. (2023) · Genome biology · doi:10.1186/s13059-023-03063-z · Cited by 7
Zeng, J., Song, K., Wang, J., Wen, H., Zhou, J., Ni, T., Lü, H., & Yu, Y. (2024) · Microbial Cell Factories · doi:10.1186/s12934-023-02271-3 · Cited by 7
Metadata
- Authors
- Zrimec, J., Börlin, C. S., Buric, F., Muhammad, A. S., Chen, R., Siewers, V., Verendel, V., Nielsen, J., Töpel, M., & Zelezniak, A.
- Affiliations
- Chalmers University of Technology (SE)
- University of Gothenburg (SE)
- Science for Life Laboratory (SE)
- Corresponding author
- Zelezniak, Aleksej
- ORCID
- Venue
- Nature Communications
- Published
- 2020-12-01
- Volume
- 11
- Issue
- 1
- Pages
- 6141-6141
- ISSN
- 2041-1723 (ISSN-L)
- PMC
- PMC7708451
- OpenAlex
- W3108101741
- Cited by
- 174
- References
- 154
- Citations by year
- 2026: 19 · 2025: 35 · 2024: 42 · 2023: 28 · 2022: 27 · 2021: 21 · 2020: 2
- FWCI
- 6.32
- Type
- journal article
- Language
- en
- Open access
- gold
- doi.org
- Locations
- Nature Communications (publishedVersion, cc-by)
- bioRxiv (Cold Spring Harbor Laboratory) (acceptedVersion, cc-by-nc-nd)
- PubMed Central (publishedVersion, cc-by)
- PubMed (publishedVersion)
- RePEc: Research Papers in Economics (submittedVersion)
- DOAJ (DOAJ: Directory of Open Access Journals) (submittedVersion, cc-by-sa)
- Chalmers Research (Chalmers University of Technology) (submittedVersion)
- Funders
- Nvidia
- European Commission (722287)
- Chalmers Tekniska Högskola
- Science for Life Laboratory
- Novo Nordisk Fonden (NNF10CC1016517)
- Topics
- Life Sciences › Biochemistry, Genetics and Molecular Biology › Molecular Biology › Genomics and Chromatin Dynamics
- Life Sciences › Biochemistry, Genetics and Molecular Biology › Molecular Biology › Gene Regulatory Network Analysis
- Life Sciences › Biochemistry, Genetics and Molecular Biology › Molecular Biology › RNA and protein synthesis mechanisms
- Keywords
- gene expression regulation, mRNA levels, DNA sequences, regulatory motifs, coevolution, non-coding regions, coding sequences, deep learning, transcriptome, model organisms
- MeSH terms
- Deep Learning, Animals, Bacteria, Base Sequence, Drosophila melanogaster, Gene Expression Regulation, Humans, Regulatory Sequences, Nucleic Acid, RNA, Messenger, Saccharomyces cerevisiae, Evolution, Molecular, Mice
About these checks
Registry, retraction, Cites and statistics results are computed, not judged, with one exception: a printed reference that no index lists is read once by a model before it counts as a citation error. Claims are extracted by a model and kept only when their quote appears verbatim in the text; each cited source is then checked, with a model’s help, for whether it says what the claim relies on. Those verdicts can be wrong — read the claim’s quote and the cited source before relying on one.
Statistics and arithmetic are recomputed, not judged.
Confidence bands are shown only for fields calibrated on our annotated test set. None is calibrated yet, so no band is shown.
What counts as a claim ›How we measure confidence ›How we check this ›
Are you an author, or do you see a problem with this page? Request a review
