

The DOI matches its Crossref record; 107 of the 107 references it cites were found in a registry or an index.
A new global ice sheet reconstruction for the past 80 000 years
Abstract
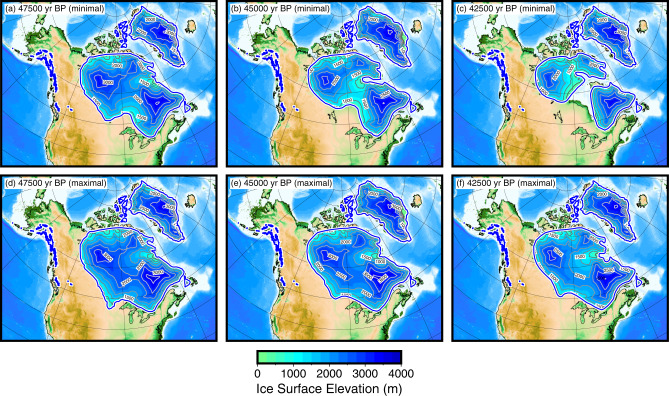
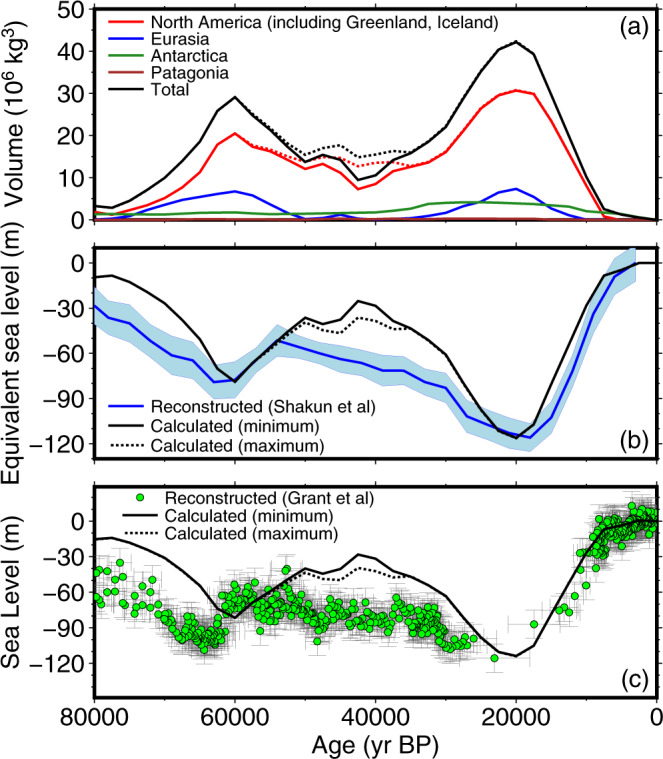
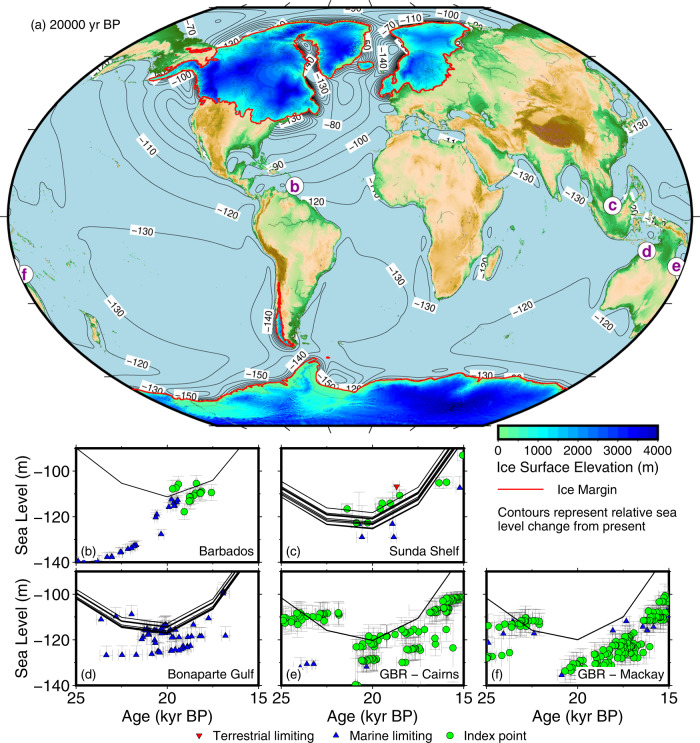
The evolution of past global ice sheets is highly uncertain. One example is the missing ice problem during the Last Glacial Maximum (LGM, 26 000-19 000 years before present) – an apparent 8-28 m discrepancy between far-field sea level indicators and modelled sea level from ice sheet reconstructions. In the absence of ice sheet reconstructions, researchers often use marine δ 18 O proxy records to infer ice volume prior to the LGM. We present a global ice sheet reconstruction for the past 80 000 years, called PaleoMIST 1.0, constructed independently of far-field sea level and δ 18 O proxy records. Our reconstruction is compatible with LGM far-field sea-level records without requiring extra ice volume, thus solving the missing ice problem. However, for Marine Isotope Stage 3 (57 000-29 000 years before present) - a pre-LGM period - our reconstruction does not match proxy-based sea level reconstructions, indicating the relationship between marine δ 18 O and sea level may be more complex than assumed.
Overview
The claims and statistics of this paper haven’t been checked yet.
Run the check — free, no account needed. It reads the open-access text and checks the sources it cites.
Integrity signals
Registry
Cites
Statistics
Figures
Verification
Claims the paper makes
The claims and statistics of this paper haven’t been checked yet.
Run the check — free, no account needed. It reads the open-access text and checks the sources it cites.
Claims other papers make about this one
Each is checked against this paper’s own text: does it say what the citing paper says it does?
The cited source doesn’t support the claim as written.
In the citing paper
“There is agreement however between the revised and earlier proposed sea-level histories that global sea level fell rapidly after 40 ka (i.e. the beginning of cold Heinrich Event 4 or HE 4) reaching a minimum of at least −120 m at the beginning of the LGM (approx. 26.5 ka) [16,20].”
From Beringia and the peopling of the Western Hemisphere (2023) · cites this paper as [20]
Checked by a reasoning model — may be wrong.
Experimental — accuracy not yet measuredThe source backs part of the claim, not all of it — or backs it for a different population, condition or comparison.
In the citing paper
“There also is consensus that re-advance of the LIS and Cordilleran ice sheet began during HE 4, eventually blocking both interior (i.e. ice-free corridor) and NW Pacific coastal access from Beringia to mid-latitude North America [17,18,20]”
From Beringia and the peopling of the Western Hemisphere (2023) · cites this paper as [20]
Experimental — accuracy not yet measuredIn the citing paper
“The revised sea-level history and reconstruction of the LIS have been disputed, based on both geochronology and climate-stratigraphy, and the issue currently is subject to debate among Quaternary geologists [19,20].”
From Beringia and the peopling of the Western Hemisphere (2023) · cites this paper as [20]
Self-check
Percentages, sums and reported differences re-computed from the paper’s own numbers.
The self-check needs the paper’s full text.
Citations
Cites
Generic Mapping Tools: Improved Version Released
Wessel, P., Smith, W. H. F., Scharroo, R., Luís, J. F., & Wobbe, F. (2013) · Eos · doi:10.1002/2013eo450001 · Cited by 3,956
Sea-level and deep water temperature changes derived from benthic foraminifera isotopic records
Waelbroeck, C., Labeyrie, L. D., Michel, E., Duplessy, J., McManus, J. F., Lambeck, K., Balbon, E., & Labracherie, M. (2002) · Quaternary Science Reviews · doi:10.1016/s0277-3791(01)00101-9 · Cited by 2,216
Sea level and global ice volumes from the Last Glacial Maximum to the Holocene
Lambeck, K., Rouby, H., Purcell, A., Sun, Y., & Sambridge, M. (2014) · Proceedings of the National Academy of Sciences · doi:10.1073/pnas.1411762111 · Cited by 2,215
Triangle: Engineering a 2D quality mesh generator and Delaunay triangulator
Shewchuk, J. R. (1996) · Lecture Notes in Computer Science · doi:10.1007/bfb0014497 · Cited by 2,115
Sea level change through the last glacial cycle
Lambeck, K., & Chappell, J. (2001) · Science · doi:10.1126/science.1059549 · Cited by 1,619
Late Quaternary ice sheet history of northern Eurasia
Svendsen, J. I., Alexanderson, H., Astakhov, V. I., Demidov, I., Dowdeswell, J. A., Funder, S., Gataullin, V., Henriksen, M., Hjort, C., Houmark-Nielsen, M., et al. (2004) · Quaternary Science Reviews · doi:10.1016/j.quascirev.2003.12.008 · Cited by 1,590
Self-citationSpace geodesy constrains ice age terminal deglaciation: The global ICE‐6G_C (VM5a) model
Peltier, W. R., Argus, D. F., & Drummond, R. (2015) · Journal of Geophysical Research: Solid Earth · doi:10.1002/2014jb011176 · Cited by 1,470
An outline of North American deglaciation with emphasis on central and northern Canada
Dyke, A. S. (2004) · Developments in Quaternary Sciences · doi:10.1016/s1571-0866(04)80209-4 · Cited by 1,037
Peltier, W. R., & Fairbanks, R. G. (2006) · Quaternary Science Reviews · doi:10.1016/j.quascirev.2006.04.010 · Cited by 1,012
The last Eurasian ice sheets – a chronological database and time‐slice reconstruction, DATED‐1
Hughes, A. L. C., Gyllencreutz, R., Lohne, Ø. S., Mangerud, J., & Svendsen, J. I. (2016) · Boreas · doi:10.1111/bor.12142 · Cited by 1,004
Self-citation
Research works printed but not linked: 1
- Khosravi, S. Comparison of the Past Climate in Northern Canada and Greenland. Master’s thesis, University of Bremen (2017).
Cited by
Held, F., Cheng, H., Edwards, R. L., Tüysüz, O., Koç, K., & Fleitmann, D. (2024) · Nature Communications · doi:10.1038/s41467-024-45507-5 · Cited by 34
Beringia and the peopling of the Western Hemisphere
Hoffecker, J. F., Elias, S. A., Scott, G. R., O'Rourke, D. H., Hlusko, L. J., Potapova, O., Pitulko, V., Pavlova, E., Bourgeon, L., & Vachula, R. S. (2023) · Proceedings of the Royal Society B: Biological Sciences · doi:10.1098/rspb.2022.2246 · Cited by 17
Metadata
- Authors
- Gowan, E. J., Zhang, X., Khosravi, S., Rovere, A., Stocchi, P., Hughes, A. L. C., Gyllencreutz, R., Mangerud, J., Svendsen, J.-I., & Lohmann, G.
- ORCID
- Venue
- Nature Communications
- Published
- 2021-02-23
- Volume
- 12
- Issue
- 1
- ISSN
- 2041-1723
- PMC
- PMC7902671
- Cited by
- 237
- References
- 107
- Language
- en
- Licence
- creativecommons.org/licenses/by/4.0 (tdm)
- creativecommons.org/licenses/by/4.0 (vor)
About these checks
Registry, retraction, Cites and statistics results are computed, not judged, with one exception: a printed reference that no index lists is read once by a model before it counts as a citation error. Claims are extracted by a model and kept only when their quote appears verbatim in the text; each cited source is then checked, with a model’s help, for whether it says what the claim relies on. Those verdicts can be wrong — read the claim’s quote and the cited source before relying on one.
Statistics and arithmetic are recomputed, not judged.
Confidence bands are shown only for fields calibrated on our annotated test set. None is calibrated yet, so no band is shown.
What counts as a claim ›How we measure confidence ›How we check this ›
Are you an author, or do you see a problem with this page? Request a review
How to cite
Cite CoChat for the checks on this page, and the paper for its own findings.
- This page
- CoChat. (2026). Citation check: A new global ice sheet reconstruction for the past 80 000 years. https://app.cochat.ai/papers/10.1038/s41467-021-21469-w
- The paper
- Gowan, E. J., Zhang, X., Khosravi, S., Rovere, A., Stocchi, P., Hughes, A. L. C., Gyllencreutz, R., Mangerud, J., Svendsen, J.-I., & Lohmann, G. (2021). A new global ice sheet reconstruction for the past 80 000 years. Nature Communications. https://doi.org/10.1038/s41467-021-21469-w
Data sources
Bibliographic data: Semantic Scholar, OpenAlex, Crossref.
Contains information from the Semantic Scholar Academic Graph Datasets, made available under the ODC Attribution License (ODC-BY 1.0).
Semantic Scholar’s data is described in: Kinney, R., et al. (2023). The Semantic Scholar Open Data Platform. arXiv:2301.10140.
