

The DOI matches its Crossref record; 71 of the 71 references it cites were found in a registry or an index.
Single nucleus RNA-sequencing defines unexpected diversity of cholinergic neuron types in the adult mouse spinal cord
Open accessPublished version of a preprint
Abstract
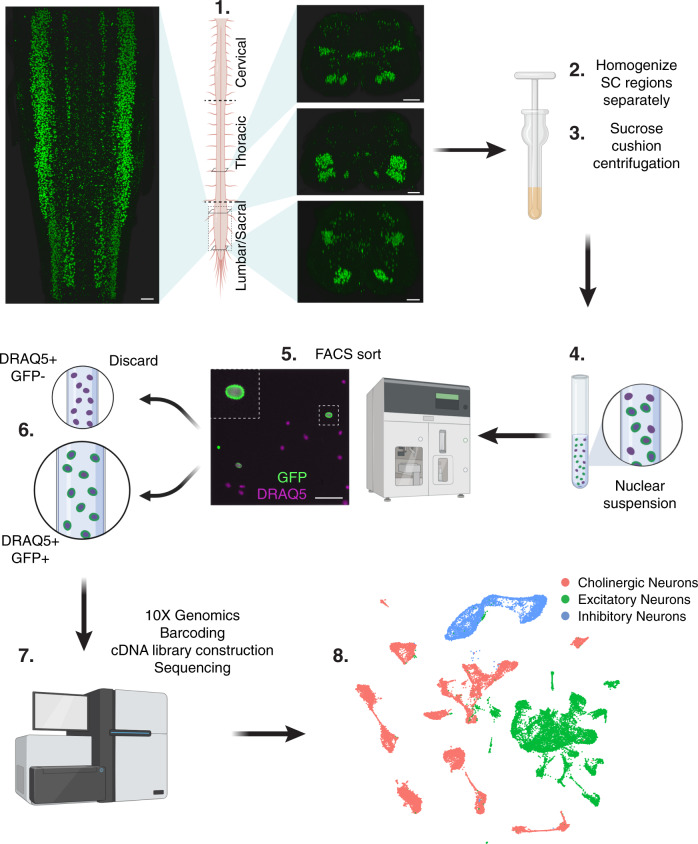
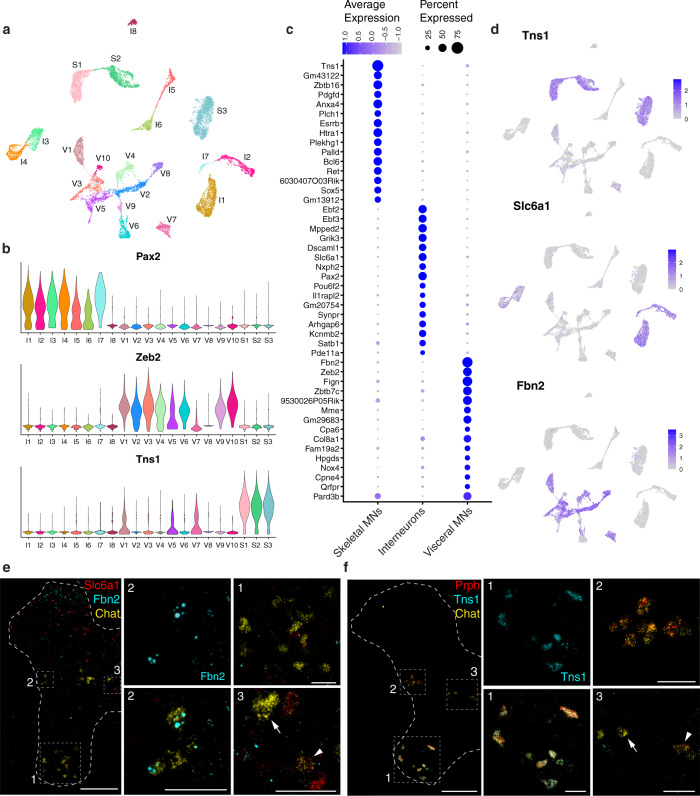
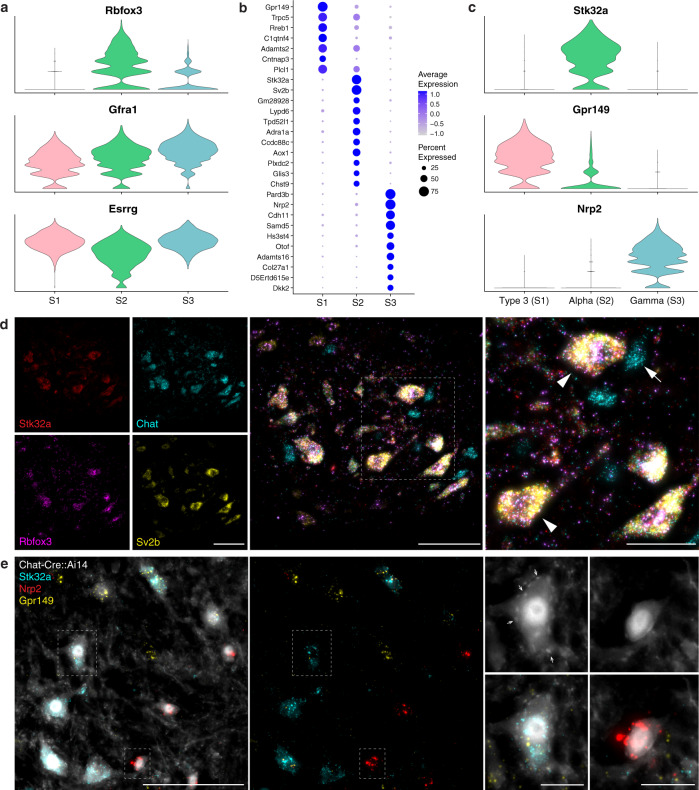
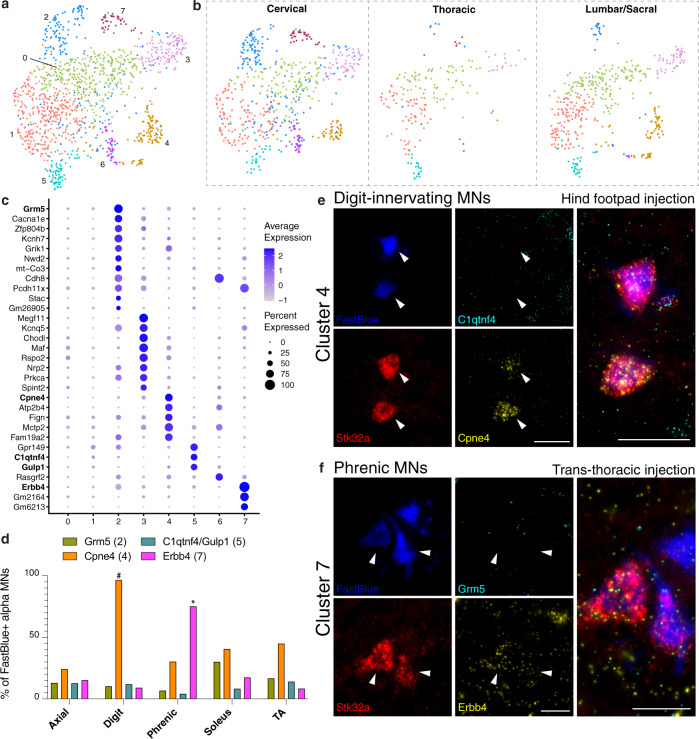
In vertebrates, motor control relies on cholinergic neurons in the spinal cord that have been extensively studied over the past hundred years, yet the full heterogeneity of these neurons and their different functional roles in the adult remain to be defined. Here, we develop a targeted single nuclear RNA sequencing approach and use it to identify an array of cholinergic interneurons, visceral and skeletal motor neurons. Our data expose markers for distinguishing these classes of cholinergic neurons and their rich diversity. Specifically, visceral motor neurons, which provide autonomic control, can be divided into more than a dozen transcriptomic classes with anatomically restricted localization along the spinal cord. The complexity of the skeletal motor neurons is also reflected in our analysis with alpha, gamma, and a third subtype, possibly corresponding to the elusive beta motor neurons, clearly distinguished. In combination, our data provide a comprehensive transcriptomic description of this important population of neurons that control many aspects of physiology and movement and encompass the cellular substrates for debilitating degenerative disorders.
Overview
The claims and statistics of this paper haven’t been checked yet.
Run the check — free, no account needed. It reads the open-access text and checks the sources it cites.
Integrity signals
Registry
Cites
Statistics
Figures
Verification
Claims the paper makes
The claims and statistics of this paper haven’t been checked yet.
Run the check — free, no account needed. It reads the open-access text and checks the sources it cites.
Claims other papers make about this one
Each is checked against this paper’s own text: does it say what the citing paper says it does?
In the citing paper
“For example, we found that digit-innervating motoneurons, expressing Cpne4 and Fign38, separated into two subtypes, one found in limb-innervating regions (both cervical and lumbar) and one that was specifically localized to the lumbar spinal cord39,40”
From A harmonized atlas of mouse spinal cord cell types and their spatial organization (2021) · cites this paper as [40]
Self-check
Percentages, sums and reported differences re-computed from the paper’s own numbers.
The self-check needs the paper’s full text.
Citations
Cites
Moderated estimation of fold change and dispersion for RNA-seq data with DESeq2
Love, M. I., Huber, W., & Anders, S. (2014) · Genome Biology · doi:10.1186/s13059-014-0550-8 · Cited by 95,106
Fiji: an open-source platform for biological-image analysis
Schindelin, J., Arganda-Carreras, I., Frise, E., Kaynig, V., Longair, M., Pietzsch, T., Preibisch, S., Rueden, C., Saalfeld, S., Schmid, B., et al. (2012) · Nature Methods · doi:10.1038/nmeth.2019 · Cited by 66,890
Comprehensive Integration of Single-Cell Data
Stuart, T., Butler, A., Hoffman, P., Hafemeister, C., Papalexi, E., Mauck, W. M., Hao, Y., Stoeckius, M., Smibert, P., & Satija, R. (2019) · Cell · doi:10.1016/j.cell.2019.05.031 · Cited by 15,453
Integrating single-cell transcriptomic data across different conditions, technologies, and species
Butler, A., Hoffman, P., Smibert, P., Papalexi, E., & Satija, R. (2018) · Nature Biotechnology · doi:10.1038/nbt.4096 · Cited by 13,174
Dimensionality reduction for visualizing single-cell data using UMAP
Becht, E., McInnes, L., Healy, J., Dutertre, C.-A., Kwok, I. W. H., Ng, L. G., Ginhoux, F., & Newell, E. W. (2019) · Nature Biotechnology · doi:10.1038/nbt.4314 · Cited by 5,358
Piezo1 and Piezo2 Are Essential Components of Distinct Mechanically Activated Cation Channels
Coste, B., Mathur, J., Schmidt, M., Earley, T. J., Ranade, S., Petrus, M. J., Dubin, A. E., & Patapoutian, A. (2010) · Science · doi:10.1126/science.1193270 · Cited by 3,316
The action potential in mammalian central neurons
Bean, B. P. (2007) · Nature Reviews Neuroscience · doi:10.1038/nrn2148 · Cited by 1,785
Single-cell profiling of the developing mouse brain and spinal cord with split-pool barcoding
Rosenberg, A. B., Roco, C. M., Muscat, R. A., Kuchina, A., Sample, P., Yao, Z., Graybuck, L. T., Peeler, D. J., Mukherjee, S., Chen, W., et al. (2018) · Science · doi:10.1126/science.aam8999 · Cited by 1,422
Massively parallel single-nucleus RNA-seq with DroNc-seq
Habib, N., Avraham-Davidi, I., Basu, A., Burks, T., Shekhar, K., Hofree, M., Choudhury, S. R., Aguet, F., Gelfand, E., Ardlie, K., et al. (2017) · Nature Methods · doi:10.1038/nmeth.4407 · Cited by 1,069
Mapping of Brain Activity by Automated Volume Analysis of Immediate Early Genes
Renier, N., Adams, E. L., Kirst, C., Wu, Z., Azevedo, R., Kohl, J., Autry, A. E., Kadiri, L., Umadevi Venkataraju, K., Zhou, Y., et al. (2016) · Cell · doi:10.1016/j.cell.2016.05.007 · Cited by 918
Neuronal KCNQ potassium channels:physislogy and role in disease
Jentsch, T. J. (2000) · Nature reviews. Neuroscience · doi:10.1038/35036198 · Cited by 850
Epigenomic Signatures of Neuronal Diversity in the Mammalian Brain
Mo, A., Mukamel, E. A., Davis, F. P., Luo, C., Henry, G. L., Picard, S., Urich, M. A., Nery, J. R., Sejnowski, T. J., Lister, R., et al. (2015) · Neuron · doi:10.1016/j.neuron.2015.05.018 · Cited by 739
Pun, S., Santos, A. F., Saxena, S., Xu, L., & Caroni, P. (2006) · Nature Neuroscience · doi:10.1038/nn1653 · Cited by 689
Frey, D., Schneider, C., Xu, L., Borg, J., Spooren, W. P. J. M., & Caroni, P. (2000) · Journal of Neuroscience · doi:10.1523/jneurosci.20-07-02534.2000 · Cited by 683
Rossi, J., Balthasar, N., Olson, D., Scott, M., Berglund, E., Lee, C. E., Choi, M. J., Lauzon, D., Lowell, B. B., & Elmquist, J. K. (2011) · Cell Metabolism · doi:10.1016/j.cmet.2011.01.010 · Cited by 672
Saxena, S., & Caroni, P. (2011) · Neuron · doi:10.1016/j.neuron.2011.06.031 · Cited by 578
Motor Neuron Diversity in Development and Disease
Kanning, K. C., Kaplan, A., & Henderson, C. E. (2010) · Annual Review of Neuroscience · doi:10.1146/annurev.neuro.051508.135722 · Cited by 513
The Role of PIEZO2 in Human Mechanosensation
Chesler, A. T., Szczot, M., Bharucha-Goebel, D., Čeko, M., Donkervoort, S., Laubacher, C., Hayes, L. H., Alter, K., Zampieri, C., Stanley, C., et al. (2016) · New England Journal of Medicine · doi:10.1056/nejmoa1602812 · Cited by 462
Barber, R. P., Phelps, P. E., Houser, C. R., Crawford, G. D., Salvaterra, P. M., & Vaughn, J. E. (1984) · The Journal of Comparative Neurology · doi:10.1002/cne.902290305 · Cited by 453
Piezo2 senses airway stretch and mediates lung inflation-induced apnoea
Nonomura, K., Woo, S., Chang, R. B., Gillich, A., Qiu, Z., Francisco, A. G., Ranade, S. S., Liberles, S. D., & Patapoutian, A. (2016) · Nature · doi:10.1038/nature20793 · Cited by 433
A Cluster of Cholinergic Premotor Interneurons Modulates Mouse Locomotor Activity
Zagoraiou, L., Akay, T., Martin, J. F., Brownstone, R. M., Jessell, T. M., & Miles, G. B. (2009) · Neuron · doi:10.1016/j.neuron.2009.10.017 · Cited by 429
Motor neurons and the generation of spinal motor neuron diversity
Stifani, N. (2014) · Frontiers in Cellular Neuroscience · doi:10.3389/fncel.2014.00293 · Cited by 389
Sathyamurthy, A., Johnson, K. R., Matson, K. J. E., Dobrott, C. I., Li, L., Ryba, A. R., Bergman, T. B., Kelly, M. C., Kelley, M. W., & Levine, A. J. (2018) · Cell Reports · doi:10.1016/j.celrep.2018.02.003 · Cited by 370
Delile, J., Rayon, T., Melchionda, M., Edwards, A., Briscoe, J., & Sagner, A. (2019) · Development · doi:10.1242/dev.173807 · Cited by 356
Motor neuron vulnerability and resistance in amyotrophic lateral sclerosis
Nijssen, J., Comley, L. H., & Hedlund, E. (2017) · Acta Neuropathologica · doi:10.1007/s00401-017-1708-8 · Cited by 353
Chapter Six Hox Networks and the Origins of Motor Neuron Diversity
Dasen, J. S., & Jessell, T. M. (2009) · Current topics in developmental biology/Current Topics in Developmental Biology · doi:10.1016/s0070-2153(09)88006-x · Cited by 326
Neuronal Matrix Metalloproteinase-9 Is a Determinant of Selective Neurodegeneration
Kaplan, A., Spiller, K. J., Towne, C. L., Kanning, K. C., Choe, G. T., Geber, A. B., Akay, T., Aebischer, P., & Henderson, C. E. (2014) · Neuron · doi:10.1016/j.neuron.2013.12.009 · Cited by 313
Sarnat, H. B., Nochlin, D., & Born, D. E. (1998) · Brain and Development · doi:10.1016/s0387-7604(97)00111-3 · Cited by 310
Spinal cholinergic interneurons regulate the excitability of motoneurons during locomotion
Miles, G. B., Hartley, R., Todd, A. J., & Brownstone, R. M. (2007) · Proceedings of the National Academy of Sciences · doi:10.1073/pnas.0611134104 · Cited by 301
Stepien, A. E., Tripodi, M., & Arber, S. (2010) · Neuron · doi:10.1016/j.neuron.2010.10.019 · Cited by 246
Gamma and alpha motor neurons distinguished by expression of transcription factor Err3
Friese, A., Kaltschmidt, J. A., Ladle, D. R., Sigrist, M., Jessell, T. M., & Arber, S. (2009) · Proceedings of the National Academy of Sciences · doi:10.1073/pnas.0906809106 · Cited by 235
Motor Neuron Susceptibility in ALS/FTD
Ragagnin, A., Shadfar, S., Vidal, M., Jamali, M. S., & Atkin, J. D. (2019) · Frontiers in Neuroscience · doi:10.3389/fnins.2019.00532 · Cited by 232
Burrill, J. D., Moran, L., Goulding, M., & Saueressig, H. (1997) · Development · doi:10.1242/dev.124.22.4493 · Cited by 210
Blum, J. A., Klemm, S., Shadrach, J. L., Guttenplan, K. A., Nakayama, L., Kathiria, A., Hoang, P. T., Gautier, O., Kaltschmidt, J. A., Greenleaf, W. J., et al. (2021) · Nature Neuroscience · doi:10.1038/s41593-020-00795-0 · Cited by 210
Boyd, I. A., Gladden, M. H., McWilliam, P. N., & Ward, J. (1977) · The Journal of Physiology · doi:10.1113/jphysiol.1977.sp011709 · Cited by 198
Thaler, J. P., Koo, S. J., Kania, A., Lettieri, K., Andrews, S. E., Cox, C. M., Jessell, T. M., & Pfaff, S. L. (2004) · Neuron · doi:10.1016/s0896-6273(04)00011-x · Cited by 180
Motor fibres innervating extrafusal and intrafusal muscle fibres in the cat.
Bessou, P., Emonet‐Dénand, F., & Laporte, Y. (1965) · The Journal of Physiology · doi:10.1113/jphysiol.1965.sp007722 · Cited by 168
Amyotrophic lateral sclerosis: Macro–EMG and twitch forces of single motor units
Dengler, R., Konstanzer, A., Küther, G., Hesse, S., Wolf, W., & Strupplerdr, A. (1990) · Muscle & Nerve · doi:10.1002/mus.880130612 · Cited by 159
Ontogeny of the neuronal intermediate filament protein, peripherin, in the mouse embryo
Troy, C. M., Brown, K., Greene, L. A., & Shelanski, M. L. (1990) · Neuroscience · doi:10.1016/0306-4522(90)90364-a · Cited by 158
Phelps, P. E., Barber, R. P., Houser, C. R., Crawford, G. D., Salvaterra, P. M., & Vaughn, J. E. (1984) · The Journal of Comparative Neurology · doi:10.1002/cne.902290306 · Cited by 156
Topography of choline acetyltransferase Immunoreactive Neurons and fibers in the rat spinal cord
Borges, L. F., & Iversen, S. D. (1986) · Brain Research · doi:10.1016/0006-8993(86)91407-1 · Cited by 145
Shneider, N. A., Brown, M. N., Smith, C., Pickel, J. M., & Álvarez, F. J. (2009) · Neural Development · doi:10.1186/1749-8104-4-42 · Cited by 137
Enjin, A., Bernhardt, N. R., Nakanishi, S. T., Vallstedt, A., Gezelius, H., Memic, F., Lind, M., Hjalt, T. Å. H., Tourtellotte, W. G., Bruder, C. E. G., et al. (2010) · The Journal of Comparative Neurology · doi:10.1002/cne.22332 · Cited by 134
Chakkalakal, J. V., Nishimune, H., Ruas, J. L., Spiegelman, B. M., & Sanes, J. R. (2010) · Development · doi:10.1242/dev.053348 · Cited by 123
Gamma motor neurons survive and exacerbate alpha motor neuron degeneration in ALS
Lalancette–Hébert, M., Sharma, A., Lyashchenko, A. K., & Shneider, N. A. (2016) · Proceedings of the National Academy of Sciences · doi:10.1073/pnas.1605210113 · Cited by 117
Huang, A., Noga, B. R., Carr, P. A., Fedirchuk, B., & Jordan, L. M. (2000) · Journal of Neurophysiology · doi:10.1152/jn.2000.83.6.3537 · Cited by 116
Powis, R. A., & Gillingwater, T. H. (2015) · Journal of Anatomy · doi:10.1111/joa.12419 · Cited by 94
Stereotyped transcriptomic transformation of somatosensory neurons in response to injury
Nguyen, M. Q., Pichon, C. E. L., & Ryba, N. J. P. (2019) · eLife · doi:10.7554/elife.49679 · Cited by 94
ALPHA, BETA AND GAMMA MOTONEURONS: FUNCTIONAL DIVERSITY IN THE MOTOR SYSTEM'S FINAL PATHWAY
Manuel, M., & Zytnicki, D. (2011) · Journal of Integrative Neuroscience · doi:10.1142/s0219635211002786 · Cited by 93
Dalsgaard, C. ‐., Hökfelt, T. G. M., Johansson, O., & Elde, R. (1981) · Neuroscience Letters · doi:10.1016/0304-3940(81)90453-5 · Cited by 83
Murray, L. M., Beauvais, A., Gibeault, S., Courtney, N. L., & Kothary, R. (2015) · Acta Neuropathologica Communications · doi:10.1186/s40478-015-0231-1 · Cited by 80
Onecut transcription factors act upstream of Isl1 to regulate spinal motoneuron diversification
Roy, A., Francius, C., Rousso, D. L., Seuntjens, E., Debruyn, J., Luxenhofer, G., Huber, A. B., Huylebroeck, D., Novitch, B. G., & Clotman, F. (2012) · Development · doi:10.1242/dev.078501 · Cited by 75
Anderson, C. R., & Edwards, S. L. (1994) · Journal of Neuroscience Methods · doi:10.1016/0165-0270(94)90170-8 · Cited by 71
Na+/K+ ATPase 1 and 3 Isoforms Are Differentially Expressed in - and -Motoneurons
Edwards, I. J., Bruce, G., Lawrenson, C. L., Howe, L., Clapcote, S. J., Deuchars, S. A., & Deuchars, J. (2013) · Journal of Neuroscience · doi:10.1523/jneurosci.5584-12.2013 · Cited by 70
Leong, S. K., & Ling, E. (1990) · Journal of Neuroscience Methods · doi:10.1016/0165-0270(90)90067-p · Cited by 70
Distinct Limb and Trunk Premotor Circuits Establish Laterality in the Spinal Cord
Goetz, C., Pivetta, C., & Arber, S. (2014) · Neuron · doi:10.1016/j.neuron.2014.11.024 · Cited by 69
Hadzipasic, M., Tahvildari, B., Nagy, M., Bian, M., Horwich, A. L., & McCormick, D. A. (2014) · Proceedings of the National Academy of Sciences · doi:10.1073/pnas.1419497111 · Cited by 63
Durations of After-hyperpolarization of Motoneurones supplying Fast and Slow Muscles
Eccles, J. C., Eccles, R. M., & Lundberg, A. (1957) · Nature · doi:10.1038/179866b0 · Cited by 61
Mendelsohn, A. I., Dasen, J. S., & Jessell, T. M. (2017) · Neuron · doi:10.1016/j.neuron.2017.01.017 · Cited by 60
Migration patterns of sympathetic preganglionic neurons in embryonic rat spinal cord
Markham, J. A., & Vaughn, J. E. (1991) · Journal of Neurobiology · doi:10.1002/neu.480220803 · Cited by 56
Somatostatin‐Like immunoreactivity in neurons, nerve terminals, and fibers of the cat spinal cord
Krukoff, T. L., Ciriello, J., & Calaresu, F. R. (1986) · The Journal of Comparative Neurology · doi:10.1002/cne.902430103 · Cited by 52
Enjin, A., Leão, K. E., Mikulovic, S., Merre, P. L., Tourtellotte, W. G., & Kullander, K. (2012) · Molecular and Cellular Neuroscience · doi:10.1016/j.mcn.2012.01.003 · Cited by 42
Ashrafi, S., Lalancette–Hébert, M., Friese, A., Sigrist, M., Arber, S., Shneider, N. A., & Kaltschmidt, J. A. (2012) · Journal of Neuroscience · doi:10.1523/jneurosci.1160-12.2012 · Cited by 39
Nascimento, F., Broadhead, M. J., Tetringa, E., Tsape, E., Zagoraiou, L., & Miles, G. B. (2020) · eLife · doi:10.7554/elife.54170 · Cited by 36
Skeletofusimotor (β) innervation of proximal and distal forelimb muscles of the cat
Scott, J., Kümmel, H., & Illert, M. (1995) · Neuroscience Letters · doi:10.1016/0304-3940(95)11485-f · Cited by 23
Keast, J. R. (1994) · Journal of the Autonomic Nervous System · doi:10.1016/0165-1838(94)90076-0 · Cited by 22
Peptidergic inputs to sympathetic preganglionic neurons
Krukoff, T. L. (1987) · Canadian Journal of Physiology and Pharmacology · doi:10.1139/y87-254 · Cited by 21
Pitx2 cholinergic interneurons are the source of C bouton synapses on brainstem motor neurons
Rozani, I., Tsapara, G., Witts, E. C., Deaville, S. J., Miles, G. B., & Zagoraiou, L. (2019) · Scientific Reports · doi:10.1038/s41598-019-39996-4 · Cited by 21
Retrograde Neuroanatomical Tracing of Phrenic Motor Neurons in Mice
Vandeweerd, J., Hontoir, F., Knoop, A. D., Swert, K. D., & Nicaise, C. (2018) · Journal of Visualized Experiments · doi:10.3791/56758 · Cited by 13
Escurat, M., Gumpel, M., Lachapelle, F., Gros, F., & Portier, M. (1988) · PubMed · Cited by 9
Single-cell transcriptomic analysis of the adult mouse spinal cordPreprint
Blum, J. A., Klemm, S. L., Nakayama, L., Kathiria, A. S., Guttenplan, K. A., Hoang, P. T., Shadrach, J. L., Kaltschmidt, J. A., Greenleaf, W. J., & Gitler, A. D. (2020) · bioRxiv (Cold Spring Harbor Laboratory) · doi:10.1101/2020.03.16.992958 · Cited by 8
Research works printed but not linked: 1
- Kandel, E. R., Schwartz, J. H., Jessell, T. M., Siegelbaum, S. A. & Hudspeth, A. J. Principles of Neural Science., McGraw-Hill Education (5th edn).
Cited by
Sorted by citations
A harmonized atlas of mouse spinal cord cell types and their spatial organization
Russ, D. E., Cross, R. B. P., Li, L., Koch, S. C., Matson, K. J. E., Yadav, A., Alkaslasi, M. R., Lee, D. I., Le Pichon, C. E., Menon, V., et al. (2021) · Nature Communications · doi:10.1038/s41467-021-25125-1 · Cited by 255
Self-citationLiang, B., Huang, Y., Zhong, Y., Li, Z., Ye, R., Wang, B., Zhang, B., Meng, H., Lin, X., Du, J., et al. (2022) · Journal of Hazardous Materials · doi:10.1016/j.jhazmat.2022.128459 · Cited by 249
The molecular athlete: exercise physiology from mechanisms to medals
Furrer, R., Hawley, J. A., & Handschin, C. (2023) · Physiological Reviews · doi:10.1152/physrev.00017.2022 · Cited by 253
A cellular taxonomy of the adult human spinal cord
Yadav, A., Matson, K. J. E., Li, L., Hua, I., Petrescu, J., Kang, K., Alkaslasi, M. R., Lee, D. I., Hasan, S., Galuta, A., et al. (2023) · Neuron · doi:10.1016/j.neuron.2023.01.007 · Cited by 220
Self-citationBlum, J. A., Klemm, S., Shadrach, J. L., Guttenplan, K. A., Nakayama, L., Kathiria, A., Hoang, P. T., Gautier, O., Kaltschmidt, J. A., Greenleaf, W. J., et al. (2021) · Nature Neuroscience · doi:10.1038/s41593-020-00795-0 · Cited by 210
Metadata
- Authors
- Alkaslasi, M. R., Piccus, Z. E., Hareendran, S., Silberberg, H., Chen, L., Zhang, Y., Petros, T. J., & Le Pichon, C. E.
- Affiliations
- National Institutes of Health (US)
- Venue
- Nature Communications
- Published
- 2021-04-30
- Volume
- 12
- Issue
- 1
- Pages
- 2471-2471
- ISSN
- 2041-1723 (ISSN-L)
- PMC
- PMC8087807
- OpenAlex
- W3159019277
- Cited by
- 163
- References
- 71
- Citations by year
- 2026: 29 · 2025: 27 · 2024: 33 · 2023: 46 · 2022: 20 · 2021: 6
- FWCI
- 8.23
- Type
- journal article
- Language
- en
- Open access
- gold
- doi.org
- Locations
- Nature Communications (publishedVersion, cc-by)
- bioRxiv (Cold Spring Harbor Laboratory) (acceptedVersion, public-domain)
- PubMed Central (publishedVersion, cc-by)
- PubMed (publishedVersion)
- RePEc: Research Papers in Economics (submittedVersion)
- DOAJ (DOAJ: Directory of Open Access Journals) (submittedVersion, cc-by-sa)
- Funders
- U.S. Department of Health & Human Services | National Institutes of Health (ZIA-HD008966)
- NIH Intramural Research Program
- Topics
- Life Sciences › Biochemistry, Genetics and Molecular Biology › Molecular Biology › Single-cell and spatial transcriptomics
- Life Sciences › Neuroscience › Cellular and Molecular Neuroscience › Neuroscience and Neuropharmacology Research
- Health Sciences › Medicine › Surgery › Congenital gastrointestinal and neural anomalies
- Keywords
- cholinergic neurons, spinal cord, cholinergic interneurons, motor neurons, motor neuron subtypes, neuronal heterogeneity, transcriptomic classification, single-nucleus RNA sequencing, autonomic regulation, motor control
- MeSH terms
- RNA-Seq, Animals, Cell Nucleus, Female, Interneurons, Male, Mice, Transgenic, Motor Neurons, Spinal Cord, In Situ Hybridization, Solitary Nucleus, Mice, Single-Cell Analysis, Cholinergic Neurons, Transcriptome
About these checks
Registry, retraction, Cites and statistics results are computed, not judged, with one exception: a printed reference that no index lists is read once by a model before it counts as a citation error. Claims are extracted by a model and kept only when their quote appears verbatim in the text; each cited source is then checked, with a model’s help, for whether it says what the claim relies on. Those verdicts can be wrong — read the claim’s quote and the cited source before relying on one.
Statistics and arithmetic are recomputed, not judged.
Confidence bands are shown only for fields calibrated on our annotated test set. None is calibrated yet, so no band is shown.
What counts as a claim ›How we measure confidence ›How we check this ›
Are you an author, or do you see a problem with this page? Request a review
