

The DOI matches its Crossref record; 62 of the 63 references it cites were found in a registry or an index.
Spearheading future omics analyses using dyngen, a multi-modal simulator of single cells
Open accessPublished version of a preprint
Abstract
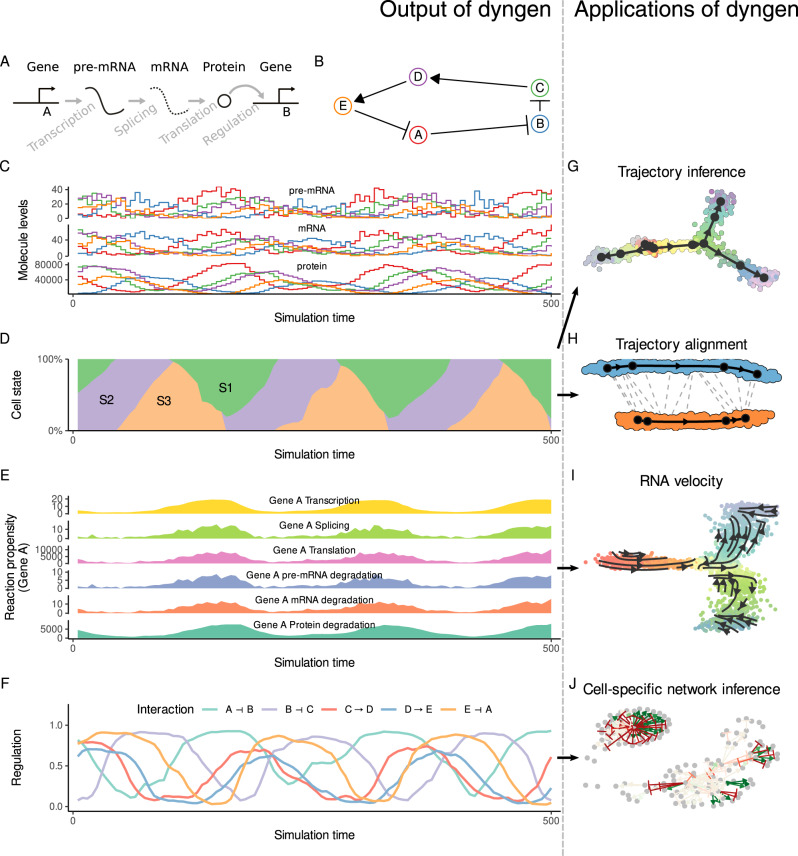
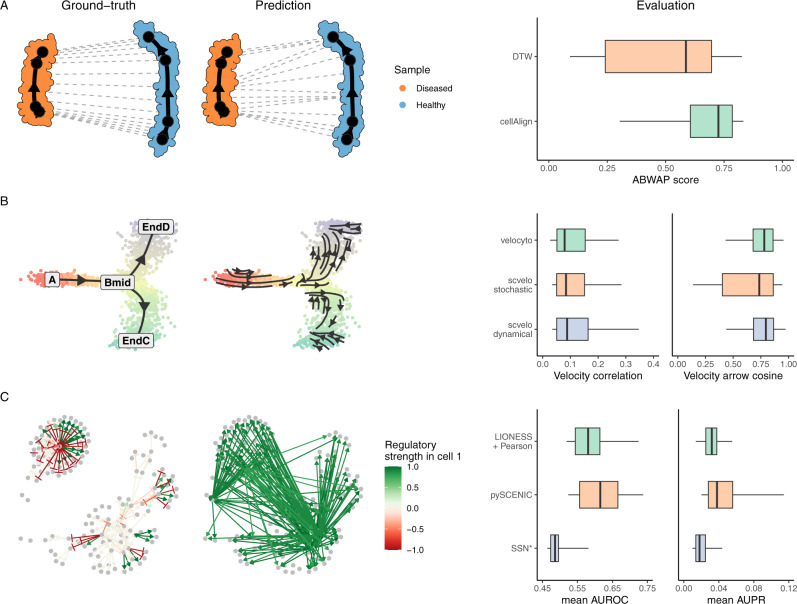
We present dyngen, a multi-modal simulation engine for studying dynamic cellular processes at single-cell resolution. dyngen is more flexible than current single-cell simulation engines, and allows better method development and benchmarking, thereby stimulating development and testing of computational methods. We demonstrate its potential for spearheading computational methods on three applications: aligning cell developmental trajectories, cell-specific regulatory network inference and estimation of RNA velocity.
Overview
The claims and statistics of this paper haven’t been checked yet.
Run the check — free, no account needed. It reads the open-access text and checks the sources it cites.
Integrity signals
Registry
Cites
Statistics
Figures
Verification
Claims the paper makes
The claims and statistics of this paper haven’t been checked yet.
Run the check — free, no account needed. It reads the open-access text and checks the sources it cites.
Self-check
Percentages, sums and reported differences re-computed from the paper’s own numbers.
The self-check needs the paper’s full text.
Citations
Cites
Wickham, H., Averick, M., Bryan, J., Chang, W., McGowan, L., François, R., Grolemund, G., Hayes, A., Henry, L., Hester, J., et al. (2019) · Journal of Open Source Software · doi:10.21105/joss.01686 · Cited by 22,138
A Simple Sequentially Rejective Multiple Test Procedure
(1979) · Scandinavian Journal of Statistics · doi:10.2307/4615733 · Cited by 21,526
Exact stochastic simulation of coupled chemical reactions
Gillespie, D. T. (1977) · The Journal of Physical Chemistry · doi:10.1021/j100540a008 · Cited by 10,215
Double-slit photoelectron interference in strong-field ionization of the neon dimer
Kunitski, M., Eicke, N., Huber, P., Köhler, J., Zeller, S., Voigtsberger, J., Schlott, N., Henrichs, K., Sann, H., Trinter, F., et al. (2019) · Institutional Repository of Leibniz Universität Hannover (Leibniz Universität Hannover) · doi:10.15488/5174 · Cited by 8,378
Global quantification of mammalian gene expression control
Schwanhäusser, B., Busse, D., Li, N., Dittmar, G., Schuchhardt, J., Wolf, J., Chen, W., & Selbach, M. (2011) · Nature · doi:10.1038/nature10098 · Cited by 6,566
Scenic: single-cell regulatory network inference and clustering.
Aibar, S., González-Blas, C. B., Moerman, T., Huynh-Thu, V. A., Imrichova, H., Hulselmans, G., Rambow, F., Marine, J.-C., Geurts, P., Aerts, J., et al. (2017) · Nature Methods · doi:10.1038/nmeth.4463 · Cited by 6,520
La Manno, G., Soldatov, R., Zeisel, A., Braun, E., Hochgerner, H., Petukhov, V., Lidschreiber, K., Kastriti, M. E., Lönnerberg, P., Furlan, A., et al. (2018) · Nature · doi:10.1038/s41586-018-0414-6 · Cited by 4,118
Slingshot: cell lineage and pseudotime inference for single-cell transcriptomics
Street, K., Risso, D., Fletcher, R. B., Das, D., Ngai, J., Yosef, N., Purdom, E., & Dudoit, S. (2018) · BMC Genomics · doi:10.1186/s12864-018-4772-0 · Cited by 3,159
Generalizing RNA velocity to transient cell states through dynamical modeling
Bergen, V., Lange, M., Peidli, S., Wolf, F. A., & Theis, F. J. (2020) · Nature Biotechnology · doi:10.1038/s41587-020-0591-3 · Cited by 2,951
Current best practices in single-cell RNA-seq analysis: a tutorial
Luecken, M. D., & Theis, F. J. (2019) · Molecular Systems Biology · doi:10.15252/msb.20188746 · Cited by 2,231
Research works printed but not linked: 1
- Kuijjer, M. L., Tung, M., Yuan, G., Quackenbush, J. & Glass, K. Estimating sample-specific regulatory networks. iScience. 14, 226–240 https://doi.org/10.1016/j.isci.2019.03.021 (2019). · DOI
Cited by
Sorted by citations
Differential abundance testing on single-cell data using k-nearest neighbor graphs
Dann, E., Henderson, N. C., Teichmann, S. A., Morgan, M. D., & Marioni, J. C. (2022) · Nature Biotechnology · doi:10.1038/s41587-021-01033-z · Cited by 938
CellRank for directed single-cell fate mapping
Lange, M., Bergen, V., Klein, M., Setty, M. N., Reuter, B., Bakhti, M., Lickert, H., Ansari, M., Gote-Schniering, J., Schiller, H. B., et al. (2022) · Nature Methods · doi:10.1038/s41592-021-01346-6 · Cited by 783
Applications of single-cell RNA sequencing in drug discovery and development
de Sande, B. V., Lee, J. S., Mutasa-Gottgens, E., Naughton, B. J., Bacon, W., Manning, J. R., Wang, Y., Pollard, J. R., Mendez, M., Hill, J., et al. (2023) · Nature Reviews Drug Discovery · doi:10.1038/s41573-023-00688-4 · Cited by 462
Potential and limitations of digital twins to achieve the Sustainable Development Goals
Tzachor, A., Sabri, S., Richards, C. E., Rajabifard, A., & Acuto, M. (2022) · Nature Sustainability · doi:10.1038/s41893-022-00923-7 · Cited by 224
Gorin, G., Fang, M., Chari, T., & Pachter, L. (2022) · PLOS Computational Biology · doi:10.1371/journal.pcbi.1010492 · Cited by 186
Metadata
- Authors
- Cannoodt, R., Saelens, W., Deconinck, L., & Saeys, Y.
- Affiliations
- Ghent University (BE)
- Vlaams Instituut voor Biotechnologie (BE)
- Corresponding author
- Saeys, Yvan
- Venue
- Nature Communications
- Published
- 2021-06-24
- Volume
- 12
- Issue
- 1
- Pages
- 3942-3942
- ISSN
- 2041-1723 (ISSN-L)
- PMC
- PMC8225657
- OpenAlex
- W3174608384
- Cited by
- 124
- References
- 63
- Citations by year
- 2026: 16 · 2025: 19 · 2024: 28 · 2023: 27 · 2022: 17 · 2021: 11
- FWCI
- 7.06
- Type
- journal article
- Language
- en
- Open access
- gold
- doi.org
- Locations
- Nature Communications (publishedVersion, cc-by)
- bioRxiv (Cold Spring Harbor Laboratory) (acceptedVersion, cc-by)
- PubMed Central (publishedVersion, cc-by)
- PubMed (publishedVersion)
- Ghent University Academic Bibliography (Ghent University) (submittedVersion, cc-by)
- Infoscience (Ecole Polytechnique Fédérale de Lausanne) (submittedVersion, cc-by-nc-nd)
- RePEc: Research Papers in Economics (submittedVersion)
- DOAJ (DOAJ: Directory of Open Access Journals) (submittedVersion, cc-by-sa)
- Funders
- Silicon Valley Community Foundation
- Chan Zuckerberg Initiative
- Vlaamse regering
- Topics
- Life Sciences › Biochemistry, Genetics and Molecular Biology › Molecular Biology › Single-cell and spatial transcriptomics
- Life Sciences › Biochemistry, Genetics and Molecular Biology › Molecular Biology › Gene Regulatory Network Analysis
- Life Sciences › Biochemistry, Genetics and Molecular Biology › Molecular Biology › Bioinformatics and Genomic Networks
- Keywords
- single-cell simulation, regulatory network inference, RNA velocity, single-cell omics
- MeSH terms
- Algorithms, Computer Simulation, Computational Biology, Benchmarking, Gene Expression Profiling, Gene Regulatory Networks, Single-Cell Analysis
About these checks
Registry, retraction, Cites and statistics results are computed, not judged, with one exception: a printed reference that no index lists is read once by a model before it counts as a citation error. Claims are extracted by a model and kept only when their quote appears verbatim in the text; each cited source is then checked, with a model’s help, for whether it says what the claim relies on. Those verdicts can be wrong — read the claim’s quote and the cited source before relying on one.
Statistics and arithmetic are recomputed, not judged.
Confidence bands are shown only for fields calibrated on our annotated test set. None is calibrated yet, so no band is shown.
What counts as a claim ›How we measure confidence ›How we check this ›
Are you an author, or do you see a problem with this page? Request a review
