

The DOI matches its Crossref record; 51 of the 51 references it cites were found in a registry or an index.
TET2 mutations are associated with hypermethylation at key regulatory enhancers in normal and malignant hematopoiesis
Open accessAbstract
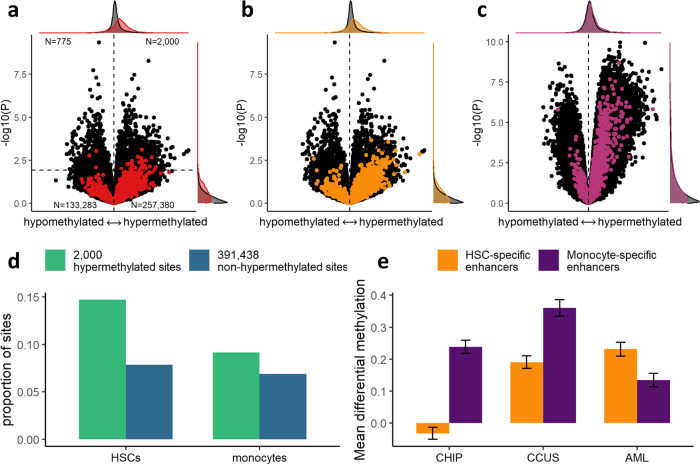
Mutations in the epigenetic modifier TET2 are frequent in myeloid malignancies and clonal hematopoiesis of indeterminate potential (CHIP) and clonal cytopenia of undetermined significance (CCUS). Here, we investigate associations between TET2 mutations and DNA methylation in whole blood in 305 elderly twins, 15 patients with CCUS and 18 healthy controls. We find that TET2 mutations are associated with DNA hypermethylation at enhancer sites in whole blood in CHIP and in both granulocytes and mononuclear cells in CCUS. These hypermethylated sites are associated with leukocyte function and immune response and ETS-related and C/EBP-related transcription factor motifs. While the majority of TET2- associated hypermethylation sites are shared between CHIP and in AML, we find a set of AML-specific hypermethylated loci at active enhancer elements in hematopoietic stem cells. In summary, we show that TET2 mutations is associated with hypermethylated enhancers involved in myeloid differentiation in both CHIP, CCUS and AML patients.
Overview
The claims and statistics of this paper haven’t been checked yet.
Run the check — free, no account needed. It reads the open-access text and checks the sources it cites.
Integrity signals
Registry
Cites
Statistics
Figures
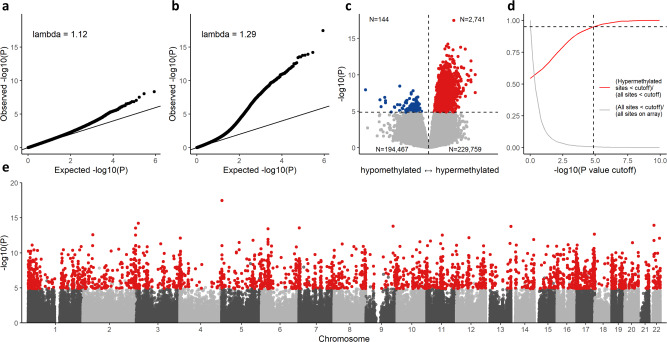
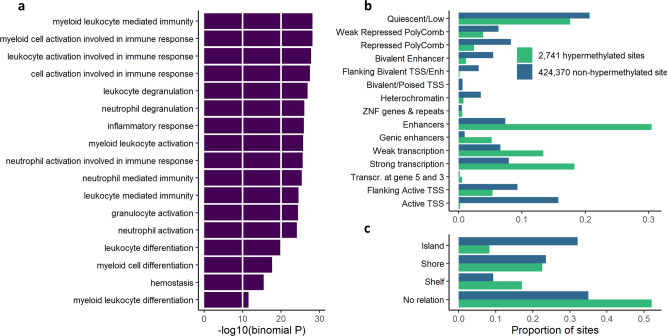
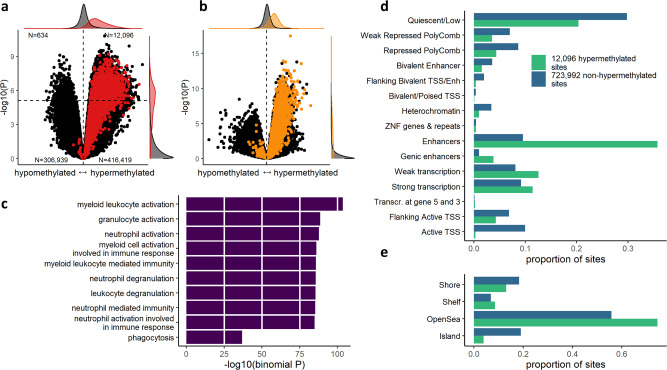
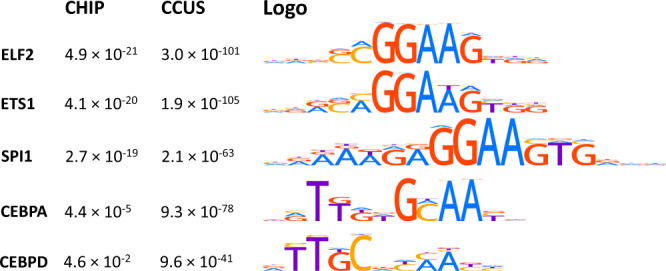
Verification
Claims the paper makes
The claims and statistics of this paper haven’t been checked yet.
Run the check — free, no account needed. It reads the open-access text and checks the sources it cites.
Claims other papers make about this one
Each is checked against this paper’s own text: does it say what the citing paper says it does?
The source backs part of the claim, not all of it — or backs it for a different population, condition or comparison.
In the citing paper
“Moreover, hypermethylation in and around PU.1 DNA-binding sites in preleukemic hematopoietic stem and progenitor cells (28) further supports that perturbed PU.1-dependent gene regulation may precede AML.”
From PU.1-Dependent Enhancer Inhibition Separates Tet2 -Deficient Hematopoiesis from Malignant Transformation (2022) · cites this paper as [28]
Experimental — accuracy not yet measuredThe source backs part of the claim, not all of it — or backs it for a different population, condition or comparison.
In the citing paper
“Sites with aberrant DNA methylation in TET2 or DNMT3A mutant cells are enriched for several key hematopoiesis regulating TF, including PU.1 (28, 45)”
From PU.1-Dependent Enhancer Inhibition Separates Tet2 -Deficient Hematopoiesis from Malignant Transformation (2022) · cites this paper as [28]
Experimental — accuracy not yet measuredThe source backs part of the claim, not all of it — or backs it for a different population, condition or comparison.
In the citing paper
“Altered DNA methylation is prevalent in the elderly, such as observed and well characterized in ARCH (28), which often precedes AML (5).”
From PU.1-Dependent Enhancer Inhibition Separates Tet2 -Deficient Hematopoiesis from Malignant Transformation (2022) · cites this paper as [28]
Experimental — accuracy not yet measuredThe source backs part of the claim, not all of it — or backs it for a different population, condition or comparison.
In the citing paper
“Consistently, TET2-mutant immature and myeloid cells present with hypermethylation of active enhancers and perturbed TF activity (28, 32, 53).”
From PU.1-Dependent Enhancer Inhibition Separates Tet2 -Deficient Hematopoiesis from Malignant Transformation (2022) · cites this paper as [28]
Experimental — accuracy not yet measured
Self-check
Percentages, sums and reported differences re-computed from the paper’s own numbers.
The self-check needs the paper’s full text.
Citations
Cites
Fast and accurate short read alignment with Burrows-Wheeler transform
Li, H., & Durbin, R. (2009) · Bioinformatics · doi:10.1093/bioinformatics/btp324 · Cited by 58,607
Fast and accurate long-read alignment with Burrows-Wheeler transform.
Li, H., & Durbin, R. (2010) · Bioinformatics · doi:10.1093/bioinformatics/btp698 · Cited by 12,063
Smyth, G. K. (2004) · Statistical Applications in Genetics and Molecular Biology · doi:10.2202/1544-6115.1027 · Cited by 11,829
Integrative analysis of 111 reference human epigenomes
Roadmap Epigenomics Consortium, Kundaje, A., Meuleman, W., Ernst, J., Bilenky, M., Yen, A., Heravi-Moussavi, A., Kheradpour, P., Zhang, Z., Wang, J., et al. (2015) · Nature · doi:10.1038/nature14248 · Cited by 6,368
Age-related clonal hematopoiesis associated with adverse outcomes
Jaiswal, S., Fontanillas, P., Flannick, J., Manning, A., Grauman, P. V., Mar, B. G., Lindsley, R. C., Mermel, C. H., Burtt, N., Chavez, A., et al. (2014) · New England Journal of Medicine · doi:10.1056/nejmoa1408617 · Cited by 4,841
GREAT improves functional interpretation of cis-regulatory regions
McLean, C. Y., Bristor, D., Hiller, M., Clarke, S. L., Schaar, B. T., Lowe, C. B., Wenger, A. M., & Bejerano, G. (2010) · Nature Biotechnology · doi:10.1038/nbt.1630 · Cited by 4,502
Aryee, M. J., Jaffe, A. E., Bravo, H. C., Ladd‐Acosta, C., Feinberg, A. P., Hansen, K. D., & Irizarry, R. A. (2014) · Bioinformatics · doi:10.1093/bioinformatics/btu049 · Cited by 4,389
Haplotype-based variant detection from short-read sequencing
Garrison, E., & Marth, G. (2012) · arXiv · doi:10.48550/arxiv.1207.3907 · Cited by 3,700
Clonal hematopoiesis and blood-cancer risk inferred from blood DNA sequence
Genovese, G., Kähler, A. K., Handsaker, R. E., Lindberg, J., Rose, S. A., Bakhoum, S. F., Chambert, K., Mick, E., Neale, B. M., Fromer, M., et al. (2014) · New England Journal of Medicine · doi:10.1056/nejmoa1409405 · Cited by 3,531
DNA methylation arrays as surrogate measures of cell mixture distribution
Houseman, E. A., Accomando, W. P., Koestler, D. C., Christensen, B. C., Marsit, C. J., Nelson, H. H., Wiencke, J. K., & Kelsey, K. T. (2012) · BMC Bioinformatics · doi:10.1186/1471-2105-13-86 · Cited by 3,175
Cited by
Sorted by citations
Jakobsen, N. A., Turkalj, S., Zeng, A. G. X., Stoilova, B., Metzner, M., Rahmig, S., Nagree, M. S., Shah, S., Moore, R., Usukhbayar, B., et al. (2024) · Cell Stem Cell · doi:10.1016/j.stem.2024.05.010 · Cited by 130
Uddin, M. M., Nguyen, N. Q., Yu, B., Brody, J. A., Pampana, A., Nakao, T., Fornage, M., Bressler, J., Sotoodehnia, N., Weinstock, J. S., et al. (2022) · Nature Communications · doi:10.1038/s41467-022-33093-3 · Cited by 101
McClatchy, J., Strogantsev, R., Wolfe, E., Lin, H., Mohammadhosseini, M., Davis, B. A., Eden, C. O., Goldman, D., Fleming, W., Conley, P., et al. (2023) · Nature Communications · doi:10.1038/s41467-023-43697-y · Cited by 86
Loss of TET2 in human hematopoietic stem cells alters the development and function of neutrophils
Encabo, H. H., Aramburu, I. V., Albornoz, M. G., Piganeau, M., Wood, H. J., Song, A., Ferrelli, A., Sharma, A., Minutti, C. M., Domart, M., et al. (2023) · Cell stem cell · doi:10.1016/j.stem.2023.05.004 · Cited by 85
The dual role of autophagy in acute myeloid leukemia
Seo, W., Silwal, P., Song, I., & Jo, E. (2022) · Journal of Hematology & Oncology · doi:10.1186/s13045-022-01262-y · Cited by 67
Metadata
- Authors
- Tulstrup, M., Soerensen, M., Hansen, J. W., Gillberg, L., Needhamsen, M., Kaastrup, K., Helin, K., Christensen, K., Weischenfeldt, J., & Grønbæk, K.
- Affiliations
- University of Copenhagen (DK)
- University of Southern Denmark (DK)
- Karolinska Institutet (SE)
- Corresponding author
- Weischenfeldt, Joachim
- Grønbæk, Kirsten
- ORCID
- Venue
- Nature Communications
- Published
- 2021-10-18
- Volume
- 12
- Issue
- 1
- Pages
- 6061-6061
- ISSN
- 2041-1723 (ISSN-L)
- PMC
- PMC8523747
- OpenAlex
- W3205085619
- Cited by
- 108
- References
- 50
- Citations by year
- 2026: 19 · 2025: 19 · 2024: 17 · 2023: 30 · 2022: 23
- FWCI
- 12.25
- Type
- journal article
- Language
- en
- Open access
- gold
- doi.org
- Locations
- Nature Communications (publishedVersion, cc-by)
- PubMed Central (publishedVersion, cc-by)
- PubMed (publishedVersion)
- Research at the University of Copenhagen (University of Copenhagen) (publishedVersion, cc-by)
- University of Southern Denmark Research Portal (University of Southern Denmark) (submittedVersion, cc-by)
- RePEc: Research Papers in Economics (submittedVersion)
- DOAJ (DOAJ: Directory of Open Access Journals) (submittedVersion, cc-by-sa)
- Funders
- Novo Nordisk Fonden (NNF17CC0027852)
- Topics
- Health Sciences › Medicine › Hematology › Acute Myeloid Leukemia Research
- Life Sciences › Biochemistry, Genetics and Molecular Biology › Molecular Biology › Epigenetics and DNA Methylation
- Life Sciences › Biochemistry, Genetics and Molecular Biology › Molecular Biology › Genomics and Chromatin Dynamics
- Keywords
- TET2 mutation, DNA hypermethylation, clonal hematopoiesis of indeterminate potential, clonal cytopenia of undetermined significance, acute myeloid leukemia, hematopoietic stem cells, myeloid differentiation, leukocyte function, immune response, transcription factor binding motifs, epigenetic regulators
- MeSH terms
- DNA Methyltransferase 3A, DNA (Cytosine-5-)-Methyltransferases, DNA-Binding Proteins, Enhancer Elements, Genetic, Hematopoiesis, Hematopoietic Stem Cells, Humans, Mutation, Myeloproliferative Disorders, Transcription Factors, DNA Methylation, Dioxygenases
About these checks
Registry, retraction, Cites and statistics results are computed, not judged, with one exception: a printed reference that no index lists is read once by a model before it counts as a citation error. Claims are extracted by a model and kept only when their quote appears verbatim in the text; each cited source is then checked, with a model’s help, for whether it says what the claim relies on. Those verdicts can be wrong — read the claim’s quote and the cited source before relying on one.
Statistics and arithmetic are recomputed, not judged.
Confidence bands are shown only for fields calibrated on our annotated test set. None is calibrated yet, so no band is shown.
What counts as a claim ›How we measure confidence ›How we check this ›
Are you an author, or do you see a problem with this page? Request a review
