

The DOI matches its Crossref record; 62 of the 62 references it cites were found in a registry or an index.
Accurate recognition of colorectal cancer with semi-supervised deep learning on pathological images
Open accessPublished version of a preprint
Abstract
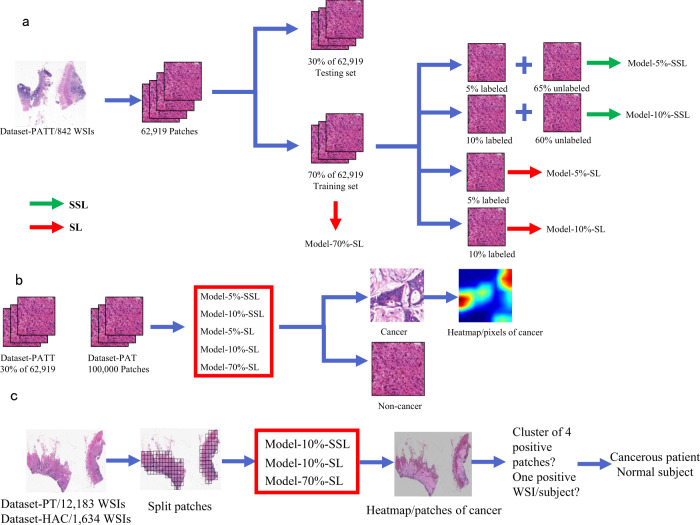
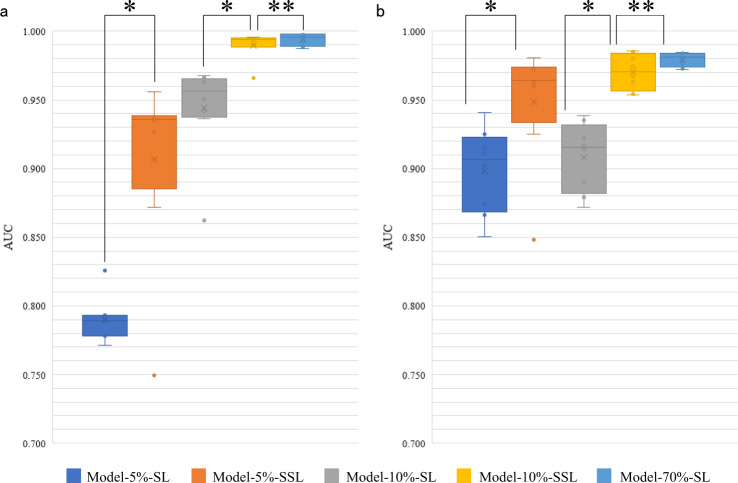
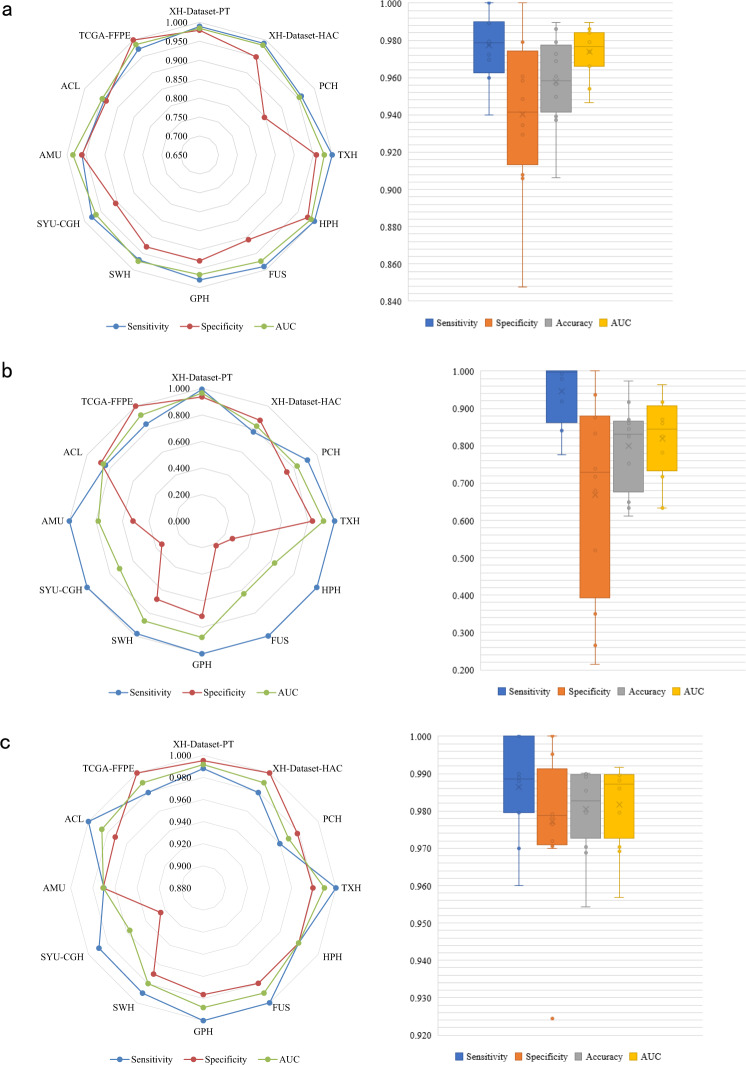
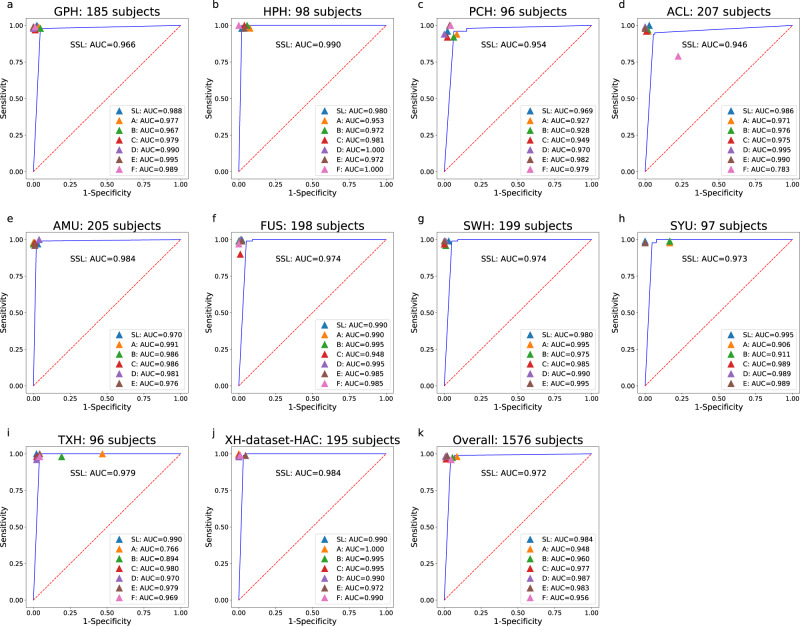
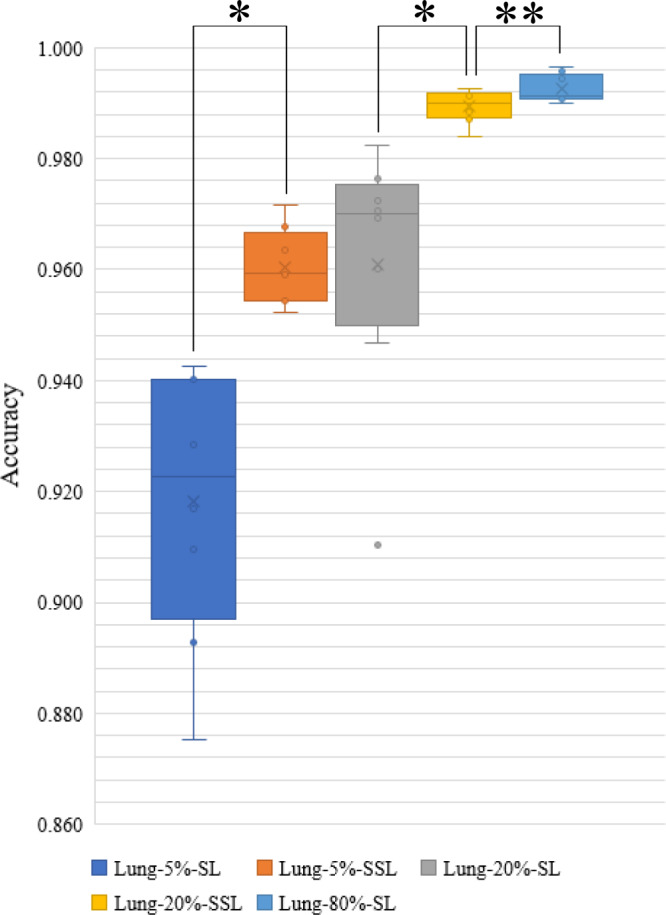
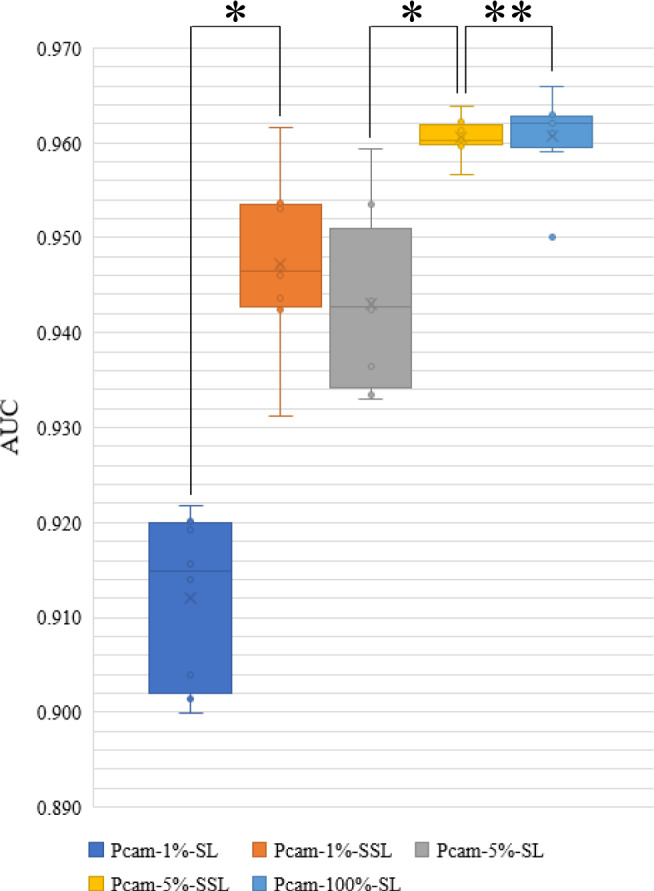
Machine-assisted pathological recognition has been focused on supervised learning (SL) that suffers from a significant annotation bottleneck. We propose a semi-supervised learning (SSL) method based on the mean teacher architecture using 13,111 whole slide images of colorectal cancer from 8803 subjects from 13 independent centers. SSL (~3150 labeled, ~40,950 unlabeled; ~6300 labeled, ~37,800 unlabeled patches) performs significantly better than the SL. No significant difference is found between SSL (~6300 labeled, ~37,800 unlabeled) and SL (~44,100 labeled) at patch-level diagnoses (area under the curve (AUC): 0.980 ± 0.014 vs. 0.987 ± 0.008, P value = 0.134) and patient-level diagnoses (AUC: 0.974 ± 0.013 vs. 0.980 ± 0.010, P value = 0.117), which is close to human pathologists (average AUC: 0.969). The evaluation on 15,000 lung and 294,912 lymph node images also confirm SSL can achieve similar performance as that of SL with massive annotations. SSL dramatically reduces the annotations, which has great potential to effectively build expert-level pathological artificial intelligence platforms in practice.
Overview
The claims and statistics of this paper haven’t been checked yet.
Run the check — free, no account needed. It reads the open-access text and checks the sources it cites.
Integrity signals
Registry
Cites
Statistics
Figures
Verification
Claims the paper makes
The claims and statistics of this paper haven’t been checked yet.
Run the check — free, no account needed. It reads the open-access text and checks the sources it cites.
Claims other papers make about this one
Each is checked against this paper’s own text: does it say what the citing paper says it does?
In the citing paper
“Histopathologic classification studies have been reported in colorectal cancer (70,71).”
From Artificial Intelligence in Oncology: Current Landscape, Challenges, and Future Directions (2024) · cites this paper as [71]
Self-check
Percentages, sums and reported differences re-computed from the paper’s own numbers.
The self-check needs the paper’s full text.
Citations
Cites
Deep Residual Learning for Image Recognition
He, K., Zhang, X., Ren, S., & Sun, J. (2016) · 2016 IEEE Conference on Computer Vision and Pattern Recognition (CVPR) · doi:10.1109/cvpr.2016.90 · Cited by 235,474
Very Deep Convolutional Networks for Large-Scale Image Recognition
Simonyan, K., & Zisserman, A. (2014) · arXiv · doi:10.48550/arxiv.1409.1556 · Cited by 114,148
ImageNet: A large-scale hierarchical image database
Deng, J., Dong, W., Socher, R., Li, L.-J., Li, K., & Fei-Fei, L. (2009) · 2009 IEEE Conference on Computer Vision and Pattern Recognition · doi:10.1109/cvpr.2009.5206848 · Cited by 65,333
Rethinking the Inception Architecture for Computer Vision
Szegedy, C., Vanhoucke, V., Ioffe, S., Shlens, J., & Wojna, Z. (2016) · 2016 IEEE Conference on Computer Vision and Pattern Recognition (CVPR) · doi:10.1109/cvpr.2016.308 · Cited by 32,138
Advances in neural information processing systems 7
Cios, K. J., & Shields, M. E. (1997) · Neurocomputing · doi:10.1016/s0925-2312(97)90018-7 · Cited by 22,093
Dermatologist-level classification of skin cancer with deep neural networks
Esteva, A., Kuprel, B., Novoa, R. A., Ko, J., Swetter, S. M., Blau, H. M., & Thrun, S. (2017) · Nature · doi:10.1038/nature21056 · Cited by 14,362
Global patterns and trends in colorectal cancer incidence and mortality
Arnold, M., Sierra, M. S., Laversanne, M., Soerjomataram, I., Jemal, A., & Bray, F. (2016) · Gut · doi:10.1136/gutjnl-2015-310912 · Cited by 5,413
Chapelle, O., Schölkopf, B., & Zien, A. (2006) · The MIT Press eBooks · doi:10.7551/mitpress/9780262033589.001.0001 · Cited by 4,642
Tarvainen, A., & Valpola, H. (2017) · arXiv · doi:10.48550/arxiv.1703.01780 · Cited by 4,275
Ehteshami Bejnordi, B., Veta, M., Johannes van Diest, P., van Ginneken, B., Karssemeijer, N., Litjens, G., van der Laak, J. A. W. M., and the CAMELYON16 Consortium, Hermsen, M., Manson, Q. F., et al. (2017) · JAMA · doi:10.1001/jama.2017.14585 · Cited by 3,293
Coudray, N., Ocampo, P. S., Sakellaropoulos, T., Narula, N., Snuderl, M., Fenyö, D., Moreira, A. L., Razavian, N., & Tsirigos, A. (2018) · Nature Medicine · doi:10.1038/s41591-018-0177-5 · Cited by 2,930
Clinical-grade computational pathology using weakly supervised deep learning on whole slide images
Campanella, G., Hanna, M. G., Geneslaw, L., Miraflor, A., Werneck Krauss Silva, V., Busam, K. J., Brogi, E., Reuter, V. E., Klimstra, D. S., & Fuchs, T. J. (2019) · Nature Medicine · doi:10.1038/s41591-019-0508-1 · Cited by 2,799
Neural Networks: Tricks of the Trade: Second Edition
(2012) · Lecture Notes in Computer Science · doi:10.1007/978-3-642-35289-8 · Cited by 2,116
Sirinukunwattana, K., Raza, S. E. A., Tsang, Y.-W., Snead, D. R. J., Cree, I. A., & Rajpoot, N. M. (2016) · IEEE Transactions on Medical Imaging · doi:10.1109/tmi.2016.2525803 · Cited by 1,224
Kather, J. N., Krisam, J., Charoentong, P., Luedde, T., Herpel, E., Weis, C.-A., Gaiser, T., Marx, A., Valous, N. A., Ferber, D., et al. (2019) · PLOS Medicine · doi:10.1371/journal.pmed.1002730 · Cited by 1,082
Classification of breast cancer histology images using Convolutional Neural Networks
Araújo, T., Aresta, G., Castro, E., Rouco, J., Aguiar, P., Eloy, C., Polónia, A., & Campilho, A. (2017) · PLoS ONE · doi:10.1371/journal.pone.0177544 · Cited by 1,044
Machine Learning Methods for Histopathological Image Analysis
Komura, D., & Ishikawa, S. (2018) · Computational and Structural Biotechnology Journal · doi:10.1016/j.csbj.2018.01.001 · Cited by 937
Deep learning based tissue analysis predicts outcome in colorectal cancer
Bychkov, D., Linder, N., Turkki, R., Nordling, S., Kovanen, P. E., Verrill, C., Walliander, M., Lundin, M., Haglund, C., & Lundin, J. (2018) · Scientific Reports · doi:10.1038/s41598-018-21758-3 · Cited by 644
Deep learning for prediction of colorectal cancer outcome: a discovery and validation study
Skrede, O.-J., De Raedt, S., Kleppe, A., Hveem, T. S., Liestøl, K., Maddison, J., Askautrud, H. A., Pradhan, M., Nesheim, J. A., Albregtsen, F., et al. (2020) · The Lancet · doi:10.1016/s0140-6736(19)32998-8 · Cited by 627
Roa, Á. A. C., Basavanhally, A. N., Gonzalez, F. A., Gilmore, H. L., Feldman, M. D., Ganesan, S., Shih, N. N. C., Tomaszewski, J., & Madabhushi, A. (2014) · Proceedings of SPIE, the International Society for Optical Engineering/Proceedings of SPIE · doi:10.1117/12.2043872 · Cited by 621
Lung and Colon Cancer Histopathological Image Dataset (LC25000)Preprint
Borkowski, A., Bui, M. M., Thomas, L. B., Wilson, C. P., Deland, L. A., & Mastorides, S. (2019) · arXiv (Cornell University) · doi:10.48550/arxiv.1912.12142 · Cited by 611
Chen, Y.-J. Y.-J., Hua, K., Hsu, C.-H., Cheng, W.-H., & Hidayati, S. C. (2015) · OncoTargets and Therapy · doi:10.2147/ott.s80733 · Cited by 563
Assessment of algorithms for mitosis detection in breast cancer histopathology images
Veta, M., van Diest, P. J., Willems, S. M., Wang, H., Madabhushi, A., Cruz-Roa, Á., Gonzalez, F. A., Larsen, A., Vestergaard, J. S., Dahl, A. B., et al. (2014) · Medical Image Analysis · doi:10.1016/j.media.2014.11.010 · Cited by 480
Billion-scale semi-supervised learning for image classificationPreprint
Yalnız, İ. Z., Jeǵou, H., Chen, K., Paluri, M., & Mahajan, D. K. (2019) · arXiv (Cornell University) · doi:10.48550/arxiv.1905.00546 · Cited by 478
Rotation Equivariant CNNs for Digital Pathology
Veeling, B. S., Linmans, J., Winkens, J., Cohen, T., & Welling, M. (2018) · Lecture Notes in Computer Science · doi:10.1007/978-3-030-00934-2_24 · Cited by 476
Shape-Aware Semi-supervised 3D Semantic Segmentation for Medical Images
Li, S., Zhang, C., & He, X. (2020) · Lecture notes in computer science · doi:10.1007/978-3-030-59710-8_54 · Cited by 434
Xu, Y. L., Jia, Z., Wang, L.-B., Ai, Y., Zhang, F., Lai, M., & Chang, E. (2017) · BMC Bioinformatics · doi:10.1186/s12859-017-1685-x · Cited by 428
Semi-Supervised Medical Image Classification With Relation-Driven Self-Ensembling Model
Liu, Q., Yu, L., Luo, L., Dou, Q., & Heng, P. A. (2020) · IEEE Transactions on Medical Imaging · doi:10.1109/tmi.2020.2995518 · Cited by 330
Skin cancer diagnosis based on optimized convolutional neural network
Zhang, N., Cai, Y.-X., Wang, Y.-Y., Tian, Y., Wang, X., & Badami, B. (2019) · Artificial Intelligence in Medicine · doi:10.1016/j.artmed.2019.101756 · Cited by 325
Trends in the US and Canadian Pathologist Workforces From 2007 to 2017
Metter, D. M., Colgan, T. J., Leung, S. T., Timmons, C. F., & Park, J. Y. (2019) · JAMA Network Open · doi:10.1001/jamanetworkopen.2019.4337 · Cited by 293
Comparison of Commonly Used Image Interpolation Methods
Han, D. (2013) · International Conference on Computer Science and Electronics Engineering (ICCSEE) · doi:10.2991/iccsee.2013.391 · Cited by 241
CSCO colorectal cancer working group (2019) · Chinese Journal of Cancer Research · doi:10.21147/j.issn.1000-9604.2019.01.07 · Cited by 233
Cluster-based analysis of FMRI data
Heller, R., Stanley, D. A., Yekutieli, D., Rubin, N., & Benjamini, Y. (2006) · NeuroImage · doi:10.1016/j.neuroimage.2006.04.233 · Cited by 202
Accurate diagnosis of colorectal cancer based on histopathology images using artificial intelligence
Wang, K., Yu, G., Xu, C., Meng, X., Zhou, J., Zheng, C., Deng, Z., Shang, L., Liu, R., Su, S., et al. (2021) · BMC Medicine · doi:10.1186/s12916-021-01942-5 · Cited by 196
Self-citationFocalMix: Semi-Supervised Learning for 3D Medical Image Detection
Wang, D., Zhang, Y., Zhang, K., & Wang, L. (2020) · 2020 IEEE/CVF Conference on Computer Vision and Pattern Recognition (CVPR) · doi:10.1109/cvpr42600.2020.00401 · Cited by 157
Kainz, P., Pfeiffer, M., & Urschler, M. (2017) · PeerJ · doi:10.7717/peerj.3874 · Cited by 138
Breast Cancer Histopathological Image Classification: A Deep Learning ApproachPreprint
Motlagh, M. H., Jannesari, M., Es, H. A., Khosravi, P., Elemento, O., Totonchi, M., & Hajirasouliha, I. (2018) · bioRxiv (Cold Spring Harbor Laboratory) · doi:10.1101/242818 · Cited by 127
Sarı, C. T., & Gündüz-Demir, Ç. (2018) · IEEE Transactions on Medical Imaging · doi:10.1109/tmi.2018.2879369 · Cited by 122
Realistic Adversarial Data Augmentation for MR Image Segmentation
Chen, C., Qin, C., Qiu, H., Ouyang, C., Wang, S., Chen, L., Tarroni, G., Bai, W., & Rueckert, D. (2020) · Lecture notes in computer science · doi:10.1007/978-3-030-59710-8_65 · Cited by 110
Deep residual transfer learning for automatic diagnosis and grading of diabetic retinopathy
Martínez-Murcia, F. J., Ortíz, A., Ramı́rez, J., Górriz, J. M., & Cruz, R. (2020) · Neurocomputing · doi:10.1016/j.neucom.2020.04.148 · Cited by 107
Breast Cancer Histopathological Image Classification: A Deep Learning Approach
Jannesari, M., Habibzadeh, M., Es, H. A., Khosravi, P., Elemento, O., Totonchi, M., & Hajirasouliha, I. (2018) · IEEE International Conference on Bioinformatics and Biomedicine (BIBM) · doi:10.1109/bibm.2018.8621307 · Cited by 106
Cheplygina, V., de Bruijne, M., & Pluim, J. P. W. (2019) · Medical Image Analysis · doi:10.1016/j.media.2019.03.009 · Cited by 93
Classifications of Multispectral Colorectal Cancer Tissues Using Convolution Neural Network
Haj-Hassan, H., Chaddad, A., Harkouss, Y., Desrosiers, C., Toews, M., & Tanougast, C. (2017) · Journal of Pathology Informatics · doi:10.4103/jpi.jpi_47_16 · Cited by 81
Providing Pathology Support in Low-Income Countries
Sayed, S., Lukande, R. L., & Fleming, K. A. (2015) · Journal of Global Oncology · doi:10.1200/jgo.2015.000943 · Cited by 72
CSCO head and neck cancer working group (2019) · Chinese Journal of Cancer Research · doi:10.21147/j.issn.1000-9604.2019.01.05 · Cited by 68
Colorectal Cancer Classification using Deep Convolutional Networks - An Experimental Study
Ponzio, F., Macii, E., Ficarra, E., & Cataldo, S. D. (2018) · International Joint Conference on Biomedical Engineering Systems and Technologies (BIOSTEC) · doi:10.5220/0006643100580066 · Cited by 55
Local and Global Consistency Regularized Mean Teacher for Semi-supervised Nuclei Classification
Su, H., Shi, X., Cai, J., & Yang, L. (2019) · Lecture notes in computer science · doi:10.1007/978-3-030-32239-7_62 · Cited by 48
Self-citationCSCO thyroid cancer working group (2019) · Chinese Journal of Cancer Research · doi:10.21147/j.issn.1000-9604.2019.01.06 · Cited by 39
GAN-Based Image Enrichment in Digital Pathology Boosts Segmentation Accuracy
Gupta, L., Klinkhammer, B. M., Boor, P., Merhof, D., & Gadermayr, M. (2019) · Lecture notes in computer science · doi:10.1007/978-3-030-32239-7_70 · Cited by 37
Teacher-Student chain for efficient semi-supervised histology image classificationPreprint
Shaw, S., Pajak, M., Lisowska, A., Tsaftaris, S. A., & O'Neil, A. Q. (2020) · arXiv (Cornell University) · doi:10.48550/arxiv.2003.08797 · Cited by 26
Unsupervised Anomaly Detection In Digital Pathology Using GANs
Pocevičiūtė, M., Eilertsen, G., & Lundström, C. F. (2021) · IEEE International Symposium on Biomedical Imaging (ISBI) · doi:10.1109/isbi48211.2021.9434141 · Cited by 22
Texture Analysis of Abnormal Cell Images for Predicting the Continuum of Colorectal Cancer
Chaddad, A., & Tanougast, C. (2017) · Analytical Cellular Pathology · doi:10.1155/2017/8428102 · Cited by 21
Li, H., Han, X., Kang, Y., Shi, X., Yan, M., Tong, Z., Bu, Q., Cui, L., Feng, J. H., & Yang, L. (2020) · Lecture notes in computer science · doi:10.1007/978-3-030-59722-1_31 · Cited by 17
Self-citationPositive-Unlabeled Learning for Cell Detection in Histopathology Images with Incomplete Annotations
Zhao, Z., Pang, F., Liu, Z., & Ye, C. (2021) · Lecture notes in computer science · doi:10.1007/978-3-030-87237-3_49 · Cited by 16
Quality-Aware Semi-supervised Learning for CMR Segmentation
Ruijsink, B., Anton, E. P., Li, Y., Bai, W., Kerfoot, E., Razavi, R., & King, A. P. (2021) · Lecture notes in computer science · doi:10.1007/978-3-030-68107-4_10 · Cited by 14
Learning a low dimensional manifold of real cancer tissue with PathologyGANPreprint
Quiros, A. C., Murray‐Smith, R., & Yuan, K. (2020) · arXiv (Cornell University) · doi:10.48550/arxiv.2004.06517 · Cited by 9
An investigation of aggregated transfer learning for classification in digital pathology
Rai, T., Morisi, A., Bacci, B., Bacon, N. J., Thomas, S. A., Ragione, R. M. L., Bober, M. Z., & Wells, K. (2019) · SPIE Medical Imaging: Digital and Computational Pathology · doi:10.1117/12.2511754 · Cited by 8
Orientation-Disentangled Unsupervised Representation Learning for Computational PathologyPreprint
Lafarge, M. W., Pluim, J. P. W., & Veta, M. (2020) · arXiv (Cornell University) · doi:10.48550/arxiv.2008.11673 · Cited by 6
Damjanov, I. (2000) · Modern Pathology · doi:10.1038/modpathol.3880185 · Cited by 3
CSU-BME/pathology_SSL: pathology_SSL
Csu-Bme (2021) · Zenodo (CERN European Organization for Nuclear Research) · doi:10.5281/zenodo.5524324 · Cited by 1
Colorectal cancer datasets of semi-supervised deep learning
Yu, G. (2021) · Figshare · doi:10.6084/m9.figshare.15072546 · Cited by 1
Self-citationCSU-BME/pathology_SSL: pathology_SSL
CSU-BME (2021) · Zenodo (CERN European Organization for Nuclear Research) · doi:10.5281/zenodo.5524323 · Cited by 1
Research works printed but not linked: 2
- Prechelt, L. Neural Networks: Tricks of the Trade (Springer Berlin Heidelberg, 1998).
- Goodfellow, I., Bengio, Y. & Courville, A. Deep Learning 117 (The MIT Press, 2016).
Cited by
Sorted by citations
A pathology foundation model for cancer diagnosis and prognosis prediction
Wang, X., Zhao, J., Marostica, E., Yuan, W., Jin, J., Zhang, J., Li, R., Tang, H., Wang, K., Li, Y., et al. (2024) · Nature · doi:10.1038/s41586-024-07894-z · Cited by 580
Self-citationArtificial Intelligence in Oncology: Current Landscape, Challenges, and Future Directions
Lotter, W., Hassett, M. J., Schultz, N., Kehl, K. L., Van Allen, E. M., & Cerami, E. (2024) · Cancer Discovery · doi:10.1158/2159-8290.cd-23-1199 · Cited by 196
Li, Y., Yang, L., Zhang, S., Xu, Z., Qin, J., Shi, Y., Yu, P., Wang, Y., Bao, Z., Xia, Y., et al. (2023) · EClinicalMedicine · doi:10.1016/j.eclinm.2023.101834 · Cited by 169
Deep Learning on Histopathological Images for Colorectal Cancer Diagnosis: A Systematic Review
Davri, A. S., Birbas, E., Kanavos, T., Ntritsos, G., Γιαννακέας, Ν., Tzallas, A. T., & Batistatou, A. K. (2022) · Diagnostics · doi:10.3390/diagnostics12040837 · Cited by 144
Histopathology images predict multi-omics aberrations and prognoses in colorectal cancer patients
Tsai, P.-C., Lee, T.-H., Kuo, K.-C., Su, F.-Y., Lee, T.-L. M., Marostica, E., Ugai, T., Zhao, M., Lau, M. C., Väyrynen, J. P., et al. (2023) · Nature Communications · doi:10.1038/s41467-023-37179-4 · Cited by 136
Metadata
- Authors
- Yu, G., Sun, K., Xu, C., Shi, X.-H., Wu, C., Xie, T., Meng, R.-Q., Meng, X.-H., Wang, K.-S., Xiao, H.-M., & Deng, H.-W.
- Affiliations
- Central South University (CN)
- University of Oklahoma Health Sciences Center (US)
- Florida State University (US)
- Tulane University (US)
- Corresponding author
- Wang, Kuan-Song
- Xiao, Hong-Mei
- Deng, Hong-Wen
- ORCID
- Venue
- Nature Communications
- Published
- 2021-11-02
- Volume
- 12
- Issue
- 1
- Pages
- 6311-6311
- ISSN
- 2041-1723 (ISSN-L)
- PMC
- PMC8563931
- OpenAlex
- W3208123223
- Cited by
- 147
- References
- 60
- Citations by year
- 2026: 22 · 2025: 35 · 2024: 41 · 2023: 33 · 2022: 15 · 2021: 1
- FWCI
- 7.95
- Type
- journal article
- Language
- en
- Open access
- gold
- doi.org
- Locations
- Nature Communications (publishedVersion, cc-by)
- PubMed Central (publishedVersion, cc-by)
- PubMed (publishedVersion)
- DOAJ (DOAJ: Directory of Open Access Journals) (submittedVersion, cc-by-sa)
- Funders
- National Natural Science Foundation of China (#81471453, R01MH104680, R01MH107354, R01GM109068, 81972490)
- Science and Technology Program of Hunan Province (2020YJ004)
- National Institutes of Health
- National Institute on Aging (U19AG055373)
- National Institute of Mental Health (R01MH107354, R01MH104680)
- National Institute of General Medical Sciences (R01GM109068, P20GM109036)
- National Institute of Diabetes and Digestive and Kidney Diseases (R01DK115679)
- National Institute of Arthritis and Musculoskeletal and Skin Diseases (R01AR059781, R01AR069055)
- Topics
- Physical Sciences › Computer Science › Artificial Intelligence › AI in cancer detection
- Health Sciences › Medicine › Oncology › Colorectal Cancer Screening and Detection
- Health Sciences › Medicine › Radiology, Nuclear Medicine and Imaging › Radiomics and Machine Learning in Medical Imaging
- Keywords
- colorectal cancer, semi-supervised learning, whole slide images, pathological image classification, lung cancer, digital pathology, artificial intelligence in pathology
- MeSH terms
- Supervised Machine Learning, Deep Learning, Artificial Intelligence, Humans, Lung Neoplasms, Lymphatic Metastasis, ROC Curve, Colorectal Neoplasms, Neural Networks, Computer
About these checks
Registry, retraction, Cites and statistics results are computed, not judged, with one exception: a printed reference that no index lists is read once by a model before it counts as a citation error. Claims are extracted by a model and kept only when their quote appears verbatim in the text; each cited source is then checked, with a model’s help, for whether it says what the claim relies on. Those verdicts can be wrong — read the claim’s quote and the cited source before relying on one.
Statistics and arithmetic are recomputed, not judged.
Confidence bands are shown only for fields calibrated on our annotated test set. None is calibrated yet, so no band is shown.
What counts as a claim ›How we measure confidence ›How we check this ›
Are you an author, or do you see a problem with this page? Request a review
