Cited by 45Cellular Mechanics and InteractionsAxon Guidance and Neuronal SignalingProtein Kinase Regulation and GTPase Signaling

The DOI matches its Crossref record; 2 of the 2 references it cites were found in a registry or an index.

Cofilactin filaments regulate filopodial structure and dynamics in neuronal growth cones

Open access

Abstract

Cofilin is best known for its ability to sever actin filaments and facilitate cytoskeletal recycling inside of cells, but at higher concentrations in vitro, cofilin stabilizes a more flexible, hyper-twisted state of actin known as “cofilactin”. While this filament state is well studied, a structural role for cofilactin in dynamic cellular processes has not been observed. With a combination of cryo-electron tomography and fluorescence imaging in neuronal growth cones, we observe that filopodial actin filaments switch between a fascin-linked and a cofilin-decorated state, and that cofilactin is associated with a variety of dynamic events within filopodia. The switch to cofilactin filaments occurs in a graded fashion and correlates with a decline in fascin cross-linking within the filopodia, which is associated with curvature in the bundle. Our tomographic data reveal that the hyper-twisting of actin from cofilin binding leads to a rearrangement of filament packing, which largely excludes fascin from the base of filopodia. Our results provide mechanistic insight into the fundamentals of cytoskeletal remodeling inside of confined cellular spaces, and how the interplay between fascin and cofilin regulates the dynamics of searching filopodia.

Overview

The claims and statistics of this paper haven’t been checked yet.

Run the check — free, no account needed. It reads the open-access text and checks the sources it cites.

A few free checks a day · papers already verified open instantly · results are public

Integrity signals

Registry

Crossref · 10.1038/s41467-022-30116-x

Cites

2 of 2 references verified0 citation errors · 0 not checkable

Statistics

Figures

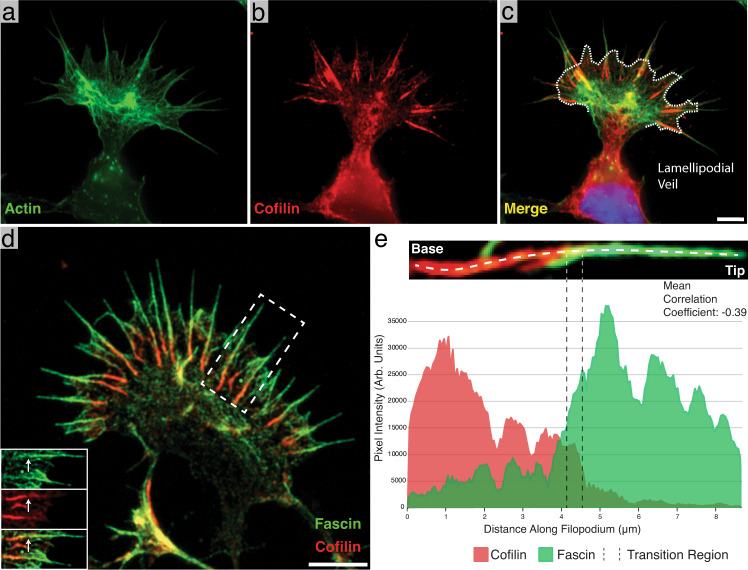
Fig. 1 Identification of cofilin-rich regions at the base of neuronal growth cone filopodia. a–c Immunofluorescence images of phalloidin (Alexa Fluor 488) alone (a), cofilin (Alexa Fluor 594) alone (b), and a merge of the two (c). Most of the cofilin signal emanates from linear aggregates near the base of filopodia. The white dashed line in c marks the position of the lamellipodial veil. d Merged immunofluorescence image of a growth cone with fascin (Alexa Fluor 488-green) and cofilin (Alexa Fluor 594-red) labeled, showing cofilin-rich regions at the base of filopodia as in c. Bottom-left inset: Split view of the boxed-out region. The white arrow points to the same location in each image and shows the point at which the fascin signal drops off and the cofilin signal intensifies. e Representative line scan intensity profile of a single filopodium showing the distribution of fascin and cofilin. The image above the graph shows a close-up view of the measured filopodium and the location where the line profile was drawn. The transition region is marked by two dashed lines. The images in a–c are representative images, but two independent experiments showed similar localization of cofilin and actin. d is a representative image from one of three independent experiments. Scale bars: (c) 5 µm (this also corresponds to a and b), d 5 µm. Source data are provided as a Source Data file.
Fig. 1 Identification of cofilin-rich regions at the base of neuronal growth cone filopodia. a–c Immunofluorescence images of phalloidin (Alexa Fluor 488) alone (a), cofilin (Alexa Fluor 594) alone (b), and a merge of the two (c). Most of the cofilin signal emanates from linear aggregates near the base of filopodia. The white dashed line in c marks the position of the lamellipodial veil. d Merged immunofluorescence image of a growth cone with fascin (Alexa Fluor 488-green) and cofilin (Alexa Fluor 594-red) labeled, showing cofilin-rich regions at the base of filopodia as in c. Bottom-left inset: Split view of the boxed-out region. The white arrow points to the same location in each image and shows the point at which the fascin signal drops off and the cofilin signal intensifies. e Representative line scan intensity profile of a single filopodium showing the distribution of fascin and cofilin. The image above the graph shows a close-up view of the measured filopodium and the location where the line profile was drawn. The transition region is marked by two dashed lines. The images in a–c are representative images, but two independent experiments showed similar localization of cofilin and actin. d is a representative image from one of three independent experiments. Scale bars: (c) 5 µm (this also corresponds to a and b), d 5 µm. Source data are provided as a Source Data file.CC BY · PubMed Central
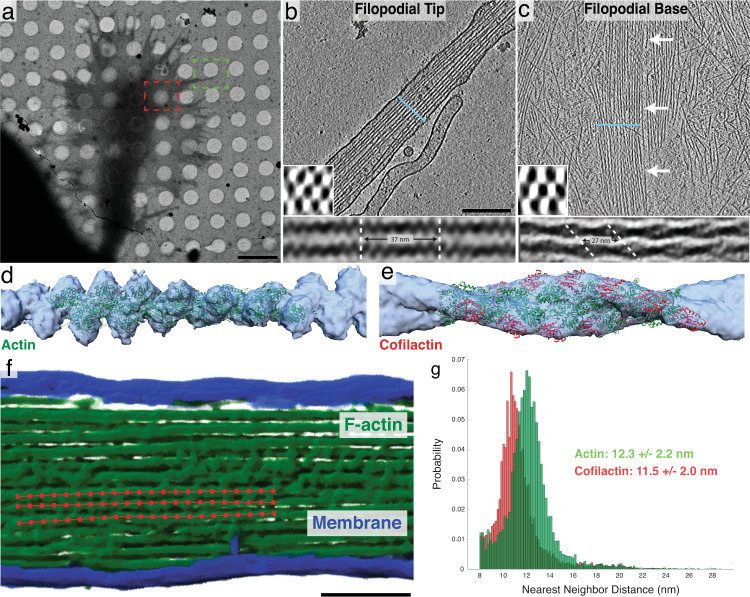
Fig. 2 Structural features of neuronal growth cone filopodia and their associated cofilactin bundles. a Overview image of a cryo-preserved growth cone on a Quantifoil EM grid. The green and red boxes represent growth cone regions similar to where the tomograms in b and c were imaged, respectively. b, c 5 nm-thick slices of tomograms from the tip (b) and base (c) of growth cone filopodia. In b, a bundle of actin filaments fills the entire cytoplasm. In c, branched networks of individual actin filaments can be seen surrounding a central bundle of hyper-twisted cofilactin filaments. White arrows point to the bundle. Lower-left insets: 68 nm-thick transverse cross-sections through each bundle, illustrating the hexagonal packing of filaments. The blue line in the main images show the plane from which the insets were taken. Bottom insets: Subtomogram averages of filament pairs in filopodial tips (below b) or in cofilactin bundles at the filopodial bases (below c). Cofilactin filaments have a shorter helical twist than F-actin and are out of phase with adjacent filaments. d EM map (blue) resulting from the subtomogram averaging of actin filaments in filopodial tips, and rigid body fitting of a previously reported atomic structure for F-actin (PDB ID: 6T1Y; green). e EM map (blue) resulting from the subtomogram averaging of cofilactin filaments near the base of filopodia, and rigid body fitting of a previously reported atomic structure of cofilactin (PDB ID: 3J0S; actin is green and cofilin is red). f Segmented filopodial protrusion with a schematic of filament centerlines overlaid (red). These lines are comprised of a series of points that were used for nearest neighbor analysis. g Nearest neighbor histograms showing the cumulative total of three normal actin filopodial bundles (green) and three cofilactin bundles (red). Scale bars: (a) 5 µm, (b) 200 nm (this also corresponds to the image in c), f 100 nm.
Fig. 2 Structural features of neuronal growth cone filopodia and their associated cofilactin bundles. a Overview image of a cryo-preserved growth cone on a Quantifoil EM grid. The green and red boxes represent growth cone regions similar to where the tomograms in b and c were imaged, respectively. b, c 5 nm-thick slices of tomograms from the tip (b) and base (c) of growth cone filopodia. In b, a bundle of actin filaments fills the entire cytoplasm. In c, branched networks of individual actin filaments can be seen surrounding a central bundle of hyper-twisted cofilactin filaments. White arrows point to the bundle. Lower-left insets: 68 nm-thick transverse cross-sections through each bundle, illustrating the hexagonal packing of filaments. The blue line in the main images show the plane from which the insets were taken. Bottom insets: Subtomogram averages of filament pairs in filopodial tips (below b) or in cofilactin bundles at the filopodial bases (below c). Cofilactin filaments have a shorter helical twist than F-actin and are out of phase with adjacent filaments. d EM map (blue) resulting from the subtomogram averaging of actin filaments in filopodial tips, and rigid body fitting of a previously reported atomic structure for F-actin (PDB ID: 6T1Y; green). e EM map (blue) resulting from the subtomogram averaging of cofilactin filaments near the base of filopodia, and rigid body fitting of a previously reported atomic structure of cofilactin (PDB ID: 3J0S; actin is green and cofilin is red). f Segmented filopodial protrusion with a schematic of filament centerlines overlaid (red). These lines are comprised of a series of points that were used for nearest neighbor analysis. g Nearest neighbor histograms showing the cumulative total of three normal actin filopodial bundles (green) and three cofilactin bundles (red). Scale bars: (a) 5 µm, (b) 200 nm (this also corresponds to the image in c), f 100 nm.CC BY · PubMed Central
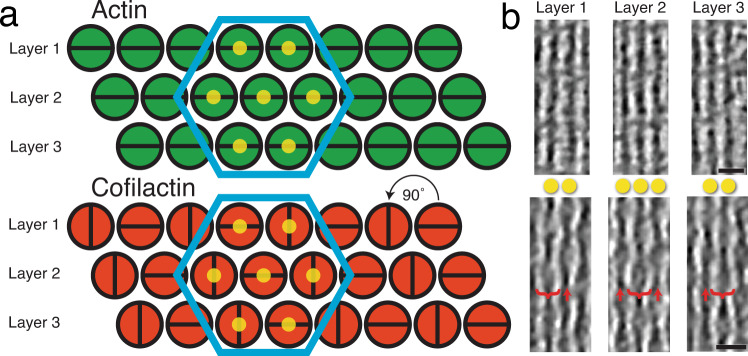
Fig. 3 Higher-order structure of filopodial bundle types. a Schematic model of the higher-order structure of actin (fascin-linked) and cofilactin bundles in growth cone filopodia (as they appear looking down the long axis of the bundle). Filaments in both bundle types are organized in layers and hexagonally packed (blue hexagons). Filaments in the actin bundle are all twisting in phase with one another, but in the cofilactin bundle filaments are rotated 90° with respect to their neighbors in the same layer. This creates columns of filaments that are oriented similarly to one another. The yellow dots on filaments in the hexagon correspond to filaments in b. b 17 nm-thick slices through tomograms of a filopodial tip (top) and a cofilactin bundle (bottom). In the cofilactin bundle, brackets show the wide portion of the helical twist while red arrows show the thin portion. The yellow dots correspond to the dots in a. For instance, the bracketed filament in layer two is directly between the two filaments in layers 1 and 3, only on a different Z-plane. Scale bars in b are 20 nm.
Fig. 3 Higher-order structure of filopodial bundle types. a Schematic model of the higher-order structure of actin (fascin-linked) and cofilactin bundles in growth cone filopodia (as they appear looking down the long axis of the bundle). Filaments in both bundle types are organized in layers and hexagonally packed (blue hexagons). Filaments in the actin bundle are all twisting in phase with one another, but in the cofilactin bundle filaments are rotated 90° with respect to their neighbors in the same layer. This creates columns of filaments that are oriented similarly to one another. The yellow dots on filaments in the hexagon correspond to filaments in b. b 17 nm-thick slices through tomograms of a filopodial tip (top) and a cofilactin bundle (bottom). In the cofilactin bundle, brackets show the wide portion of the helical twist while red arrows show the thin portion. The yellow dots correspond to the dots in a. For instance, the bracketed filament in layer two is directly between the two filaments in layers 1 and 3, only on a different Z-plane. Scale bars in b are 20 nm.CC BY · PubMed Central
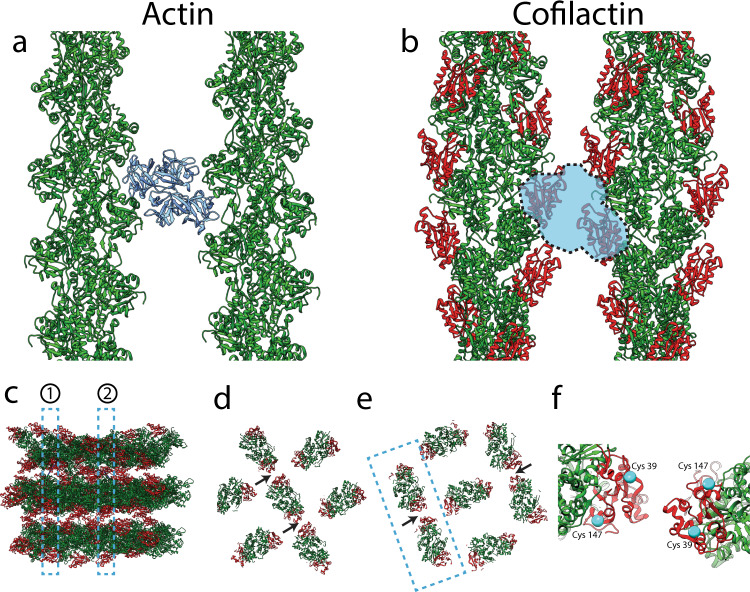
Fig. 4 Potential conflict between fascin and cofilin, and potential cofilactin interactions. a, b Top-down views of fascin-linked actin (a) and cofilactin (b) filaments. Both pairs of filaments are shown at interfaces where they are in phase with one another. In a, fascin (blue) is shown in its actin-binding pockets (22), two sites that are sterically blocked by the presence of cofilin in our model of cofilactin bundles (b). F-actin is green, and cofilin monomers are red. c Sideview of model cofilactin hexagonal unit. Dashed regions labeled 1 and 2 illustrate cross-sections shown in d and e, respectively. F-actin is green and cofilin is red. d, e Cross-sections through different regions of the hexagonal unit shown in c. Arrows point to the place where cofilin monomers on neighboring filaments are closest to each other (~2 nm apart at their closest residues). f Zoomed-in view of neighboring cofilins like those in the boxed-out region in e. Cys39 and Cys147 are displayed on each (cyan).
Fig. 4 Potential conflict between fascin and cofilin, and potential cofilactin interactions. a, b Top-down views of fascin-linked actin (a) and cofilactin (b) filaments. Both pairs of filaments are shown at interfaces where they are in phase with one another. In a, fascin (blue) is shown in its actin-binding pockets (22), two sites that are sterically blocked by the presence of cofilin in our model of cofilactin bundles (b). F-actin is green, and cofilin monomers are red. c Sideview of model cofilactin hexagonal unit. Dashed regions labeled 1 and 2 illustrate cross-sections shown in d and e, respectively. F-actin is green and cofilin is red. d, e Cross-sections through different regions of the hexagonal unit shown in c. Arrows point to the place where cofilin monomers on neighboring filaments are closest to each other (~2 nm apart at their closest residues). f Zoomed-in view of neighboring cofilins like those in the boxed-out region in e. Cys39 and Cys147 are displayed on each (cyan).CC BY · PubMed Central
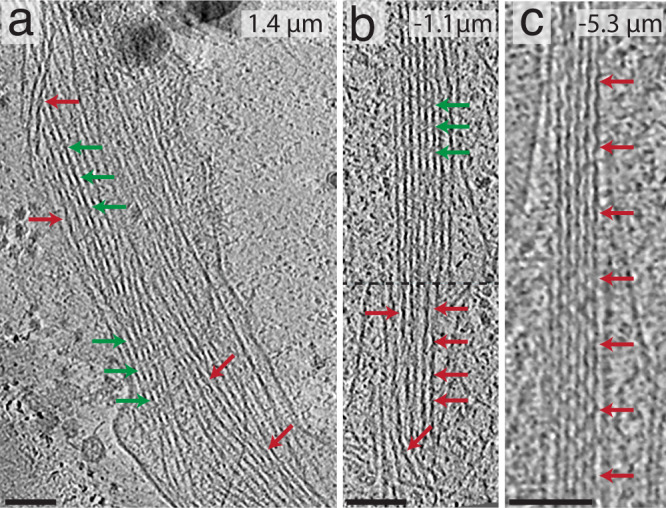
Fig. 5 Tomography of cofilactin within filopodia. In all images, red arrows signify cofilactin and green arrows show normal F-actin. The top-right corner of each image shows their distance from the lamellipodial veil (positive values are distal from the veil and negative values are proximal from it). a A 13.3 nm-thick tomographic slice where individual cofilactin filaments are scattered throughout a fascin-linked actin bundle. b 13.3 nm-thick tomographic slice through a prospective transition region where a clear boundary (represented by the dashed line) exists between the F-actin on top and the cofilactin on bottom. c 13.3 nm-thick tomographic slice showing a pure cofilactin bundle). Scale bars: 50 nm.
Fig. 5 Tomography of cofilactin within filopodia. In all images, red arrows signify cofilactin and green arrows show normal F-actin. The top-right corner of each image shows their distance from the lamellipodial veil (positive values are distal from the veil and negative values are proximal from it). a A 13.3 nm-thick tomographic slice where individual cofilactin filaments are scattered throughout a fascin-linked actin bundle. b 13.3 nm-thick tomographic slice through a prospective transition region where a clear boundary (represented by the dashed line) exists between the F-actin on top and the cofilactin on bottom. c 13.3 nm-thick tomographic slice showing a pure cofilactin bundle). Scale bars: 50 nm.CC BY · PubMed Central
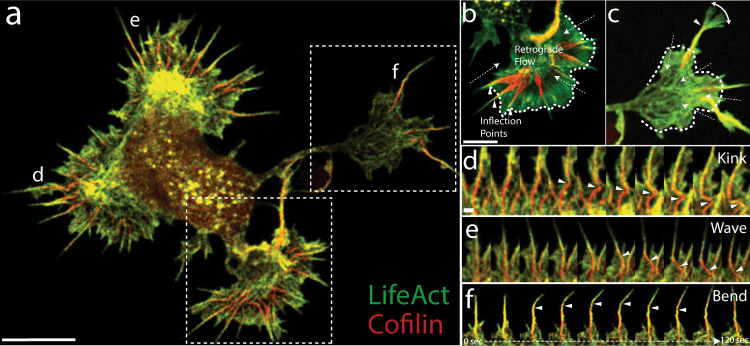
Fig. 6 Cofilactin bundles facilitate bending and breaking of filopodial protrusions. a Single image of a whole-cell expressing tdTomato-Lifeact (pseudocolored green) and EGFP-cofilin (pseudocolored red). b, c Maximum intensity projections (MIP) of lower and upper boxed regions in a, respectively. MIPs include 40 images at 3 s intervals for 2 min total. Filopodia in b are examples of “resting” filopodia and (c) shows a “searching” filopodium. Dashed arrows indicate the direction of actin retrograde flow, and arrowheads indicate inflection points seen along the flexing filopodial bundles. The white dashed line marks the position of the lamellipodial veil. d–f 2-min movie montages showing behaviors exhibited by the cofilin-rich filopodia designated with the corresponding label in a. Arrowheads follow either a kink/breaking point (d), a cofilactin bundle “wave” (e), or an inflection point in a bending filopodium (f). In e, the wave is caused by the filopodial tip moving from left to right, which drags the attached base behind it in a flexible, wave-like motion. The localization of EGFP-cofilin and tdTomato-Lifeact shown in a was replicated in multiple cells from two independent experiments, and similar results were also seen using other fluorescent protein combinations (Supplementary Fig. 5). Scale bars: (a, b) 5 µm (scale bar in b also corresponds to image in c), (d) 500 nm (also corresponds to (e) and (f)).
Fig. 6 Cofilactin bundles facilitate bending and breaking of filopodial protrusions. a Single image of a whole-cell expressing tdTomato-Lifeact (pseudocolored green) and EGFP-cofilin (pseudocolored red). b, c Maximum intensity projections (MIP) of lower and upper boxed regions in a, respectively. MIPs include 40 images at 3 s intervals for 2 min total. Filopodia in b are examples of “resting” filopodia and (c) shows a “searching” filopodium. Dashed arrows indicate the direction of actin retrograde flow, and arrowheads indicate inflection points seen along the flexing filopodial bundles. The white dashed line marks the position of the lamellipodial veil. d–f 2-min movie montages showing behaviors exhibited by the cofilin-rich filopodia designated with the corresponding label in a. Arrowheads follow either a kink/breaking point (d), a cofilactin bundle “wave” (e), or an inflection point in a bending filopodium (f). In e, the wave is caused by the filopodial tip moving from left to right, which drags the attached base behind it in a flexible, wave-like motion. The localization of EGFP-cofilin and tdTomato-Lifeact shown in a was replicated in multiple cells from two independent experiments, and similar results were also seen using other fluorescent protein combinations (Supplementary Fig. 5). Scale bars: (a, b) 5 µm (scale bar in b also corresponds to image in c), (d) 500 nm (also corresponds to (e) and (f)).CC BY · PubMed Central
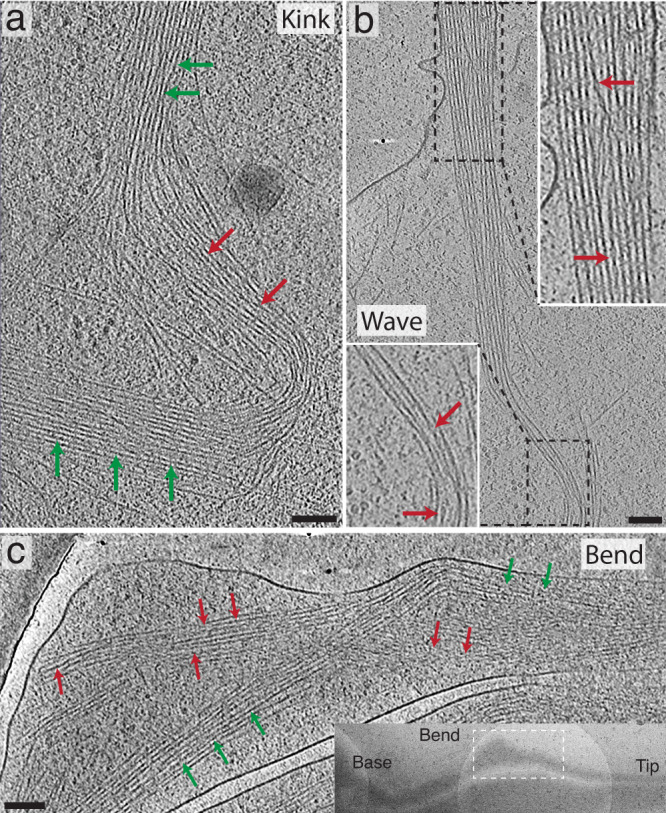
Fig. 7 Tomograms of growth cone filopodia in different dynamic states. In all images, red arrows signify cofilactin and green arrows show normal F-actin. a 13.3 nm-thick tomographic slice showing a ~90° kink in a growth cone filopodium. This filopodium is likely in the process of severing, like in Fig. 6d and Supplementary Movie 7. Cofilactin filaments can be seen near the apex of the kink in the bundle. b 13.3 nm-thick tomographic slice where the proximal portion of a filopodium appears to be moving from right to left in a wave-like motion. This is similar to the motion exhibited by the filopodium shown in Fig. 6e and Supplementary Movie 8. The dashed boxes on top and bottom represent the regions shown in the top and bottom zoomed-in insets (white boxes), respectively. The top zoomed-in view shows a cofilactin filament forming an S-curve through the fascin cross-linked bundle. The cofilactin filament is moving through the Z-axis, so the middle of the S-curve is not visible in this image. The bottom zoomed-in view shows, similar to the kink from (a), cofilactin filaments near the crest of the wave. c 13.3 nm-thick tomographic slice of a bend in a distal filopodial region. Here, cofilactin and actin coexist as separate bundles wrapping around one another. This tomogram resembles that shown in the movie from Fig. 6f and Supplementary Movie 9. Inset: TEM overview image showing the location of the tomogram in the main panel. Scale bars: a, b, and c represent 100 nm.
Fig. 7 Tomograms of growth cone filopodia in different dynamic states. In all images, red arrows signify cofilactin and green arrows show normal F-actin. a 13.3 nm-thick tomographic slice showing a ~90° kink in a growth cone filopodium. This filopodium is likely in the process of severing, like in Fig. 6d and Supplementary Movie 7. Cofilactin filaments can be seen near the apex of the kink in the bundle. b 13.3 nm-thick tomographic slice where the proximal portion of a filopodium appears to be moving from right to left in a wave-like motion. This is similar to the motion exhibited by the filopodium shown in Fig. 6e and Supplementary Movie 8. The dashed boxes on top and bottom represent the regions shown in the top and bottom zoomed-in insets (white boxes), respectively. The top zoomed-in view shows a cofilactin filament forming an S-curve through the fascin cross-linked bundle. The cofilactin filament is moving through the Z-axis, so the middle of the S-curve is not visible in this image. The bottom zoomed-in view shows, similar to the kink from (a), cofilactin filaments near the crest of the wave. c 13.3 nm-thick tomographic slice of a bend in a distal filopodial region. Here, cofilactin and actin coexist as separate bundles wrapping around one another. This tomogram resembles that shown in the movie from Fig. 6f and Supplementary Movie 9. Inset: TEM overview image showing the location of the tomogram in the main panel. Scale bars: a, b, and c represent 100 nm.CC BY · PubMed Central
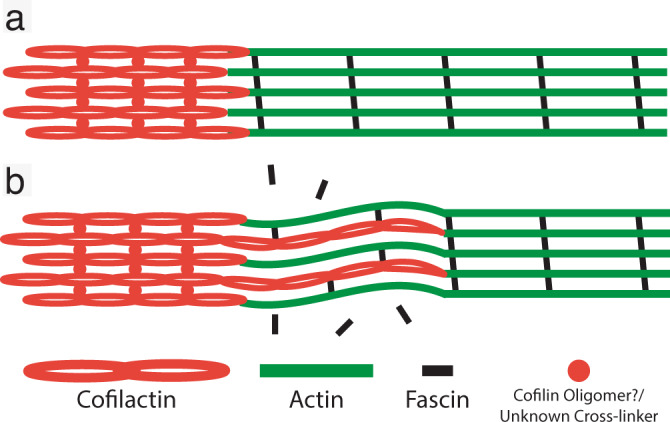
Fig. 8 Current model. Schematic of filopodial actin bundle in a rigid (a) and flexible (b) state. As cofilactin filaments permeate the fascin-linked region of the filament, they competitively dislodge fascin cross-linkers and increase the flexibility of filopodial bundles. In the proximal region of the bundles, cofilactin filaments prevail and are cross-linked through either cofilin oligomers/self-association or by some, as of yet, unknown cross-linker.
Fig. 8 Current model. Schematic of filopodial actin bundle in a rigid (a) and flexible (b) state. As cofilactin filaments permeate the fascin-linked region of the filament, they competitively dislodge fascin cross-linkers and increase the flexibility of filopodial bundles. In the proximal region of the bundles, cofilactin filaments prevail and are cross-linked through either cofilin oligomers/self-association or by some, as of yet, unknown cross-linker.CC BY · PubMed Central

Verification

Claims the paper makes

The claims and statistics of this paper haven’t been checked yet.

Run the check — free, no account needed. It reads the open-access text and checks the sources it cites.

A few free checks a day · papers already verified open instantly · results are public

Claims other papers make about this one

Each is checked against this paper’s own text: does it say what the citing paper says it does?

Self-check

Percentages, sums and reported differences re-computed from the paper’s own numbers.

The self-check needs the paper’s full text.

Citations

Cites

Research works printed but not linked: 70

  1. Kerstein, P. C., Nichol, R. H. & Gomez, T. M. Mechanochemical regulation of growth cone motility. Front. Cell Neurosci. 9, 244 (2015). · DOI
  2. Lowery, L. A. & Vactor, D. V. The trip of the tip: understanding the growth cone machinery. Nat. Rev. Mol. Cell Biol. 10, 332–343 (2009). · DOI
  3. Vitriol, E. A. & Zheng, J. Q. Growth cone travel in space and time: the cellular ensemble of cytoskeleton, adhesion, and membrane. Neuron 73, 1068–1081 (2012). · DOI
  4. Stoeckli, E. T. Understanding axon guidance: are we nearly there yet? Development 145, (2018). · DOI · Paper page
  5. Dent, E. W., Gupton, S. L. & Gertler, F. B. The growth cone cytoskeleton in axon outgrowth and guidance. Cold Spring Harb. Perspect. Biol. 3, a001800 (2011). · DOI
  6. Flynn, K. C. et al. ADF/cofilin-mediated actin retrograde flow directs neurite formation in the developing brain. Neuron 76, 1091–1107 (2012). · DOI
  7. Gomez, T. M. & Letourneau, P. C. Actin dynamics in growth cone motility and navigation. J. Neurochem. 129, 221–234 (2014). · DOI
  8. Omotade, O. F., Pollitt, S. L. & Zheng, J. Q. Actin-based growth cone motility and guidance. Mol. Cell. Neurosci. 84, 4–10 (2017). · DOI
  9. Tamariz, E. & Varela-Echavarría, A. The discovery of the growth cone and its influence on the study of axon guidance. Front. Neuroanat. 9, 51 (2015). · DOI
  10. Gasperini, R. J. et al. How does calcium interact with the cytoskeleton to regulate growth cone motility during axon pathfinding? Mol. Cell. Neurosci. 84, 29–35 (2017). · DOI
  11. Hall, A. & Lalli, G. Rho and Ras GTPases in axon growth, guidance, and branching. Cold Spring Harb. Perspect. Biol. 2, a001818 (2010). · DOI · Paper page
  12. Henley, J. & Poo, M. Guiding neuronal growth cones using Ca2+ signals. Trends Cell Biol. 14, 320–330 (2004). · DOI
  13. Piper, M., Horck, Fvan & Holt, C. The role of cyclic nucleotides in axon guidance. Adv. Exp. Med. Biol. 621, 134–143 (2007). · DOI
  14. Tojima, T., Hines, J. H., Henley, J. R. & Kamiguchi, H. Second messengers and membrane trafficking direct and organize growth cone steering. Nat. Rev. Neurosci. 12, 191–203 (2011). · DOI
  15. Wen, Z., Guirland, C., Ming, G. & Zheng, J. Q. A CaMKII/Calcineurin switch controls the direction of Ca2+-dependent growth cone guidance. Neuron 43, 835–846 (2004). · DOI
  16. Mattila, P. K. & Lappalainen, P. Filopodia: molecular architecture and cellular functions. Nat. Rev. Mol. Cell Biol. 9, 446–454 (2008). · DOI
  17. Rajnicek, A. M., Foubister, L. E. & McCaig, C. D. Growth cone steering by a physiological electric field requires dynamic microtubules, microfilaments and Rac-mediated filopodial asymmetry. J. Cell. Sci. 119, 1736–1745 (2006). · DOI
  18. Zheng, J. Q., Wan, J. J. & Poo, M. M. Essential role of filopodia in chemotropic turning of nerve growth cone induced by a glutamate gradient. J. Neurosci. 16, 1140–1149 (1996). · DOI
  19. Lin, C. H., Espreafico, E. M., Mooseker, M. S. & Forscher, P. Myosin drives retrograde F-actin flow in neuronal growth cones. Neuron 16, 769–782 (1996). · DOI
  20. Medeiros, N. A., Burnette, D. T. & Forscher, P. Myosin II functions in actin-bundle turnover in neuronal growth cones. Nat. Cell Biol. 8, 215–226 (2006). · DOI
  21. Caswell, P. T. & Zech, T. Actin-based cell protrusion in a 3D matrix. Trends Cell Biol. 28, 823–834 (2018). · DOI
  22. Andrianantoandro, E. & Pollard, T. D. Mechanism of actin filament turnover by severing and nucleation at different concentrations of ADF/cofilin. Mol. Cell 24, 13–23 (2006). · DOI
  23. Cooper, J. A., Blum, J. D., Williams, R. C. & Pollard, T. D. Purification and characterization of actophorin, a new 15,000-dalton actin-binding protein from Acanthamoeba castellanii. J. Biol. Chem. 261, 477–485 (1986). · DOI
  24. Cruz, E. M. D. L. How cofilin severs an actin filament. Biophys. Rev. 1, 51–59 (2009). · DOI
  25. Wioland, H. et al. ADF/Cofilin accelerates actin dynamics by severing filaments and promoting their depolymerization at both ends. Curr. Biol. 27, 1956–1967.e7 (2017). · DOI
  26. Shekhar, S. & Carlier, M.-F. Enhanced depolymerization of actin filaments by ADF/cofilin and monomer funneling by capping protein cooperate to accelerate barbed-end growth. Curr. Biol. 27, 1990–1998.e5 (2017). · DOI
  27. Gungabissoon, R. A. & Bamburg, J. R. Regulation of growth cone actin dynamics by ADF/cofilin. J. Histochem. Cytochem. 51, 411–420 (2003). · DOI
  28. Tedeschi, A. et al. ADF/cofilin-mediated actin turnover promotes axon regeneration in the adult CNS. Neuron 103, 1073–1085.e6 (2019). · DOI
  29. Meberg, P. J. & Bamburg, J. R. Increase in neurite outgrowth mediated by overexpression of actin depolymerizing factor. J. Neurosci. 20, 2459–2469 (2000). · DOI
  30. Cruz, E. M. D. L. Cofilin binding to muscle and non-muscle actin filaments: isoform-dependent cooperative interactions. J. Mol. Biol. 346, 557–564 (2005). · DOI
  31. McGough, A., Pope, B., Chiu, W. & Weeds, A. Cofilin changes the twist of F-actin: implications for actin filament dynamics and cellular function. J. Cell Biol. 138, 771–781 (1997). · DOI
  32. Bobkov, A. A. et al. Cooperative effects of cofilin (ADF) on actin structure suggest allosteric mechanism of cofilin function. J. Mol. Biol. 356, 325–334 (2006). · DOI
  33. Cao, W., Goodarzi, J. P. & Cruz, E. M. D. L. Energetics and kinetics of cooperative cofilin–actin filament interactions. J. Mol. Biol. 361, 257–267 (2006). · DOI
  34. Elam, W. A. et al. Phosphomimetic S3D cofilin binds but only weakly severs actin filaments. J. Biol. Chem. 292, 19565–19579 (2017). · DOI
  35. Huehn, A. R. et al. Structures of cofilin-induced structural changes reveal local and asymmetric perturbations of actin filaments. Proc. Natl Acad. Sci. USA 117, 1478–1484 (2020). · DOI
  36. Bobkov, A. A. et al. Structural effects of cofilin on longitudinal contacts in F-actin. J. Mol. Biol. 323, 739–750 (2002). · DOI · Paper page
  37. Chou, S. Z. & Pollard, T. D. Mechanism of actin polymerization revealed by cryo-EM structures of actin filaments with three different bound nucleotides. Proc. Natl Acad. Sci. USA 116, 201807028 (2019). · DOI
  38. Pfaendtner, J., Cruz, E. M. D. L. & Voth, G. A. Actin filament remodeling by actin depolymerization factor/cofilin. Proc. Natl Acad. Sci. USA 107, 7299–7304 (2010). · DOI
  39. Tanaka, K. et al. Structural basis for cofilin binding and actin filament disassembly. Nat. Commun. 9, 1860–12 (2018). · DOI
  40. Galkin, V. E. et al. Remodeling of actin filaments by ADF/cofilin proteins. Proc. Natl Acad. Sci. USA 108, 20568–20572 (2011). · DOI
  41. Hocky, G. M., Sindelar, C. V., Cao, W., Voth, G. A. & Cruz, E. M. D. L. Structural basis of fast- and slow-severing actin-cofilactin boundaries. J. Biol. Chem. 296, 100337 (2021). · DOI
  42. McCullough, B. R. et al. Cofilin-linked changes in actin filament flexibility promote severing. Biophys. J. 101, 151–159 (2011). · DOI
  43. Ngo, K. X., Kodera, N., Katayama, E., Ando, T. & Uyeda, T. Q. P. Cofilin-induced unidirectional cooperative conformational changes in actin filaments revealed by high-speed atomic force microscopy. Elife 4, 393 (2015). · DOI
  44. Ono, S. Cofilin-induced structural changes in actin filaments stay local. Proc. Natl Acad. Sci. USA 117, 3349–3351 (2020). · DOI
  45. Suarez, C. et al. Cofilin tunes the nucleotide state of actin filaments and severs at bare and decorated segment boundaries. Curr. Biol. 21, 862–868 (2011). · DOI · Paper page
  46. Wioland, H., Jegou, A. & Romet-Lemonne, G. Quantitative variations with pH of actin depolymerizing factor/cofilin’s multiple actions on actin filaments. Biochemistry 58, 40–47 (2019). · DOI
  47. Hayden, S. M., Miller, P. S., Brauweiler, A. & Bamburg, J. R. Analysis of the interactions of actin depolymerizing factor with G- and F-actin. Biochemistry 32, 9994–10004 (1993). · DOI
  48. McCullough, B. R., Blanchoin, L., Martiel, J.-L. & Cruz, E. M. D. L. Cofilin increases the bending flexibility of actin filaments: implications for severing and cell mechanics. J. Mol. Biol. 381, 550–558 (2008). · DOI
  49. Prochniewicz, E., Janson, N., Thomas, D. D. & Cruz, E. M. D. L. Cofilin increases the torsional flexibility and dynamics of actin filaments. J. Mol. Biol. 353, 990–1000 (2005). · DOI
  50. Aramaki, S., Mayanagi, K., Jin, M., Aoyama, K. & Yasunaga, T. Filopodia formation by crosslinking of F-actin with fascin in two different binding manners. Cytoskeleton (Hoboken) 73, 365–374 (2016). · DOI
  51. Cohan, C. S., Welnhofer, E. A., Zhao, L., Matsumura, F. & Yamashiro, S. Role of the actin bundling protein fascin in growth cone morphogenesis: localization in filopodia and lamellipodia. Cell Motil. Cytoskeleton 48, 109–120 (2001). · DOI
  52. DeRosier, D. J. & Edds, K. T. Evidence for fascin cross-links between the actin filaments in coelomocyte filopodia. Exp. Cell Res. 126, 490–494 (1980). · DOI
  53. Jasnin, M. et al. Three-dimensional architecture of actin filaments in Listeria monocytogenes comet tails. Proc. Natl Acad. Sci. USA 110, 20521–20526 (2013). · DOI
  54. Vignjevic, D. et al. Role of fascin in filopodial protrusion. J. Cell Biol. 174, 863–875 (2006). · DOI
  55. Yang, S. et al. Molecular mechanism of fascin function in filopodial formation. J. Biol. Chem. 288, 274–284 (2013). · DOI
  56. Breitsprecher, D. et al. Cofilin cooperates with fascin to disassemble filopodial actin filaments. J. Cell. Sci. 124, 3305–3318 (2011). · DOI
  57. Elam, W. A., Kang, H. & Cruz, E. M. D. L. Competitive displacement of cofilin can promote actin filament severing. Biochem. Biophys. Res. Commun. 438, 728–731 (2013). · DOI
  58. Wiggan, O., Shaw, A. E., DeLuca, J. G. & Bamburg, J. R. ADF/cofilin regulates actomyosin assembly through competitive inhibition of myosin II binding to F-actin. Dev. Cell 22, 530–543 (2012). · DOI
  59. Goyal, P. et al. Cofilin oligomer formation occurs in vivo and is regulated by cofilin phosphorylation. PLoS One 8, e71769 (2013). · DOI
  60. Pfannstiel, J. et al. Human cofilin forms oligomers exhibiting actin bundling activity. J. Biol. Chem. 276, 49476–49484 (2001). · DOI
  61. Riedl, J. et al. Lifeact: a versatile marker to visualize F-actin. Nat. Methods 5, 605–607 (2008). · DOI · Paper page
  62. Bernstein, B. W., Shaw, A. E., Minamide, L. S., Pak, C. W. & Bamburg, J. R. Incorporation of cofilin into rods depends on disulfide intermolecular bonds: implications for actin regulation and neurodegenerative disease. J. Neurosci. 32, 6670–6681 (2012). · DOI
  63. Minamide, L. S., Striegl, A. M., Boyle, J. A., Meberg, P. J. & Bamburg, J. R. Neurodegenerative stimuli induce persistent ADF/cofilin-actin rods that disrupt distal neurite function. Nat. Cell Biol. 2, 628–636 (2000). · DOI
  64. Grintsevich, E. E. et al. F-actin dismantling through a Redox-driven synergy between mical and cofilin. Nat. Cell Biol. 18, 876–885 (2016). · DOI
  65. Grintsevich, E. E. et al. Catastrophic disassembly of actin filaments via Mical-mediated oxidation. Nat. Commun. 8, 2183 (2017). · DOI
  66. Chan, C., Beltzner, C. C. & Pollard, T. D. Cofilin dissociates Arp2/3 complex and branches from actin filaments. Curr. Biol. 19, 537–545 (2009). · DOI
  67. Huehn, A. et al. The actin filament twist changes abruptly at boundaries between bare and cofilin-decorated segments. J. Biol. Chem. 293, 5377–5383 (2018). · DOI
  68. Kremer, J. R., Mastronarde, D. N. & McIntosh, J. R. Computer visualization of three-dimensional image data using IMOD. J. Struct. Biol. 116, 71–76 (1996). · DOI
  69. Fujii, T., Iwane, A. H., Yanagida, T. & Namba, K. Direct visualization of secondary structures of F-actin by electron cryomicroscopy. Nature 467, 724–728 (2010). · DOI
  70. Rigort, A. et al. Automated segmentation of electron tomograms for a quantitative description of actin filament networks. J. Struct. Biol. 177, 135–144 (2012). · DOI

Cited by

Sorted by citations

See all 45

Metadata

Authors
Hylton, R. K., Heebner, J. E., Grillo, M. A., & Swulius, M. T.
Affiliations
Pennsylvania State University (US)
Corresponding author
Swulius, Matthew T.
Venue
Nature Communications
Published
2022-05-04
Volume
13
Issue
1
Pages
2439-2439
ISSN
2041-1723 (ISSN-L)
OpenAlex
W4225376724
Cited by
45
References
2
Citations by year
2026: 4 · 2025: 9 · 2024: 14 · 2023: 12 · 2022: 6
FWCI
5.47
Type
journal article
Language
en
Open access
Locations
  • Nature Communications (publishedVersion, cc-by)
  • PubMed Central (publishedVersion, cc-by)
  • PubMed (publishedVersion)
  • RePEc: Research Papers in Economics (submittedVersion)
  • DOAJ (DOAJ: Directory of Open Access Journals) (submittedVersion, cc-by-sa)
Funders
  • University of Pennsylvania
  • Pennsylvania State University (SCR_021178)
  • Penn State College of Medicine
Topics
  • Life Sciences › Biochemistry, Genetics and Molecular Biology › Cell Biology › Cellular Mechanics and Interactions
  • Life Sciences › Neuroscience › Cellular and Molecular Neuroscience › Axon Guidance and Neuronal Signaling
  • Life Sciences › Biochemistry, Genetics and Molecular Biology › Molecular Biology › Protein Kinase Regulation and GTPase Signaling
Keywords
cofilin, filopodia, growth cones, fascin, actin cross-linking, actin filament dynamics, cytoskeletal remodeling
MeSH terms
Actins, Actin Cytoskeleton, Pseudopodia, Growth Cones, Actin Depolymerizing Factors

About these checks

Registry, retraction, Cites and statistics results are computed, not judged, with one exception: a printed reference that no index lists is read once by a model before it counts as a citation error. Claims are extracted by a model and kept only when their quote appears verbatim in the text; each cited source is then checked, with a model’s help, for whether it says what the claim relies on. Those verdicts can be wrong — read the claim’s quote and the cited source before relying on one.

Statistics and arithmetic are recomputed, not judged.

Confidence bands are shown only for fields calibrated on our annotated test set. None is calibrated yet, so no band is shown.

What counts as a claim ›How we measure confidence ›How we check this ›

Are you an author, or do you see a problem with this page? Request a review