

The DOI matches its Crossref record; 4 of the 4 references it cites were found in a registry or an index.
Lentivector cryptic splicing mediates increase in CD34+ clones expressing truncated HMGA2 in human X-linked severe combined immunodeficiency
Published version of a preprint
Abstract
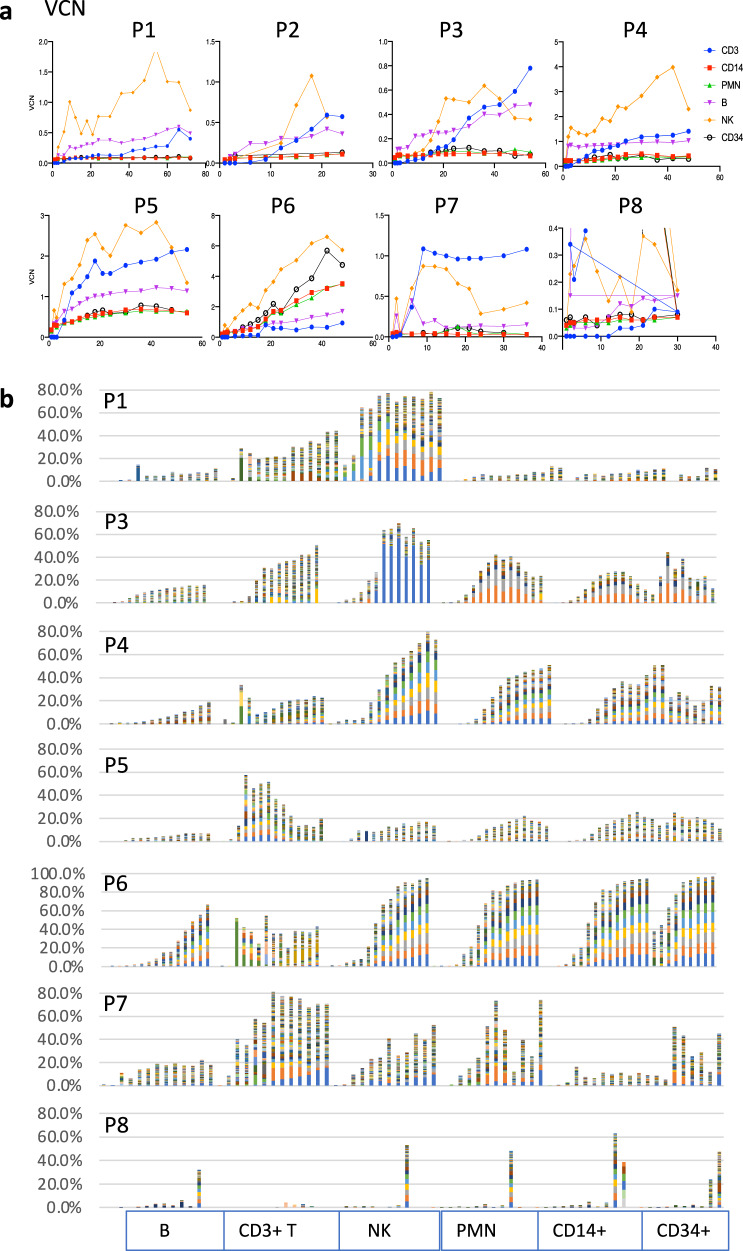
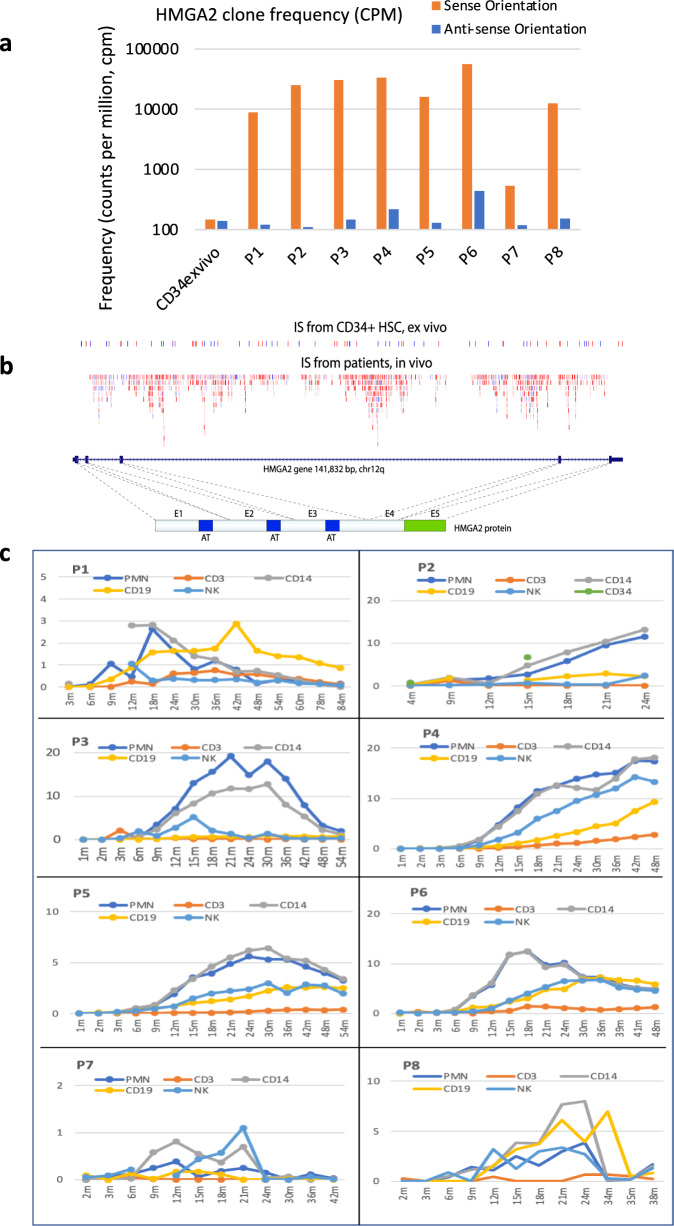
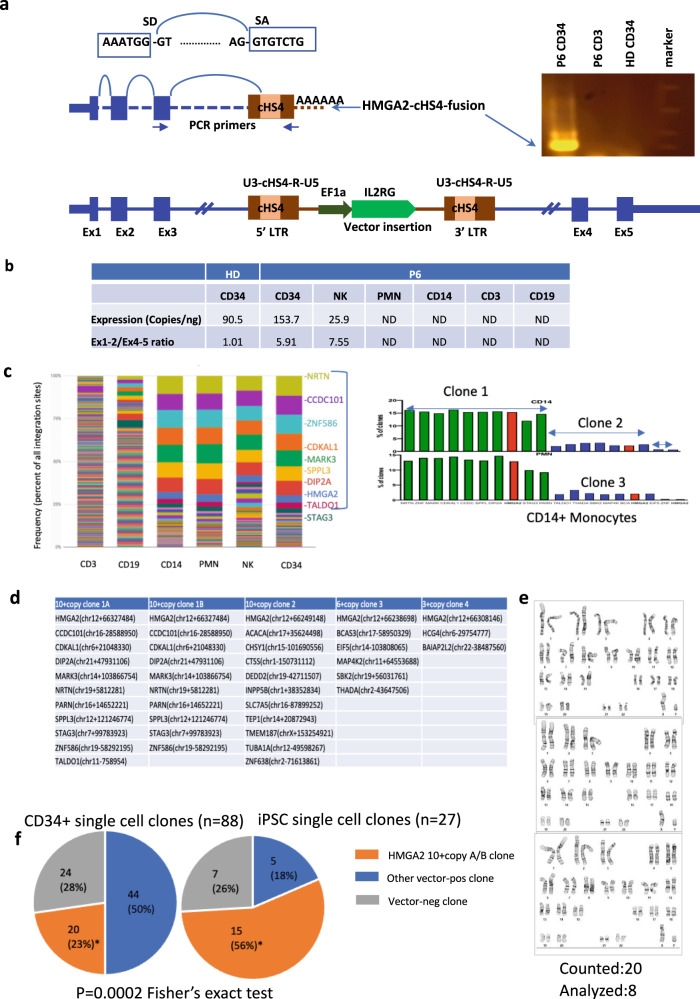
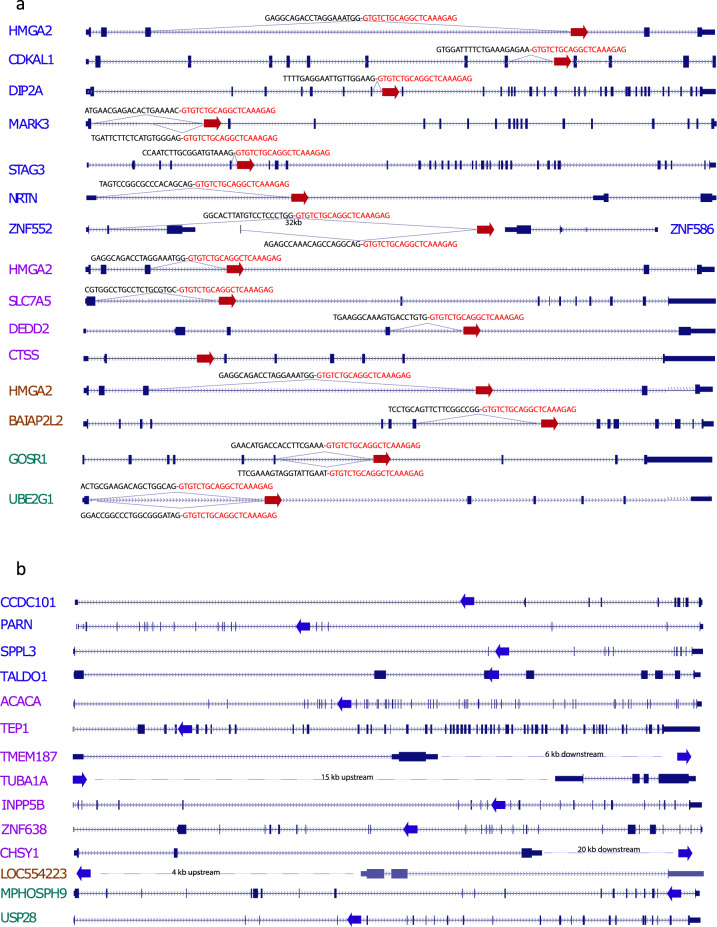
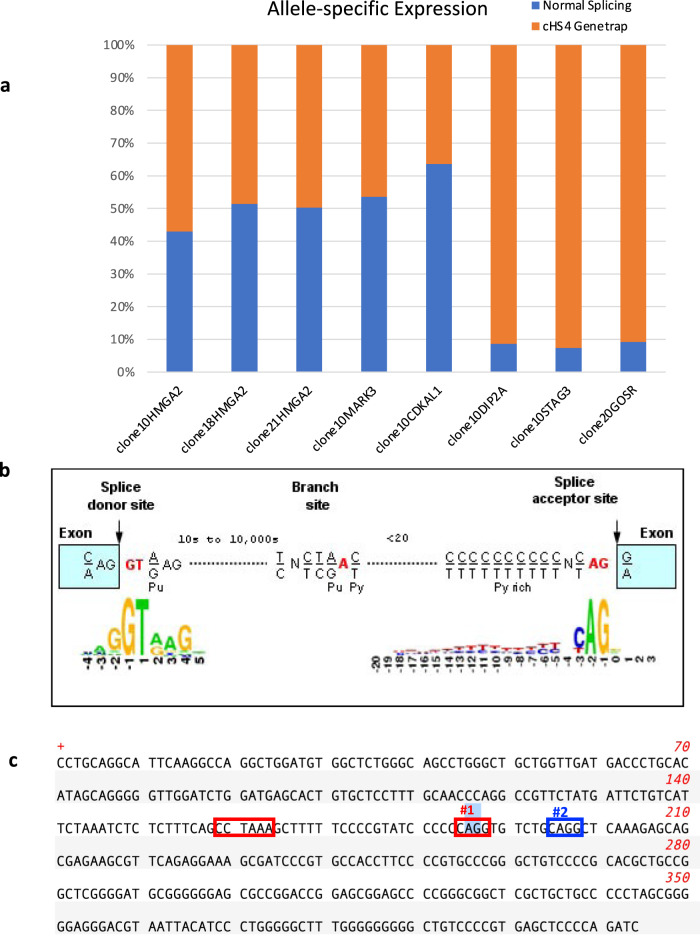
X-linked Severe Combined Immunodeficiency (SCID-X1) due to IL2RG mutations is potentially fatal in infancy where ‘emergency’ life-saving stem cell transplant may only achieve incomplete immune reconstitution following transplant. Salvage therapy SCID-X1 patients over 2 years old (NCT01306019) is a non-randomized, open-label, phase I/II clinical trial for administration of lentiviral-transduced autologous hematopoietic stem cells following busulfan (6 mg/kg total) conditioning. The primary and secondary objectives assess efficacy in restoring immunity and safety by vector insertion site analysis (VISA). In this ongoing study (19 patients treated), we report VISA in blood lineages from first eight treated patients with longer follow up found a > 60-fold increase in frequency of forward-orientated VIS within intron 3 of the High Mobility Group AT-hook 2 gene. All eight patients demonstrated emergence of dominant HMGA2 VIS clones in progenitor and myeloid lineages, but without disturbance of hematopoiesis. Our molecular analysis demonstrated a cryptic splice site within the chicken β-globin hypersensitivity 4 insulator element in the vector generating truncated mRNA transcripts from many transcriptionally active gene containing forward-oriented intronic vector insert. A two base-pair change at the splice site within the lentiviral vector eliminated splicing activity while retaining vector functional capability. This highlights the importance of functional analysis of lentivectors for cryptic splicing for preclinical safety assessment and a redesign of clinical vectors to improve safety.
Overview
The claims and statistics of this paper haven’t been checked yet.
Run the check — free, no account needed. It reads the open-access text and checks the sources it cites.
Integrity signals
Registry
Cites
Statistics
Figures
Verification
Claims the paper makes
The claims and statistics of this paper haven’t been checked yet.
Run the check — free, no account needed. It reads the open-access text and checks the sources it cites.
Claims other papers make about this one
Each is checked against this paper’s own text: does it say what the citing paper says it does?
In the citing paper
“However, one early BB305 trial in SCD was associated with the development of myelodysplastic syndrome/acute myeloid leukemia in two recipients.88,89”
From Ex vivo modification of hematopoietic stem and progenitor cells for gene therapy (2025) · cites this paper as [88]
Self-check
Percentages, sums and reported differences re-computed from the paper’s own numbers.
The self-check needs the paper’s full text.
Citations
Cites
Insertional oncogenesis in 4 patients after retrovirus-mediated gene therapy of SCID-X1
Hacein-Bey-Abina, S., Garrigue, A., Wang, G. P., Soulier, J., Lim, A., Morillon, E., Clappier, E., Caccavelli, L., Delabesse, E., Beldjord, K., et al. (2008) · Journal of Clinical Investigation · doi:10.1172/jci35700 · Cited by 1,854
Transfusion independence and HMGA2 activation after gene therapy of human β-thalassaemia
Cavazzana-Calvo, M., Payen, E., Negre, O., Wang, G., Hehir, K., Fusil, F., Down, J., Denaro, M., Brady, T., Westerman, K., et al. (2010) · Nature · doi:10.1038/nature09328 · Cited by 1,276
Montini, E., Cesana, D., Schmidt, M., Sanvito, F., Bartholomae, C. C., Ranzani, M., Benedicenti, F., Sergi, L. S., Ambrosi, A., Ponzoni, M., et al. (2009) · Journal of Clinical Investigation · doi:10.1172/jci37630 · Cited by 571
Lentiviral Gene Therapy Combined with Low-Dose Busulfan in Infants with SCID-X1
Mamcarz, E., Zhou, S., Lockey, T., Abdelsamed, H., Cross, S. J., Kang, G., Ma, Z., Condori, J., Dowdy, J., Triplett, B., et al. (2019) · New England Journal of Medicine · doi:10.1056/nejmoa1815408 · Cited by 263
Self-citation
Research works printed but not linked: 39
- Kohn, D. B. et al. Lentiviral gene therapy for X-linked chronic granulomatous disease. Nat. Med. 26, 200–206 (2020). · DOI · Paper page
- De Ravin, S. S. et al. Lentiviral hematopoietic stem cell gene therapy for X-linked severe combined immunodeficiency. Sci. Transl. Med. 8, 335ra357 (2016). · DOI · Paper page
- Aiuti, A. et al. Lentiviral hematopoietic stem cell gene therapy in patients with Wiskott–Aldrich syndrome. Science 341, 1233151 (2013). · DOI · Paper page
- Biffi, A. et al. Lentiviral hematopoietic stem cell gene therapy benefits metachromatic leukodystrophy. Science 341, 1233158 (2013). · DOI · Paper page
- Dvorak, C. C. et al. Comparison of outcomes of hematopoietic stem cell transplantation without chemotherapy conditioning by using matched sibling and unrelated donors for treatment of severe combined immunodeficiency. J. Allergy Clin. Immunol. 134, 935–943.e915 (2014). · DOI
- Puck, J. M. et al. The interleukin-2 receptor gamma chain maps to Xq13.1 and is mutated in X-linked severe combined immunodeficiency, SCIDX1. Hum. Mol. Genet. 2, 1099–1104 (1993). · DOI
- Russell, S. M. et al. Interleukin-2 receptor gamma chain: a functional component of the interleukin-4 receptor. Science 262, 1880–1883 (1993). · DOI
- Leonard, W. J., Lin, J. X. & O’Shea, J. J. The gammac family of cytokines: basic biology to therapeutic ramifications. Immunity 50, 832–850 (2019). · DOI
- Noguchi, M. et al. Interleukin-2 receptor gamma chain: a functional component of the interleukin-7 receptor. Science 262, 1877–1880 (1993). · DOI
- Noguchi, M. et al. Interleukin-2 receptor gamma chain mutation results in X-linked severe combined immunodeficiency in humans. Cell 73, 147–157 (1993). · DOI
- Han, J. et al. beta-globin lentiviral vectors have reduced titers due to incomplete vector RNA genomes and lowered virion production. Stem Cell Rep. 16, 198–211 (2021). · DOI
- Moiani, A. et al. Lentiviral vector integration in the human genome induces alternative splicing and generates aberrant transcripts. J. Clin. Invest 122, 1653–1666 (2012). · DOI
- Merling, R. K. et al. Transgene-free iPSCs generated from small volume peripheral blood nonmobilized CD34+ cells. Blood 121, e98–e107 (2013). · DOI
- Marson, A. et al. Connecting microRNA genes to the core transcriptional regulatory circuitry of embryonic stem cells. Cell 134, 521–533 (2008). · DOI
- Viswanathan, S. R., Daley, G. Q. & Gregory, R. I. Selective blockade of microRNA processing by Lin28. Science 320, 97–100 (2008). · DOI
- Peter, M. E. Let-7 and miR-200 microRNAs: guardians against pluripotency and cancer progression. Cell Cycle 8, 843–852 (2009). · DOI
- Cesana, M. et al. A CLK3-HMGA2 alternative splicing axis impacts human hematopoietic stem cell molecular identity throughout development. Cell Stem Cell 22, 575–588.e577 (2018). · DOI
- Viskochil, D. et al. Deletions and a translocation interrupt a cloned gene at the neurofibromatosis type 1 locus. Cell 62, 187–192 (1990). · DOI
- Wallace, M. R. et al. Type 1 neurofibromatosis gene: identification of a large transcript disrupted in three NF1 patients. Science 249, 181–186 (1990). · DOI
- Bosticardo, M. et al. Artificial thymic organoids represent a reliable tool to study T-cell differentiation in patients with severe T-cell lymphopenia. Blood Adv. 4, 2611–2616 (2020). · DOI
- Cavazzana, M., Bushman, F. D., Miccio, A., Andre-Schmutz, I. & Six, E. Gene therapy targeting haematopoietic stem cells for inherited diseases: progress and challenges. Nat. Rev. Drug Disco. 18, 447–462 (2019). · DOI
- Hacein-Bey-Abina, S. et al. LMO2-associated clonal T cell proliferation in two patients after gene therapy for SCID-X1. Science 302, 415–419 (2003). · DOI · Paper page
- Howe, S. J. et al. Insertional mutagenesis combined with acquired somatic mutations causes leukemogenesis following gene therapy of SCID-X1 patients. J. Clin. Invest 118, 3143–3150 (2008). · DOI · Paper page
- Bokhoven, M. et al. Insertional gene activation by lentiviral and gammaretroviral vectors. J. Virol. 83, 283–294 (2009). · DOI · Paper page
- Knight, S., Bokhoven, M., Collins, M. & Takeuchi, Y. Effect of the internal promoter on insertional gene activation by lentiviral vectors with an intact HIV long terminal repeat. J. Virol. 84, 4856–4859 (2010). · DOI
- Cesana, D. et al. Whole transcriptome characterization of aberrant splicing events induced by lentiviral vector integrations. J. Clin. Invest 122, 1667–1676 (2012). · DOI
- Fusco, A. & Fedele, M. Roles of HMGA proteins in cancer. Nat. Rev. Cancer 7, 899–910 (2007). · DOI
- Sgarra, R. et al. Nuclear phosphoproteins HMGA and their relationship with chromatin structure and cancer. FEBS Lett. 574, 1–8 (2004). · DOI
- Copley, M. R. et al. The Lin28b-let-7-Hmga2 axis determines the higher self-renewal potential of fetal haematopoietic stem cells. Nat. Cell Biol. 15, 916–925 (2013). · DOI
- Kumar, P. et al. HMGA2 promotes long-term engraftment and myeloerythroid differentiation of human hematopoietic stem and progenitor cells. Blood Adv. 3, 681–691 (2019). · DOI · Paper page
- Nishino, J., Kim, I., Chada, K. & Morrison, S. J. Hmga2 promotes neural stem cell self-renewal in young but not old mice by reducing p16Ink4a and p19Arf Expression. Cell 135, 227–239 (2008). · DOI
- Nishino, J., Kim, S., Zhu, Y., Zhu, H. & Morrison, S. J. A network of heterochronic genes including Imp1 regulates temporal changes in stem cell properties. Elife 2, e00924 (2013). · DOI
- Wang, G. P., Ciuffi, A., Leipzig, J., Berry, C. C. & Bushman, F. D. HIV integration site selection: analysis by massively parallel pyrosequencing reveals association with epigenetic modifications. Genome Res. 17, 1186–1194 (2007). · DOI · Paper page
- Young, A. R. & Narita, M. Oncogenic HMGA2: short or small? Genes Dev. 21, 1005–1009 (2007). · DOI
- Ikeda, K., Mason, P. J. & Bessler, M. 3′UTR-truncated Hmga2 cDNA causes MPN-like hematopoiesis by conferring a clonal growth advantage at the level of HSC in mice. Blood 117, 5860–5869 (2011). · DOI
- Bonner, M. A. et al. 3′UTR-truncated HMGA2 overexpression induces non-malignant in vivo expansion of hematopoietic stem cells in non-human primates. Mol. Ther. Methods Clin. Dev. 21, 693–701 (2021). · DOI
- Yang, F. C. et al. Nf1-dependent tumors require a microenvironment containing Nf1+/− and c-kit-dependent bone marrow. Cell 135, 437–448 (2008). · DOI
- Heckl, D. et al. Lentiviral vector induced insertional haploinsufficiency of Ebf1 causes murine leukemia. Mol. Ther. 20, 1187–1195 (2012). · DOI
- Seet, C. S. et al. Generation of mature T cells from human hematopoietic stem and progenitor cells in artificial thymic organoids. Nat. Methods 14, 521–530 (2017). · DOI
Cited by
Hematologic Cancer after Gene Therapy for Cerebral Adrenoleukodystrophy
Duncan, C. N., Bledsoe, J. R., Grzywacz, B., Beckman, A., Bonner, M., Eichler, F. S., Kühl, J.-S., Harris, M. H., Slauson, S., Colvin, R. A., et al. (2024) · New England Journal of Medicine · doi:10.1056/nejmoa2405541 · Cited by 164
Ex vivo modification of hematopoietic stem and progenitor cells for gene therapy
Williams, D. A., Kohn, D. B., & Thrasher, A. J. (2025) · Molecular Therapy · doi:10.1016/j.ymthe.2025.03.058 · Cited by 11
Metadata
- Authors
- De Ravin, S. S., Liu, S., Sweeney, C. L., Brault, J., Whiting-Theobald, N., Ma, M., Liu, T., Choi, U., Lee, J., O’Brien, S. A., Quackenbush, P., Estwick, T., Karra, A., Docking, E., Kwatemaa, N., Guo, S., Su, L., Sun, Z., Zhou, S., Puck, J., Cowan, M. J., Notarangelo, L. D., Kang, E., Malech, H. L., & Wu, X.
- ORCID
- Venue
- Nature Communications
- Published
- 2022-06-28
- Volume
- 13
- Issue
- 1
- ISSN
- 2041-1723
- PMC
- PMC9240040
- Cited by
- 51
- References
- 4
- Language
- en
- Funders
- Division of Intramural Research, National Institute of Allergy and Infectious Diseases (Z01-Al-00988, Z01-Al-00644)
About these checks
Registry, retraction, Cites and statistics results are computed, not judged, with one exception: a printed reference that no index lists is read once by a model before it counts as a citation error. Claims are extracted by a model and kept only when their quote appears verbatim in the text; each cited source is then checked, with a model’s help, for whether it says what the claim relies on. Those verdicts can be wrong — read the claim’s quote and the cited source before relying on one.
Statistics and arithmetic are recomputed, not judged.
Confidence bands are shown only for fields calibrated on our annotated test set. None is calibrated yet, so no band is shown.
What counts as a claim ›How we measure confidence ›How we check this ›
Are you an author, or do you see a problem with this page? Request a review
How to cite
Cite CoChat for the checks on this page, and the paper for its own findings.
- This page
- CoChat. (2026). Citation check: Lentivector cryptic splicing mediates increase in CD34+ clones expressing truncated HMGA2 in human X-linked severe combined immunodeficiency. https://app.cochat.ai/papers/10.1038/s41467-022-31344-x
- The paper
- De Ravin, S. S., Liu, S., Sweeney, C. L., Brault, J., Whiting-Theobald, N., Ma, M., Liu, T., Choi, U., Lee, J., O’Brien, S. A., Quackenbush, P., Estwick, T., Karra, A., Docking, E., Kwatemaa, N., Guo, S., Su, L., Sun, Z., Zhou, S., . . . Wu, X. (2022). Lentivector cryptic splicing mediates increase in CD34+ clones expressing truncated HMGA2 in human X-linked severe combined immunodeficiency. Nature Communications. https://doi.org/10.1038/s41467-022-31344-x
