

The DOI matches its Crossref record; 3 of the 3 references it cites were found in a registry or an index.
Quantitative fragmentomics allow affinity mapping of interactomes
Open accessPublished version of a preprint
Abstract
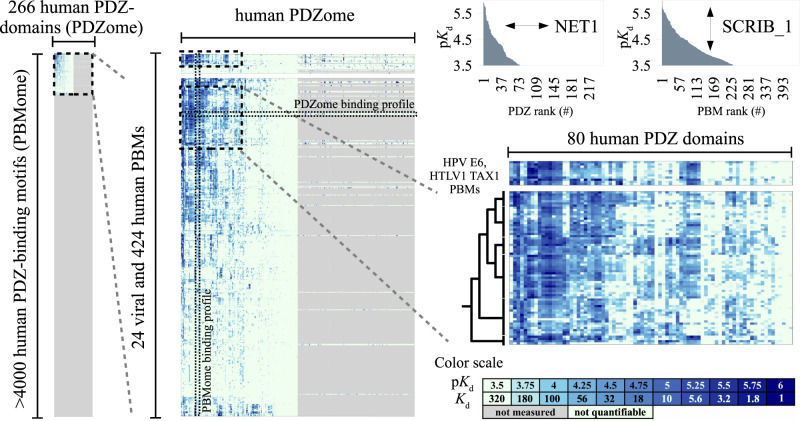
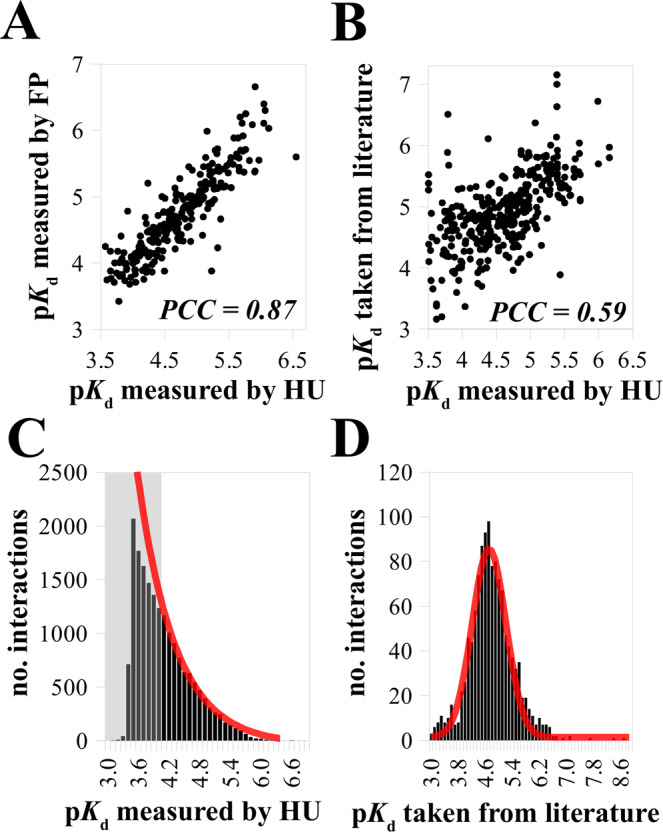
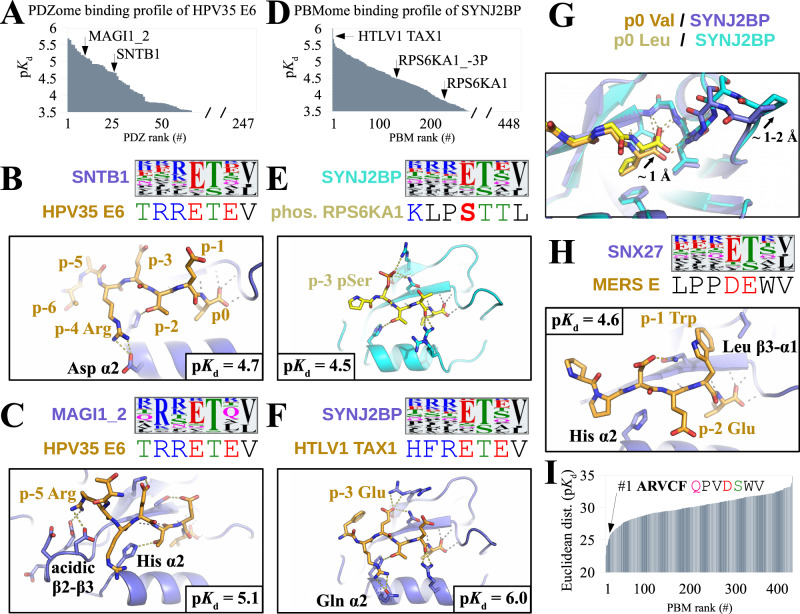
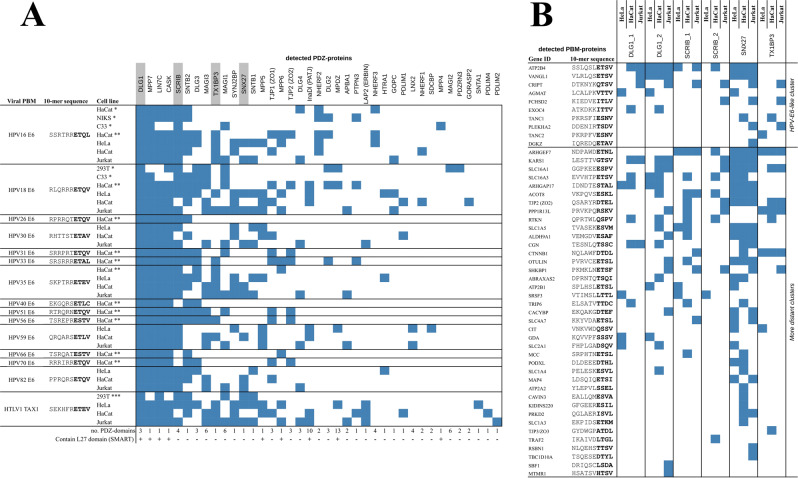
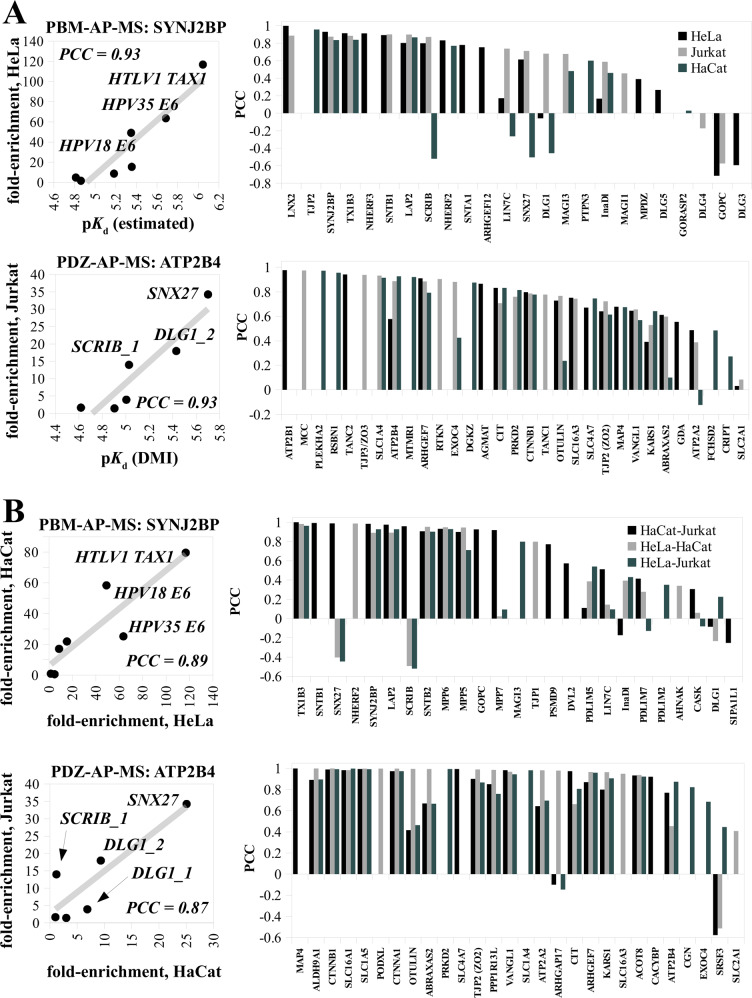
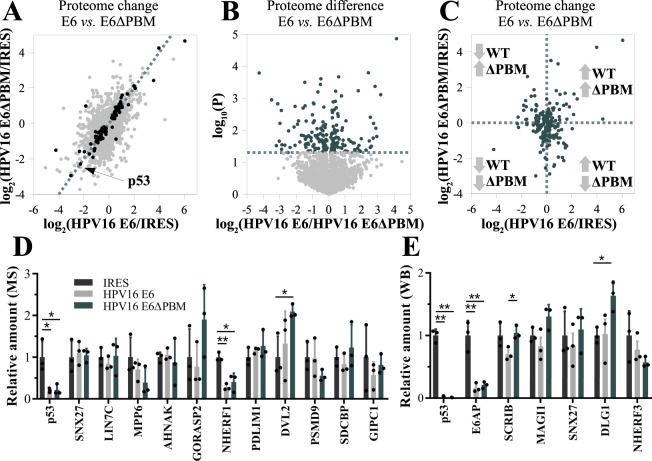
Human protein networks have been widely explored but most binding affinities remain unknown, hindering quantitative interactome-function studies. Yet interactomes rely on minimal interacting fragments displaying quantifiable affinities. Here, we measure the affinities of 65,000 interactions involving PDZ domains and their target PDZ-binding motifs (PBM) within a human interactome region particularly relevant for viral infection and cancer. We calculate interactomic distances, identify hot spots for viral interference, generate binding profiles and specificity logos, and explain selected cases by crystallographic studies. Mass spectrometry experiments on cell extracts and literature surveys show that quantitative fragmentomics effectively complements protein interactomics by providing affinities and completeness of coverage, putting a full human interactome affinity survey within reach. Finally, we show that interactome hijacking by the viral PBM of human papillomavirus E6 oncoprotein substantially impacts the host cell proteome beyond immediate E6 binders, illustrating the complex system-wide relationship between interactome and function.
Overview
The claims and statistics of this paper haven’t been checked yet.
Run the check — free, no account needed. It reads the open-access text and checks the sources it cites.
Integrity signals
Registry
Cites
Statistics
Figures
Verification
Claims the paper makes
The claims and statistics of this paper haven’t been checked yet.
Run the check — free, no account needed. It reads the open-access text and checks the sources it cites.
Self-check
Percentages, sums and reported differences re-computed from the paper’s own numbers.
The self-check needs the paper’s full text.
Citations
Cites
Highly accurate protein structure prediction for the human proteome
Tunyasuvunakool, K., Adler, J., Wu, Z., Green, T., Zielinski, M., Žídek, A., Bridgland, A., Cowie, A., Meyer, C., Laydon, A., et al. (2021) · Nature · doi:10.1038/s41586-021-03828-1 · Cited by 3,025 · cited 1×
“Once measured, frag-mental af fi nities could then be combined with proteome-wide structure modeling tools such as Alphafold 57 , for the theoretically challenging yet exciting structure-guided prediction of binding properties of all interactomic combinations of multiple proteoforms.”
MethodHow many human proteoforms are there?
Aebersold, R., Agar, J. N., Amster, I. J., Baker, M. S., Bertozzi, C. R., Boja, E. S., Costello, C. E., Cravatt, B. F., Fenselau, C., Garcia, B. A., et al. (2018) · Nature Chemical Biology · doi:10.1038/nchembio.2576 · Cited by 907
A Specificity Map for the PDZ Domain Family
Tonikian, R., Zhang, Y., Sazinsky, S. L., Currell, B., Yeh, J.-H., Reva, B., Held, H. A., Appleton, B. A., Evangelista, M., Wu, Y., et al. (2008) · PLoS Biology · doi:10.1371/journal.pbio.0060239 · Cited by 476
Research works printed but not linked: 77
- Luck, K., Sheynkman, G. M., Zhang, I. & Vidal, M. Proteome-scale human interactomics. Trends Biochem. Sci. 42, 342–354 (2017). · DOI
- Luck, K. et al. A reference map of the human binary protein interactome. Nature 580, 402–408 (2020). · DOI · Paper page
- Huttlin, E. L. et al. Dual proteome-scale networks reveal cell-specific remodeling of the human interactome. Cell 184, 3022–3040.e28 (2021). · DOI · Paper page
- Skinnider, M. A. & Foster, L. J. Meta-analysis defines principles for the design and analysis of co-fractionation mass spectrometry experiments. Nat. Methods 18, 806–815 (2021). · DOI
- Pawson, T. & Nash, P. Assembly of cell regulatory systems through protein interaction domains. Science 300, 445–452 (2003). · DOI
- Diella, F. et al. Understanding eukaryotic linear motifs and their role in cell signaling and regulation. Front. Biosci. 13, 6580–6603 (2008). · DOI
- Jadwin, J. A., Ogiue-Ikeda, M. & MacHida, K. The application of modular protein domains in proteomics. FEBS Lett. 586, 2586–2596 (2012). · DOI
- Tompa, P., Davey, N. E., Gibson, T. J. & Babu, M. M. Review a million peptide motifs for the molecular biologist. Mol. Cell 55, 161–169 (2014). · DOI
- Kumar, M. et al. ELM—the eukaryotic linear motif resource in 2020. Nucleic Acids Res 48, 1–11 (2019).
- Kelil, A., Levy, E. D. & Michnick, S. W. Evolution of domain-peptide interactions to coadapt specificity and affinity to functional diversity. Proc. Natl Acad. Sci. U.S.A. 113, E3862–E3871 (2016). · DOI
- Ivarsson, Y. & Jemth, P. Affinity and specificity of motif-based protein–protein interactions. Curr. Opin. Struct. Biol. 54, 26–33 (2019). · DOI
- Davey, N. E., Travé, G. & Gibson, T. J. How viruses hijack cell regulation. Trends Biochem. Sci. 36, 159–169 (2011). · DOI
- James, C. D. & Roberts, S. Viral Interactions with PDZ domain-containing proteins—an oncogenic trait? Pahogens 5, 1–22 (2016).
- Seo, M. H. & Kim, P. M. The present and the future of motif-mediated protein–protein interactions. Curr. Opin. Struct. Biol. 50, 162–170 (2018). · DOI
- Sámano-Sánchez, H. & Gibson, T. J. Mimicry of short linear motifs by bacterial pathogens: a drugging opportunity. Trends Biochem. Sci. 45, 526–544 (2020). · DOI
- Luck, K., Charbonnier, S. & Travé, G. The emerging contribution of sequence context to the specificity of protein interactions mediated by PDZ domains. FEBS Lett. 586, 2648–2661 (2012). · DOI
- Stiffler, M. A. et al. PDZ domain binding selectivity is optimized across the mouse proteome. Science 317, 364–370 (2007). · DOI
- Vincentelli, R. et al. Quantifying domain-ligand affinities and specificities by high-throughput holdup assay. Nat. Methods 12, 787–93 (2015). · DOI
- Gógl, G. et al. Rewiring of RSK–PDZ interactome by linear motif phosphorylation. J. Mol. Biol. 431, 1234–1249 (2019). · DOI
- Gogl, G. et al. Dual specificity PDZ- and 14-3-3-binding motifs: a structural and interactomics study. Structure 28, 747–759.e3 (2020). · DOI
- Jané, P. et al. Interactomic affinity profiling by holdup assay: acetylation and distal residues impact the PDZome-binding specificity of PTEN phosphatase. PLoS One 1–24, https://doi.org/10.1101/2020.07.01.181487 (2020). · DOI
- Javier, R. T. & Rice, A. P. Emerging theme: cellular PDZ proteins as common targets of pathogenic viruses. J. Virol. 85, 11544–11556 (2011). · DOI · Paper page
- Banks, L., Pim, D. & Thomas, M. Human tumour viruses and the deregulation of cell polarity in cancer. Nat. Rev. Cancer 12, 877–886 (2012). · DOI
- Jimenez-Guardeño, J. M. et al. The PDZ-binding motif of severe acute respiratory syndrome coronavirus envelope protein is a determinant of viral pathogenesis. PLoS Pathog. 10, e1004320 (2014). · DOI
- Caillet-Saguy, C. et al. Host PDZ-containing proteins targeted by SARS-CoV-2. FEBS J. 1–15, https://doi.org/10.1111/febs.15881 (2021). · DOI
- Duhoo, Y. et al. High throughput production of a newly designed library of soluble human single and tandem PDZ domains allows semi-quantitative PDZ-peptide interaction screening through high throughput holdup assay. Methods Mol. Biol. 2025, 439–476 (2019). · DOI
- Charbonnier, S., Zanier, K., Masson, M. & Travé, G. Capturing protein-protein complexes at equilibrium: the holdup comparative chromatographic retention assay. Protein Expr. Purif. 50, 89–101 (2006). · DOI
- Amacher, J. F., Brooks, L., Hampton, T. H. & Madden, D. R. Specificity in PDZ-peptide interaction networks: computational analysis and review. J. Struct. Biol. X 4, 100022 (2020).
- Oughtred, R. et al. The BioGRID database: a comprehensive biomedical resource of curated protein, genetic, and chemical interactions. Protein Sci. 30, 187–200 (2021). · DOI · Paper page
- Kerrien, S. et al. The IntAct molecular interaction database in 2012. Nucleic Acids Res. 40, 841–846 (2012). · DOI
- Etienne-Manneville, S. Polarity proteins in migration and invasion. Oncogene 27, 6970–6980 (2008). · DOI
- Schneider, T. D. & Stephens, R. M. Sequence logos: a new way to display consensus sequences. Nucleic Acids Res. 18, 6097–6100 (1990). · DOI
- McBride, A. A. Oncogenic human papillomaviruses. Philos. Trans. R. Soc. B Biol. Sci. 372, 20160273 (2017). · DOI
- Manel, N., Battini, J. L., Taylor, N. & Sitbon, M. HTLV-1 tropism and envelope receptor. Oncogene 24, 6016–6025 (2005). · DOI
- Futsch, N., Mahieux, R. & Dutartre, H. HTLV-1, the other pathogenic yet neglected human retrovirus: from transmission to therapeutic treatment. Viruses 10, 1–25 (2018). · DOI · Paper page
- Thomas, M., Myers, M. P., Massimi, P., Guarnaccia, C. & Banks, L. Analysis of multiple HPV E6 PDZ interactions defines type-specific PDZ fingerprints that predict oncogenic potential. PLoS Pathog. 12, 1–21 (2016). · DOI
- Strickland, S. W., Brimer, N., Lyons, C. & Vande Pol, S. B. Human papillomavirus E6 interaction with cellular PDZ domain proteins modulates YAP nuclear localization. Virology 516, 127–138 (2018). · DOI
- Al-Saleem, J. et al. HTLV-1 Tax-1 interacts with SNX27 to regulate cellular localization of the HTLV-1 receptor molecule, GLUT1. PLoS One 14, 1–19 (2019). · DOI
- Bohl, J., Brimer, N., Lyons, C. & Vande Pol, S. B. The Stardust family protein MPP7 forms a tripartite complex with LIN7 and DLG1 that regulates the stability and localization of DLG1 to cell junctions. J. Biol. Chem. 282, 9392–9400 (2007). · DOI
- Harington, K. J. & Syrigos, K. N. The role of E-cadherin-catenin complex: more than an intercellular glue? Ann. Surg. Oncol. 7, 783–788 (2000). · DOI
- Valdes, J. L. et al. Sorting nexin 27 protein regulates trafficking of a p21-activated kinase (PAK) interacting exchange factor (β-Pix)-G protein-coupled receptor kinase interacting protein (GIT) complex via a PDZ domain interaction. J. Biol. Chem. 286, 39403–39416 (2011). · DOI
- Keilhauer, E. C., Hein, M. Y. & Mann, M. Accurate protein complex retrieval by affinity enrichment mass spectrometry (AE-MS) rather than affinity purification mass spectrometry (AP-MS). Mol. Cell. Proteom. 14, 120–135 (2015). · DOI
- Kitov, P. I. & Bundle, D. R. On the nature of the multivalency effect: a thermodynamic model. J. Am. Chem. Soc. 125, 16271–16284 (2003). · DOI
- Zanier, K. et al. Solution structure analysis of the HPV16 E6 oncoprotein reveals a self-association mechanism required for E6-mediated degradation of p53. Structure 20, 604–617 (2012). · DOI
- Zanier, K. et al. Structural basis for hijacking of cellular LxxLL motifs by papillomavirus E6 oncoproteins. Science 339, 694–698 (2013). · DOI
- Suarez, I. & Trave, G. Structural insights in multifunctional papillomavirus oncoproteins. Viruses 10, 1–22 (2018). · DOI
- White, E. A. et al. Comprehensive analysis of host cellular interactions with human papillomavirus E6 proteins identifies new E6 binding partners and reflects viral diversity. J. Virol. 86, 13174–13186 (2012). · DOI · Paper page
- Vande Pol, S. B. & Klingelhutz, A. J. Papillomavirus E6 oncoproteins. Virology 445, 115–137 (2013). · DOI
- Martinez-Zapien, D. et al. Structure of the E6/E6AP/p53 complex required for HPV-mediated degradation of p53. Nature 529, 541–545 (2016). · DOI
- Scheffner, M., Huibregtse, J. M., Vierstra, R. D. & Howley, P. M. The HPV-16 E6 and E6-AP complex functions as a ubiquitin-protein ligase in the ubiquitination of p53. Cell 75, 495–505 (1993). · DOI
- Delury, C. P. et al. The role of protein kinase A regulation of the E6 PDZ-binding domain during the differentiation-dependent life cycle of human papillomavirus type 18. J. Virol. 87, 9463–9472 (2013). · DOI
- Skinnider, M. A. et al. An atlas of protein-protein interactions across mouse tissues. Cell 184, 4073–4089.e17 (2021). · DOI
- Poverennaya, E. V., Kiseleva, O. I., Ivanov, A. S. & Ponomarenko, E. A. Methods of computational interactomics for investigating interactions of human proteoforms. Biochem 85, 68–79 (2020).
- Mc Conkey, E. Molecular evolution, intracellular organization, and the quinary structure of proteins. Proc. Natl Acad. Sci. U.S.A. 79, 3236–3240 (1982). · DOI
- Gierasch, L. M. & Gershenson, A. Post-reductionist protein science, or putting Humpty Dumpty back together again. Nat. Chem. Bio 5, 774–777 (2009). · DOI
- Gogl, G. et al. Hierarchized phosphotarget binding by the seven human 14-3-3 isoforms. Nat. Commun. 12, 1677 (2021). · DOI · Paper page
- Li, M., He, Y., Feng, X. & Huang, J. Genome-wide studies of the transcriptional regulation by p53. Biochim. Biophys. Acta—Gene Regul. Mech. 1819, 684–687 (2012). · DOI
- Catoe, H. W. & Nawaz, Z. E6-AP facilitates efficient transcription at estrogen-responsive promoters through recruitment of chromatin modifiers. Steroids 76, 897–902 (2011).
- Lopez, S. J., Segal, D. J. & LaSalle, J. M. UBE3A: An E3 ubiquitin ligase with genome-wide impact in neurodevelopmental disease. Front. Mol. Neurosci. 11, 1–8 (2019). · DOI
- Bonhoure, A. et al. Benchtop holdup assay for quantitative affinity-based analysis of sequence determinants of protein-motif interactions. Anal. Biochem. 603, 113772 (2020). · DOI
- Nominé, Y. et al. A strategy for optimizing the monodispersity of fusion proteins: application to purification of recombinant HPV E6 oncoprotein. Protein Eng. 14, 297–305 (2001). · DOI
- Duhoo, Y. et al. High-throughput production of oxidized animal toxins in Escherichia coli. Methods Mol. Biol. 2025, 165–190 (2019). · DOI
- Jané, P., Chiron, L., Bich, G., Travé, G. & Nominé, Y. A computational protocol to analyze PDZ/PBM affinity data obtained by high-throughput holdup assay. Methods Mol. Biol. 2256, 61–74 (2021). · DOI
- Genera, M. et al. Molecular basis of the interaction of the human tyrosine phosphatase PTPN3 with the hepatitis B virus core protein. Sci. Rep. 11, 1–17 (2021). · DOI
- Giraud, E. et al. Role of PDZ-binding motif from West Nile virus NS5 protein on viral replication. Sci. Rep. 11, 1–13 (2021). · DOI
- Simon, M. et al. High throughput competitive fluorescence polarization assay reveals functional redundancy in the S100 protein family. FEBS J. 1–13, https://doi.org/10.1101/718155 (2020). · DOI
- Roehrl, M. H. A., Wang, J. Y. & Wagner, G. A general framework for development and data analysis of competitive high-throughput screens for small-molecule inhibitors of protein-protein interactions by fluorescence polarization. Biochemistry 43, 16056–16066 (2004). · DOI
- Gógl, G. et al. Dynamic control of RSK complexes by phosphoswitch-based regulation. FEBS J. 285, 46–71 (2018). · DOI
- Ecsédi, P. et al. Structure determination of the transactivation domain of p53 in complex with S100A4 using Annexin A2 as a crystallization chaperone. Structure 28, 943–953.e4 (2020). · DOI
- Cousido-Siah, A. et al. A scalable strategy to solve structures of PDZ domains and their complexes. Acta Crystallogr. D. Struct. Biol. 78, 509–516 (2022). · DOI
- Kabsch, W. XDS. Acta Cryst. D. 66, 125–132 (2010). · DOI · Paper page
- McCoy, A. J. et al. Phaser crystallographic software. J. Appl. Crystallogr. 40, 658–674 (2007). · DOI · Paper page
- Adams, P. D. et al. PHENIX: a comprehensive Python-based system for macromolecular structure solution. Acta Cryst. D. 66, 213–21 (2010). · DOI · Paper page
- Howarth, M., Takao, K., Hayashi, Y. & Ting, A. Y. Targeting quantum dots to surface proteins in living cells with biotin ligase. Proc. Natl Acad. Sci. U.S.A. 102, 7583–7588 (2005). · DOI
- Zámbó, B. et al. Cellular expression and function of naturally occurring variants of the human ABCG2 multidrug transporter. Cell. Mol. Life Sci. 77, 365–378 (2020). · DOI
- Mátés, L. et al. Molecular evolution of a novel hyperactive Sleeping Beauty transposase enables robust stable gene transfer in vertebrates. Nat. Genet. 41, 753–761 (2009). · DOI
- Kolacsek, O. et al. Reliable transgene-independent method for determining sleeping beauty transposon copy numbers. Mob. DNA 4, 1–8 (2013). · DOI
Metadata
- Authors
- Gogl, G., Zambo, B., Kostmann, C., Cousido-Siah, A., Morlet, B., Durbesson, F., Negroni, L., Eberling, P., Jané, P., Nominé, Y., Zeke, A., Østergaard, S., Monsellier, É., Vincentelli, R., & Travé, G.
- Affiliations
- Centre National de la Recherche Scientifique (FR)
- Novo Nordisk (Denmark) (DK)
- Corresponding author
- Travé, Gilles
- ORCID
- Venue
- Nature Communications
- Published
- 2022-09-17
- Volume
- 13
- Issue
- 1
- Pages
- 5472-5472
- ISSN
- 2041-1723 (ISSN-L)
- PMC
- PMC9482650
- OpenAlex
- W4296139765
- Cited by
- 51
- References
- 3
- Citations by year
- 2026: 15 · 2025: 8 · 2024: 13 · 2023: 11 · 2022: 4
- FWCI
- 2.94
- Type
- journal article
- Language
- en
- Update notices
- correction (2022-12-07)
- Open access
- gold
- doi.org
- Locations
- Nature Communications (publishedVersion, cc-by)
- bioRxiv (Cold Spring Harbor Laboratory) (acceptedVersion, cc-by-nc-nd)
- PubMed Central (publishedVersion, cc-by)
- PubMed (publishedVersion)
- DORA PSI (Paul Scherrer Institute) (submittedVersion, other-oa)
- HAL (submittedVersion)
- HAL (submittedVersion, cc-by)
- RePEc: Research Papers in Economics (submittedVersion)
- DOAJ (DOAJ: Directory of Open Access Journals) (submittedVersion, cc-by-sa)
- Funders
- Agence Nationale de la Recherche (ANR-10-INSB-05-01., 10-INSB-05-01, 10 IDEX 0002, ANR-10-IDEX-0002, ANR- 10-INSB-05, ANR-17-EURE-, ANR-20-SFRI-0012, ANR-18-CE92-0017, ANR-17-EURE-0023, ANR18, ANR-10-IDEX, ANR-18-EURE-0023, ANR-17, ANR-10, ANR-10-INBS-0005)
- Institut National de la Santé et de la Recherche Médicale (ANR 10 IDEX 0002, ANR-17-EURE-0023, ANR-20-SFRI-0012)
- Fondation pour la Recherche Médicale (SPF202005011975, ANR-17-EURE-0023, ANR-10-IDEX-0002, ANR 20-SFRI-0012)
- Université de Strasbourg (ANR 20-SFRI-0012, 10-IDEX-0002, ANR-10-IDEX- 0002, ANR-17-EURE-0023, ITI 2021 2028)
- Fondation ARC pour la Recherche sur le Cancer (ANR-10-IDEX-0002, ANR 20-SFRI-0012, ANR-17-EURE-0023)
- Ligue Contre le Cancer (ANR-10-IDEX-0002, ANR-17-EURE-0023, ANR 20-SFRI-0012, Équipe labellisée 2015)
- Centre National de la Recherche Scientifique (ANR-10-IDEX-0002, ANR-17-EURE-0023, 2021-2028, ANR 20 SFRI 0012)
- French Infrastructure for Integrated Structural Biology (ANR-10- INSB-05, ANR-10-INSB-0501, INSB-05)
- Topics
- Life Sciences › Biochemistry, Genetics and Molecular Biology › Molecular Biology › Bioinformatics and Genomic Networks
- Physical Sciences › Chemistry › Spectroscopy › Advanced Proteomics Techniques and Applications
- Life Sciences › Biochemistry, Genetics and Molecular Biology › Cell Biology › Biotin and Related Studies
- Keywords
- protein-protein interaction, binding affinity, PDZ domain, PDZ-binding motif, human interactome, interactome mapping, viral interference, E6 oncoprotein, host-virus interaction, viral infection, cancer
- MeSH terms
- Cell Extracts, Humans, Mass Spectrometry, Proteome, Papillomaviridae, PDZ Domains
About these checks
Registry, retraction, Cites and statistics results are computed, not judged, with one exception: a printed reference that no index lists is read once by a model before it counts as a citation error. Claims are extracted by a model and kept only when their quote appears verbatim in the text; each cited source is then checked, with a model’s help, for whether it says what the claim relies on. Those verdicts can be wrong — read the claim’s quote and the cited source before relying on one.
Statistics and arithmetic are recomputed, not judged.
Confidence bands are shown only for fields calibrated on our annotated test set. None is calibrated yet, so no band is shown.
What counts as a claim ›How we measure confidence ›How we check this ›
Are you an author, or do you see a problem with this page? Request a review
How to cite
Cite CoChat for the checks on this page, and the paper for its own findings.
- This page
- CoChat. (2026). Citation check: Quantitative fragmentomics allow affinity mapping of interactomes. https://app.cochat.ai/papers/10.1038/s41467-022-33018-0
- The paper
- Gogl, G., Zambo, B., Kostmann, C., Cousido-Siah, A., Morlet, B., Durbesson, F., Negroni, L., Eberling, P., Jané, P., Nominé, Y., Zeke, A., Østergaard, S., Monsellier, É., Vincentelli, R., & Travé, G. (2022). Quantitative fragmentomics allow affinity mapping of interactomes. Nature Communications. https://doi.org/10.1038/s41467-022-33018-0
