

The DOI matches its Crossref record; 77 of the 83 references it cites were found in a registry or an index; 18 of the 24 sources its claims cite were checked for support.
Highly accurate protein structure prediction for the human proteome
Open accessAbstract
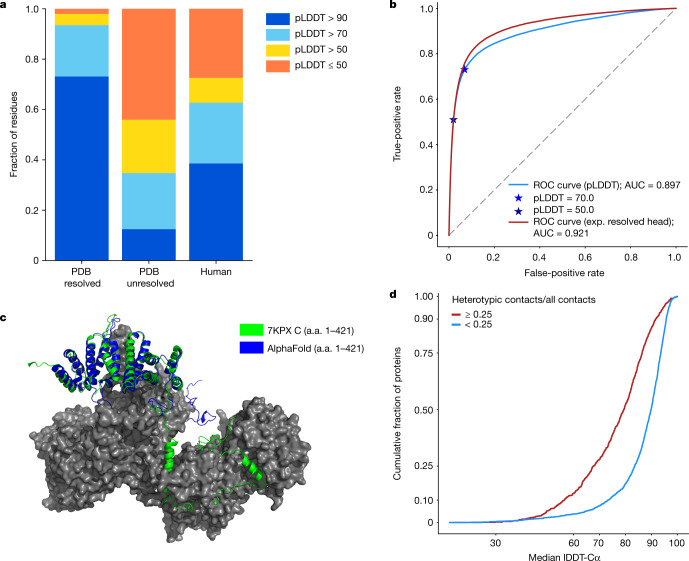
Protein structures can provide invaluable information, both for reasoning about biological processes and for enabling interventions such as structure-based drug development or targeted mutagenesis. After decades of effort, 17% of the total residues in human protein sequences are covered by an experimentally determined structure 1 . Here we markedly expand the structural coverage of the proteome by applying the state-of-the-art machine learning method, AlphaFold 2 , at a scale that covers almost the entire human proteome (98.5% of human proteins). The resulting dataset covers 58% of residues with a confident prediction, of which a subset (36% of all residues) have very high confidence. We introduce several metrics developed by building on the AlphaFold model and use them to interpret the dataset, identifying strong multi-domain predictions as well as regions that are likely to be disordered. Finally, we provide some case studies to illustrate how high-quality predictions could be used to generate biological hypotheses. We are making our predictions freely available to the community and anticipate that routine large-scale and high-accuracy structure prediction will become an important tool that will allow new questions to be addressed from a structural perspective.
Overview
CoChat Summary
TL;DR
AlphaFold2 was applied to 98.5% of human proteins, producing confident predictions for 58% of residues and very high confidence for 36% of all residues. The paper introduces pLDDT, pTM and an experimentally resolved head to interpret the dataset, presents case studies, and releases predictions freely.
Key findings
- The dataset covers 98.5% of human proteins with full-chain predictions, amounting to 10,537,122 residues (92.5% of residues); 58.0% of residues were predicted confidently (pLDDT > 70), and 35.7% of total residues fell in the highest accuracy band (pLDDT > 90), double the residues covered by experimental structures.
- At the per-protein level, 43.8% of proteins had a confident prediction on at least three quarters of their sequence, and 1,290 proteins contained a substantial region (>200 residues) with pLDDT ≥ 70 and no good template.
- On a held-out set of long PDB chains (n = 151), 70% of predictions had a TM-score > 0.7; pTM correlated with actual TM-score at Pearson’s r = 0.84, and among human proteins enriched for novel multidomain predictions, 187 had pTM > 0.8 and 343 had pTM > 0.7.
- pLDDT performed as a competitive disorder predictor on the CAID benchmark with AUC 0.897, while the experimentally resolved head achieved AUC 0.921; case studies proposed mechanistic hypotheses for G6Pase-α, DGAT2 and wolframin.
Methods
- AlphaFold2 was applied to the UniProt human reference proteome (release 2021_02), attempting all sequences of 16–2,700 amino acids and excluding residue codes B, J, O, U, Z or X; the pipeline used MSA construction, template search, inference with five models, model ranking by mean pLDDT, and constrained relaxation, with Reduced BFD and reduced ensembling.
- Evaluation used a recent PDB dataset of 12,494 chains, CAMEO targets from 21 March 2020 to 13 March 2021, and the CAID Disprot-PDB benchmark; metrics included pLDDT, pTM, the experimentally resolved head, TM-score, lDDT-Cα and AUC.
- Case-study analyses used PyMOL, P2Rank, AutoDockTools, AutoDock Vina and TM-align; inference for the human proteome used 930 GPU days, with an estimated 510 core days for other pipeline stages from scratch.
Limitations
- The paper states that low-confidence regions may reflect intrinsic disorder or regions structured only in complex, and that some proportion of proteins without confident predictions will be genuine failures where a fixed structure exists but AlphaFold does not predict it.
- The paper states that inter-domain accuracy is expected to be lower than within-domain accuracy, that some multidomain proteins may have mobile domains with no fixed packing, and that the case-study biological hypotheses require experimental confirmation.
- Evident from the text: predictions are single-chain and exclude sequences longer than 2,700 residues, so complex-dependent structure and larger proteins are not directly addressed.
Model-written summary. Check it against the paper before relying on it.
Integrity signals
Registry
Cites
Statistics
Figures




![Extended Data Fig. 7 Relationship between sequence length and run time for the non-inference stages of the pipeline. On the basis of 240 human protein sequences, chosen by stratified sampling from the length buckets: [16, 500), [500, 1,000), [1,000, 1,500), [1,500, 2,000), [2,000, 2,500) and [2,500, 2,700]. The relax plot shows five times more points, since five relaxed models are generated per protein. Coefficients for the quadratic lines of best fit were computed with Numpy polyfit.](https://figures.cochat.ai/paper-figures/c9bdcad64694429b95a292e248c7f05a/highly-accurate-protein-structure-prediction-for-the-human-proteome-figure-11.jpg)
Verification
Claims the paper makes
14 Valid · 1 Not valid · 5 Not checked · 44 Own results and interpretations
The cited sources support only part of this claim — read each source’s verdict below.
In the paper
“This system used a completely different model from our CASP13 entry31, and demonstrated a considerable improvement over previous methods in terms of providing routinely high accuracy29,30.”
§ Highly accurate protein structure prediction for the human proteome > Main
What the sources say
- Partly supportedcites [29] Kryshtafovych, A., Schwede, T., Topf, M., Fidelis, K. & Moult, J. Critical assessment of methods of protein structure prediction (CASP)-round XIII. Proteins 87, 1011–1020 (2019). sourceExperimental — accuracy not yet measured
The PROGRESS IN CASP13 section reports a dramatic improvement in model accuracy over earlier CASP rounds, and TEMPLATE FREE MODELING says DeepMind’s A7D group had the most accurate results overall. Those passages concern CASP13 methods, not the different system in the citing sentence; they do not establish that AlphaFold2 routinely achieved high accuracy. (LLM, conf=0.84)
- Supportedcites [30] Pereira, J. et al. High-accuracy protein structure prediction in CASP14. Proteins https://doi.org/10.1002/prot.26171 (2021). source
The Abstract reports a large leap in high accuracy due to AF2. The Conclusions say AF2 substantially outperformed its predecessor and produced the best models for 89 of 97 CASP14 targets, supporting both the improvement and its routine high accuracy. (LLM, conf=0.94)
boostedstates a cause- Asserted: passes — The authors put it forward as true.
- Checkable: passes — It can be checked against evidence.
- Load-bearing: passes — The paper’s conclusions depend on it.
- Based: passes — The paper gives a reason why it holds.
- Partly supported
Every source the paper cites for this claim was checked and supports it.
In the paper
“We note that the accuracy of AlphaFold was validated in CASP142, which focuses on challenging proteins that are dissimilar to structures already available in the PDB.”
§ Highly accurate protein structure prediction for the human proteome > Model confidence and added coverage
What the sources say
- Supportedcites [2] Jumper, J. et al. Highly accurate protein structure prediction with AlphaFold. Nature https://doi.org/10.1038/s41586-021-03819-2 (2021). source
The paper’s CASP14 assessment passage (section and page not provided in our copy) says AlphaFold was entered into CASP14, describes it as a blind accuracy assessment, and reports that AlphaFold’s structures were substantially more accurate than competing methods. This supports the attributed claim that its accuracy was validated in CASP14. (LLM, conf=0.94)
plain- Asserted: passes — The authors put it forward as true.
- Checkable: passes — It can be checked against evidence.
- Load-bearing: unclear — It is unclear whether the paper’s conclusions depend on it.
- Based: passes — The paper gives a reason why it holds.
- Supported
The cited sources support only part of this claim — read each source’s verdict below.
In the paper
“Despite being the most similar chain, 3F1Z lacks the cysteines that are present in wolframin, which could form disulfide cross-links in the endoplasmic reticulum59.”
§ Highly accurate protein structure prediction for the human proteome > Highlighted predictions > Wolframin
What the sources say
- Partly supportedcites [59] Fass, D. & Thorpe, C. Chemistry and enzymology of disulfide cross-linking in proteins. Chem. Rev. 118, 1169–1198 (2018). sourceExperimental — accuracy not yet measured
Section 2, “Which Proteins Contain Disulfides” (page unavailable), says that proteins in or passing through the ER can have cysteines positioned to form disulfide bonds. It does not address wolframin, 3F1Z, or whether their cysteine residues differ, so it supports only the general possibility of ER disulfide cross-linking. (LLM, conf=0.86)
hedged- Asserted: passes — The authors put it forward as true.
- Checkable: passes — It can be checked against evidence.
- Load-bearing: unclear — It is unclear whether the paper’s conclusions depend on it.
- Based: passes — The paper gives a reason why it holds.
- Partly supported
The sources with a verdict support this claim; the rest weren’t checked yet, have no full text we could read, or their verdicts aren’t rated yet.
In the paper
“Comparing our prediction for this region (median pLDDT of 86.0) to existing PDB chains using TM-align42,57 identified 3F1Z58 as the most similar known chain (TM-score of 0.472) (Fig. 3c, magenta).”
§ Highly accurate protein structure prediction for the human proteome > Highlighted predictions > Wolframin
What the sources say
- Not checked — no full text of the sourcecites [42] Zhang, Y. & Skolnick, J. Scoring function for automated assessment of protein structure template quality. Proteins 57, 702–710 (2004). source
- Supportedcites [57] Zhang, Y. & Skolnick, J. TM-align: a protein structure alignment algorithm based on the TM-score. Nucleic Acids Res. 33, 2302–2309 (2005). source
The citation is attached to “using TM-align,” identifying the method used by the citing authors, not attributing their 3F1Z match or TM-score to this source. The source’s Results (Benchmark test; page unavailable) describes TM-align as a tool for comparing protein structures and reporting TM-scores. (LLM, conf=0.93)
- Supportedcites [58] Das, D. et al. The structure of KPN03535 (gi|152972051), a novel putative lipoprotein from Klebsiella pneumoniae, reveals an OB-fold. Acta Crystallogr. F 66, 1254–1260 (2010). source
The citation is attached to 3F1Z, identifying the PDB chain used in the citing authors’ comparison. The source paper’s Materials and methods section states that its KPN03535 structure was deposited under accession code 3f1z; the pLDDT and TM-score describe the citing authors’ own analysis, not a result attributed to this source. (LLM, conf=0.93)
plainstates an association- Asserted: passes — The authors put it forward as true.
- Checkable: passes — It can be checked against evidence.
- Load-bearing: unclear — It is unclear whether the paper’s conclusions depend on it.
- Based: passes — The paper gives a reason why it holds.
Every source the paper cites for this claim was checked and supports it.
In the paper
“A recent evolutionary analysis suggested domains for wolframin, which our prediction largely supports55.”
§ Highly accurate protein structure prediction for the human proteome > Highlighted predictions > Wolframin
What the sources say
- Supportedcites [55] Schäffer, D. E., Iyer, L. M., Burroughs, A. M. & Aravind, L. Functional innovation in the evolution of the calcium-dependent system of the eukaryotic endoplasmic reticulum. Front. Genet. 11, 34 (2020). source
The Results section, “Domain Architectural Anatomy and Functional Analysis of the Wolframin Protein,” reports the paper’s proposed domain assignments for wolframin, including Sel1-like repeats, an EF-hand region, and an OB-fold domain (Figure 4A). The citing authors’ statement that their own prediction largely supports those assignments is not a finding attributed to this source. (LLM, conf=0.93)
plainstates an association- Asserted: passes — The authors put it forward as true.
- Checkable: passes — It can be checked against evidence.
- Load-bearing: unclear — It is unclear whether the paper’s conclusions depend on it.
- Based: passes — The paper gives a reason why it holds.
- Supported
36 more claims · 4 with their cited sources checked
Create a free account to see all 64 claims and every source verdict.
- It may state two separate claims as one. 13
- Probably not a substantial claim. 12
Claims other papers make about this one
Each is checked against this paper’s own text: does it say what the citing paper says it does?
The source backs part of the claim, not all of it — or backs it for a different population, condition or comparison.
In the citing paper
“While AF2 performs exceptionally well on these types of folds on average”
From The power and pitfalls of AlphaFold2 for structure prediction beyond rigid globular proteins (2024) · cites this paper as [5]
Experimental — accuracy not yet measuredThe source backs part of the claim, not all of it — or backs it for a different population, condition or comparison.
In the citing paper
“For the majority of globular proteins, AF2 provides accurate, reliable models with high pLDDT (> 70) or low PAE values (< 5 Å) highlighting confidence in the prediction of the position of the atomic coordinates, which match experimentally determined native structures5,17,23,59”
From The power and pitfalls of AlphaFold2 for structure prediction beyond rigid globular proteins (2024) · cites this paper as [5]
Experimental — accuracy not yet measuredThe source backs part of the claim, not all of it — or backs it for a different population, condition or comparison.
In the citing paper
“The lower confidence bands appear to correlate well with backbone flexibility and intrinsic disorder (13) (Figure 2).”
From AlphaFold Protein Structure Database: massively expanding the structural coverage of protein-sequence space with high-accuracy models (2022) · cites this paper as [13]
Experimental — accuracy not yet measuredThe source backs part of the claim, not all of it — or backs it for a different population, condition or comparison.
In the citing paper
“One of the major insights leveraged by AlphaFold 1,2 comes from the use of evolutionary covariations that can be extracted from large-scale multiple sequence alignments.[49][50][51][52][53][54]”
From AlphaFold and Implications for Intrinsically Disordered Proteins (2021) · cites this paper as [2]
Experimental — accuracy not yet measuredThe source backs part of the claim, not all of it — or backs it for a different population, condition or comparison.
In the citing paper
“DeepMind’s AlphaFold2 success in sequence-based protein structure prediction,4 as well as the RoseTTAFold70 open-source counterpart, and the publicly available AlphaFold2 prediction of all human proteins203 are major steps that benefit the scientific community.”
From AlphaFold, Artificial Intelligence (AI), and Allostery (2022) · cites this paper as [203]
Experimental — accuracy not yet measured
16 more claims about this paper
Create a free account to see every claim other papers make about this one.
Citations
Cites
Highly accurate protein structure prediction with AlphaFold
Jumper, J., Evans, R., Pritzel, A., Green, T., Figurnov, M., Ronneberger, O., Tunyasuvunakool, K., Bates, R., Žídek, A., Potapenko, A., et al. (2021) · Nature · doi:10.1038/s41586-021-03819-2 · Cited by 43,764 · cited 1×
“[16, 500), [500, 1,000), [1,000, 1,500), [1,500, 2,000), [2,000, 2,500) and [2,500, 2,700].”
Self-citationGene Ontology: tool for the unification of biology
Ashburner, M., Ball, C. A., Blake, J. A., Botstein, D., Butler, H., Cherry, J. M., Davis, A. P., Dolinski, K., Dwight, S. S., Eppig, J. T., et al. (2000) · Nature Genetics · doi:10.1038/75556 · Cited by 43,206
Trott, O., & Olson, A. J. (2010) · Journal of Computational Chemistry · doi:10.1002/jcc.21334 · Cited by 38,412
AutoDock4 and AutoDockTools4: Automated docking with selective receptor flexibility
Morris, G. M., Huey, R., Lindstrom, W., Sanner, M. F., Belew, R. K., Goodsell, D. S., & Olson, A. J. (2009) · Journal of Computational Chemistry · doi:10.1002/jcc.21256 · Cited by 25,486
Initial sequencing and analysis of the human genome
International Human Genome Sequencing Consortium, Whitehead Institute for Biomedical Research, C. F. G. R., Lander, E. S., Linton, L. M., Birren, B., Nusbaum, C., Zody, M. C., Baldwin, J., Devon, K., Dewar, K., et al. (2001) · Nature · doi:10.1038/35057062 · Cited by 24,216
Self-citationThe sequence of the human genome
Venter, J. C., Adams, M. D., Myers, E. W., Li, P. W., Mural, R. J., Sutton, G. G., Smith, H. O., Yandell, M., Evans, C. A., Holt, R. A., et al. (2001) · Science · doi:10.1126/science.1058040 · Cited by 13,909
SWISS-MODEL: homology modelling of protein structures and complexes
Waterhouse, A., Bertoni, M., Bienert, S., Studer, G., Tauriello, G., Gumienny, R., Heer, F. T., de Beer, T. A. P., Rempfer, C., Bordoli, L., et al. (2018) · Nucleic Acids Research · doi:10.1093/nar/gky427 · Cited by 13,067
Pfam: The protein families database in 2021
Mistry, J., Chuguransky, S., Williams, L., Qureshi, M., Salazar, G. A., Sonnhammer, E. L. L., Tosatto, S. C. E., Paladin, L., Raj, S., Richardson, L. J., et al. (2021) · Nucleic Acids Research · doi:10.1093/nar/gkaa913 · Cited by 7,452
Self-citationUniProt: the universal protein knowledgebase in 2021
The UniProt Consortium, Bateman, A., Martin, M.-J., Orchard, S., Magrane, M., Agivetova, R., Ahmad, S., Alpi, E., Bowler-Barnett, E. H., Britto, R., et al. (2021) · Nucleic Acids Research · doi:10.1093/nar/gkaa1100 · Cited by 6,372
Self-citationThe Gene Ontology Resource: 20 years and still GOing strong
The Gene Ontology Consortium (2019) · Nucleic Acids Research · doi:10.1093/nar/gky1055 · Cited by 4,747
Cited by
Highly accurate protein structure prediction with AlphaFold
Jumper, J., Evans, R., Pritzel, A., Green, T., Figurnov, M., Ronneberger, O., Tunyasuvunakool, K., Bates, R., Žídek, A., Potapenko, A., et al. (2021) · Nature · doi:10.1038/s41586-021-03819-2 · Cited by 43,764
“This opens up the exciting possibility of predicting structures at the proteome-scale and beyond—in a companion paper 39 , we demonstrate the application of AlphaFold to the entire human proteome 39 .”
BackgroundSelf-citationColabFold - Making protein folding accessible to all
Mirdita, M., Schütze, K., Moriwaki, Y., Heo, L., Ovchinnikov, S., & Steinegger, M. (2021) · doi:10.1101/2021.08.15.456425 · Cited by 9,391
“Concurrently, Tunyasuvunakool et al. 9 developed an AlphaFold2 Jupyter Notebook for Google Colaboratory (referred to as AlphaFold-Colab), for which the input MSA is built by searching with HMMer against the UniProt Reference Clusters (UniRef90) and an eightfold-reduced environmental database.”
MethodVaradi, M., Anyango, S., Deshpande, M., Nair, S., Natassia, C., Yordanova, G., Yuan, D., Stroe, O., Wood, G., Laydon, A., et al. (2022) · Nucleic Acids Research · doi:10.1093/nar/gkab1061 · Cited by 7,850
“The methodology of AlphaFold and insights gained from the predictions for the complete human proteome have been described recently (9,13).”
BackgroundMethodInfluentialSelf-citationEvolutionary-scale prediction of atomic level protein structure with a language model
Lin, Z., Akin, H., Rao, R., Hie, B., Zhu, Z., Lu, W., Smetanin, N., Verkuil, R., Kabeli, O., Shmueli, Y., et al. (2022) · doi:10.1101/2022.07.20.500902 · Cited by 5,990
PROTAC targeted protein degraders: the past is prologue
Békés, M., Langley, D. R., & Crews, C. M. (2022) · Nature Reviews Drug Discovery · doi:10.1038/s41573-021-00371-6 · Cited by 3,395
Metadata
- Authors
- Tunyasuvunakool, K., Adler, J., Wu, Z., Green, T., Zielinski, M., Žídek, A., Bridgland, A., Cowie, A., Meyer, C., Laydon, A., Velankar, S., Kleywegt, G. J., Bateman, A., Evans, R., Pritzel, A., Figurnov, M., Ronneberger, O., Bates, R., Kohl, S. A. A., Potapenko, A., Ballard, A. J., Romera-Paredes, B., Nikolov, S., Jain, R., Clancy, E., Reiman, D., Petersen, S., Senior, A. W., Kavukcuoglu, K., Birney, E., Kohli, P., Jumper, J., & Hassabis, D.
- Affiliations
- Google DeepMind (United Kingdom) (GB)
- European Bioinformatics Institute (GB)
- Corresponding author
- Tunyasuvunakool, Kathryn
- Jumper, John
- Hassabis, Demis
- ORCID
- Tunyasuvunakool, Kathryn
- Adler, Jonas
- Wu, Zachary
- Green, Tim
- Žídek, Augustin
- Meyer, Clemens
- Laydon, Agata
- Velankar, Sameer
- Kleywegt, Gerard J.
- Bateman, Alex
- Evans, Richard
- Pritzel, Alexander
- Figurnov, Michael
- Ronneberger, Olaf
- Bates, Russ
- Kohl, Simon A. A.
- Potapenko, Anna
- Ballard, Andrew J.
- Nikolov, Stanislav
- Jain, Rishub
- Clancy, Ellen
- Reiman, David
- Petersen, Stig
- Senior, Andrew W.
- Birney, Ewan
- Kohli, Pushmeet
- Jumper, John
- Hassabis, Demis
- Venue
- Nature
- Published
- 2021-07-22
- Volume
- 596
- Issue
- 7873
- Pages
- 590-596
- ISSN
- 0028-0836 (ISSN-L)
- 1476-4687
- PMC
- PMC8387240
- OpenAlex
- W3183475563
- Semantic Scholar
- 1fb3ad9969245795f268636eff9a145337144718
- Cited by
- 3,025
- References
- 83
- Citations by year
- 2026: 346 · 2025: 517 · 2024: 580 · 2023: 701 · 2022: 692 · 2021: 181
- FWCI
- 169.53
- Type
- journal article
- Language
- en
- Open access
- hybrid
- doi.org
- Licence
- cc-by
- creativecommons.org/licenses/by/4.0 (tdm)
- creativecommons.org/licenses/by/4.0 (vor)
- Locations
- Nature (publishedVersion, cc-by)
- Europe PMC (PubMed Central) (publishedVersion, other-oa)
- PubMed Central (publishedVersion, cc-by)
- PubMed (publishedVersion)
- RePEc: Research Papers in Economics (submittedVersion)
- Funders
- European Bioinformatics Institute
- DeepMind
- Topics
- Life Sciences › Biochemistry, Genetics and Molecular Biology › Molecular Biology › Protein Structure and Dynamics
- Life Sciences › Biochemistry, Genetics and Molecular Biology › Molecular Biology › Machine Learning in Bioinformatics
- Life Sciences › Biochemistry, Genetics and Molecular Biology › Structural Biology › Enzyme Structure and Function
- Keywords
- protein structure prediction, human proteome, AlphaFold2, structural coverage, intrinsically disordered regions, multidomain proteins, protein structure database
- MeSH terms
- Deep Learning, Glucose-6-Phosphatase, Humans, Membrane Proteins, Models, Molecular, Protein Conformation, Reproducibility of Results, Protein Folding, Computational Biology, Proteome, Diacylglycerol O-Acyltransferase, Datasets as Topic
About these checks
Registry, retraction, Cites and statistics results are computed, not judged, with one exception: a printed reference that no index lists is read once by a model before it counts as a citation error. Claims are extracted by a model and kept only when their quote appears verbatim in the text; each cited source is then checked, with a model’s help, for whether it says what the claim relies on. Those verdicts can be wrong — read the claim’s quote and the cited source before relying on one.
The claim verdicts this report counts are experimental: their accuracy is not yet measured.
A language model drew the claims from the paper on 2026-10-10, under version 3 of the claim definition (model deepseek-v4.1-flash, prompt extract-v3).
A second model labelled each claim on 2026-10-10 (model jev-1.13-20260917, definition revision gold-guideline-v0.2).
Cited sources are checked with a language model’s help (gpt-6-sol).
Statistics and arithmetic are recomputed, not judged.
Confidence bands are shown only for fields calibrated on our annotated test set. None is calibrated yet, so no band is shown.
What counts as a claim ›How we measure confidence ›How we check this ›
Are you an author, or do you see a problem with this page? Request a review
How to cite
Cite CoChat for the checks on this page, and the paper for its own findings.
- This page
- CoChat. (2026). Citation check: Highly accurate protein structure prediction for the human proteome. https://app.cochat.ai/papers/10.1038/s41586-021-03828-1
- The paper
- Tunyasuvunakool, K., Adler, J., Wu, Z., Green, T., Zielinski, M., Žídek, A., Bridgland, A., Cowie, A., Meyer, C., Laydon, A., Velankar, S., Kleywegt, G. J., Bateman, A., Evans, R., Pritzel, A., Figurnov, M., Ronneberger, O., Bates, R., Kohl, S. A. A., . . . Hassabis, D. (2021). Highly accurate protein structure prediction for the human proteome. Nature. https://doi.org/10.1038/s41586-021-03828-1
Data sources
Bibliographic data: Semantic Scholar, OpenAlex, Crossref.
Contains information from the Semantic Scholar Academic Graph Datasets, made available under the ODC Attribution License (ODC-BY 1.0).
Semantic Scholar’s data is described in: Kinney, R., et al. (2023). The Semantic Scholar Open Data Platform. arXiv:2301.10140.
