CoChat

Multilevel proteomic analyses reveal molecular diversity between diffuse-type and intestinal-type gastric cancer

Open access

The DOI matches its Crossref record; 69 of the 69 references it cites were found in a registry or an index.

Abstract

Diffuse-type gastric cancer (DGC) and intestinal-type gastric cancer (IGC) are the major histological types of gastric cancer (GC). The molecular mechanism underlying DGC and IGC differences are poorly understood. In this research, we carry out multilevel proteomic analyses, including proteome, phospho-proteome, and transcription factor (TF) activity profiles, of 196 cases covering DGC and IGC in Chinese patients. Integrative proteogenomic analysis reveals ARIDIA mutation associated with opposite prognostic effects between DGC and IGC, via diverse influences on their corresponding proteomes. Systematical comparison and consensus clustering analysis identify three subtypes of DGC and IGC, respectively, based on distinct patterns of the cell cycle, extracellular matrix organization, and immune response-related proteins expression. TF activity-based subtypes demonstrate that the disease progressions of DGC and IGC were regulated by SWI/SNF and NFKB complexes. Furthermore, inferred immune cell infiltration and immune clustering show Th1/Th2 ratio is an indicator for immunotherapeutic effectiveness, which is validated in an independent GC anti-PD1 therapeutic patient group. Our multilevel proteomic analyses enable a more comprehensive understanding of GC and can further advance the precision medicine.

Overview

The claims and statistics of this paper haven’t been checked yet.

Free: it reads the open-access text and checks the first 5 claims that cite a source we can check. Create a free account to check every claim.

A few free checks a day · papers already verified open instantly · results are public

Integrity signals

Registry

Crossref · 10.1038/s41467-023-35797-6

Cites

69 of 69 references verified0 citation errors · 0 not checkable

Statistics

Figures

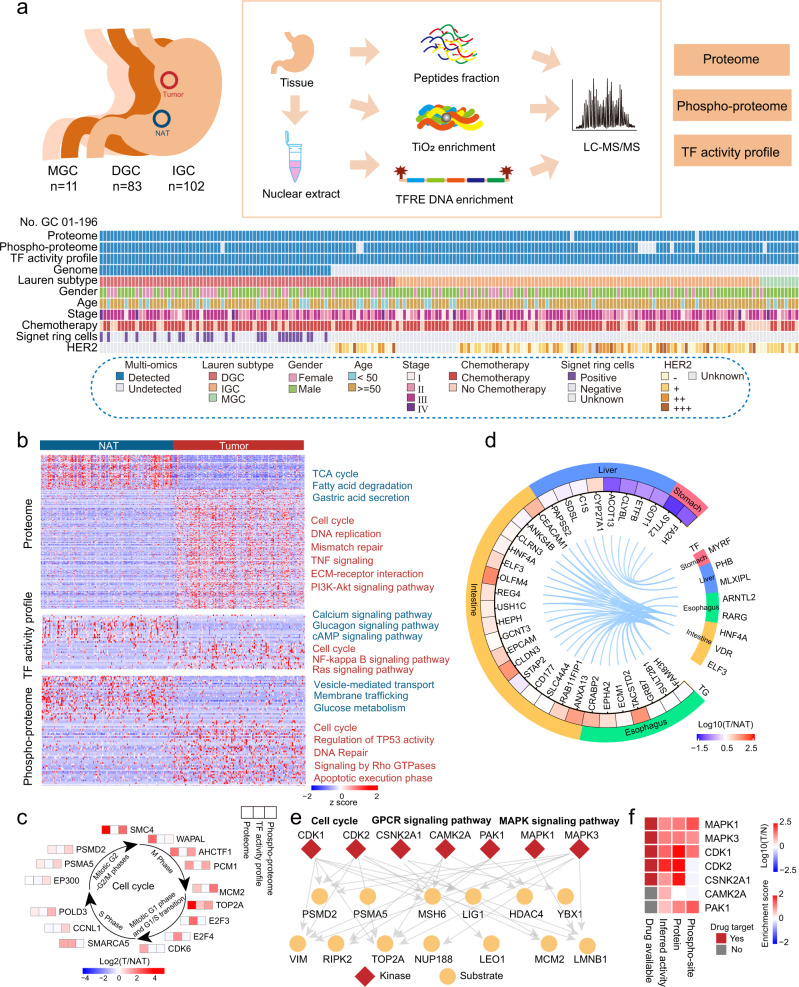
Fig. 1 Multilevel proteomic atlas of human GC samples. a Workflow of human gastric cancer multilevel proteomic atlas construction. b Differentially expressed proteins in tumor tissues and NATs and their associated biological pathways. Red, upregulated pathways in tumor tissues; blue, upregulated pathways in NATs. c Representative differentially expressed proteins in the cell cycle with multilevel proteomic levels (proteome, TF activity profile, and phospho-proteome). d Regulation network of TFs and their target genes. Tissue-specific TFs are shown. e Phospho-regulatory network in GC. Red, kinases; yellow, substrates. The main function or pathways of substrate proteins are labeled. f The expression of GC signature kinases in multilevel proteomic level (protein, phospho-site, and inferred activity).
Fig. 1 Multilevel proteomic atlas of human GC samples. a Workflow of human gastric cancer multilevel proteomic atlas construction. b Differentially expressed proteins in tumor tissues and NATs and their associated biological pathways. Red, upregulated pathways in tumor tissues; blue, upregulated pathways in NATs. c Representative differentially expressed proteins in the cell cycle with multilevel proteomic levels (proteome, TF activity profile, and phospho-proteome). d Regulation network of TFs and their target genes. Tissue-specific TFs are shown. e Phospho-regulatory network in GC. Red, kinases; yellow, substrates. The main function or pathways of substrate proteins are labeled. f The expression of GC signature kinases in multilevel proteomic level (protein, phospho-site, and inferred activity).CC BY · PubMed Central
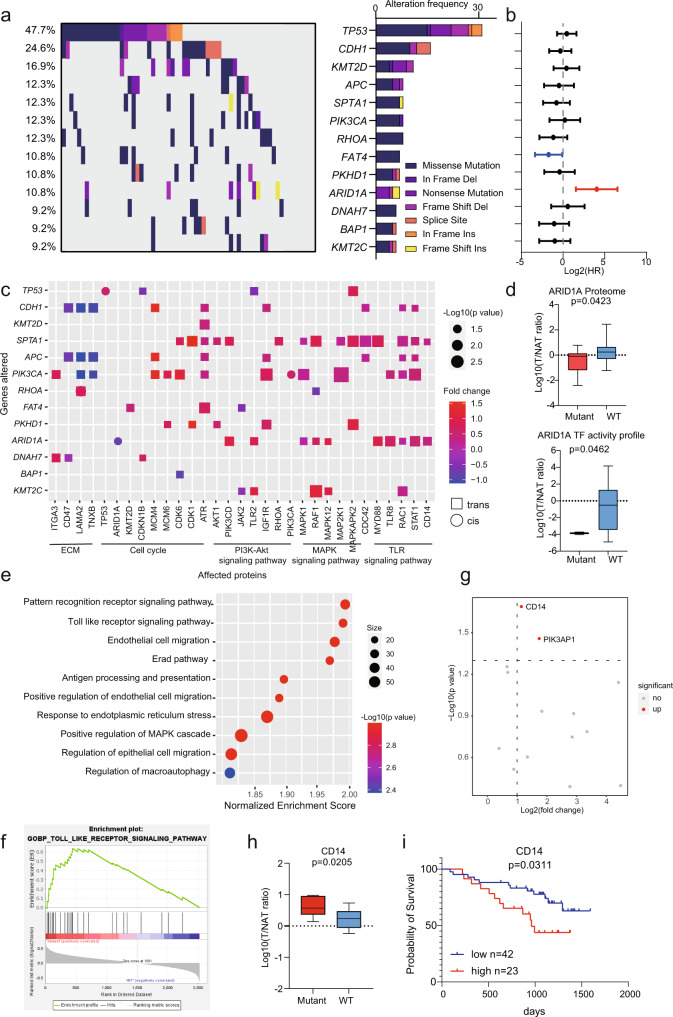
Fig. 2 A summary of proteogenomic analysis of DGC. a Genes with non-silent variants in at least six patients (9%) are depicted on the OncoPrint. Bars on the right of the graph show the numbers of non-synonymous mutations. b Prognosis outcomes of corresponding gene mutations. n (with ARID1A mutant) = 7 and n (without ARID1A mutant) = 58 biologically independent samples. The points and error bars show the median of hazard ratio (HR) and 95% confidence interval (CI). c Cis- and trans-effects of significantly mutated genes (y-axis) on protein level (x-axis). The p-values are calculated by Fisher’s exact test. The related biological functions and pathways are shown at the bottom. d Altered expression of ARID1A associated with ARID1A mutations. In proteome, n (mutant) = 7 and n (WT) = 58 biologically independent samples. In TF activity profile, n (mutant) = 2 and n (WT) = 38 biologically independent samples. Boxplots show median (central line), upper and lower quartiles (box limits), min to max range. The p-values are calculated using two-sided student’s t-test. e Pathways enriched by GSEA in ARID1A mutated patients. Nominal p-value, calculated as phenotype based permutation test. f TLR signaling pathway was significantly enriched in ARID1A mutated patients. g Altered expression of proteins enriched in TLR signaling pathway. The p-values are calculated by two-sided Wilcoxon rank-sum test. h Altered expression of CD14 associated with ARID1A mutation. n (mutant) = 7 and n (WT) = 58 biologically independent samples. Boxplots show median (central line), upper and lower quartiles (box limits), min to max range. The p-value is calculated using two-sided student’s t-test. i The prognostic outcome of CD14 in DGC. n (low) = 42 and n (high) = 23 biologically independent samples. The p-value is calculated using Log-rank test. Source data are provided as a Source Data file.
Fig. 2 A summary of proteogenomic analysis of DGC. a Genes with non-silent variants in at least six patients (9%) are depicted on the OncoPrint. Bars on the right of the graph show the numbers of non-synonymous mutations. b Prognosis outcomes of corresponding gene mutations. n (with ARID1A mutant) = 7 and n (without ARID1A mutant) = 58 biologically independent samples. The points and error bars show the median of hazard ratio (HR) and 95% confidence interval (CI). c Cis- and trans-effects of significantly mutated genes (y-axis) on protein level (x-axis). The p-values are calculated by Fisher’s exact test. The related biological functions and pathways are shown at the bottom. d Altered expression of ARID1A associated with ARID1A mutations. In proteome, n (mutant) = 7 and n (WT) = 58 biologically independent samples. In TF activity profile, n (mutant) = 2 and n (WT) = 38 biologically independent samples. Boxplots show median (central line), upper and lower quartiles (box limits), min to max range. The p-values are calculated using two-sided student’s t-test. e Pathways enriched by GSEA in ARID1A mutated patients. Nominal p-value, calculated as phenotype based permutation test. f TLR signaling pathway was significantly enriched in ARID1A mutated patients. g Altered expression of proteins enriched in TLR signaling pathway. The p-values are calculated by two-sided Wilcoxon rank-sum test. h Altered expression of CD14 associated with ARID1A mutation. n (mutant) = 7 and n (WT) = 58 biologically independent samples. Boxplots show median (central line), upper and lower quartiles (box limits), min to max range. The p-value is calculated using two-sided student’s t-test. i The prognostic outcome of CD14 in DGC. n (low) = 42 and n (high) = 23 biologically independent samples. The p-value is calculated using Log-rank test. Source data are provided as a Source Data file.CC BY · PubMed Central
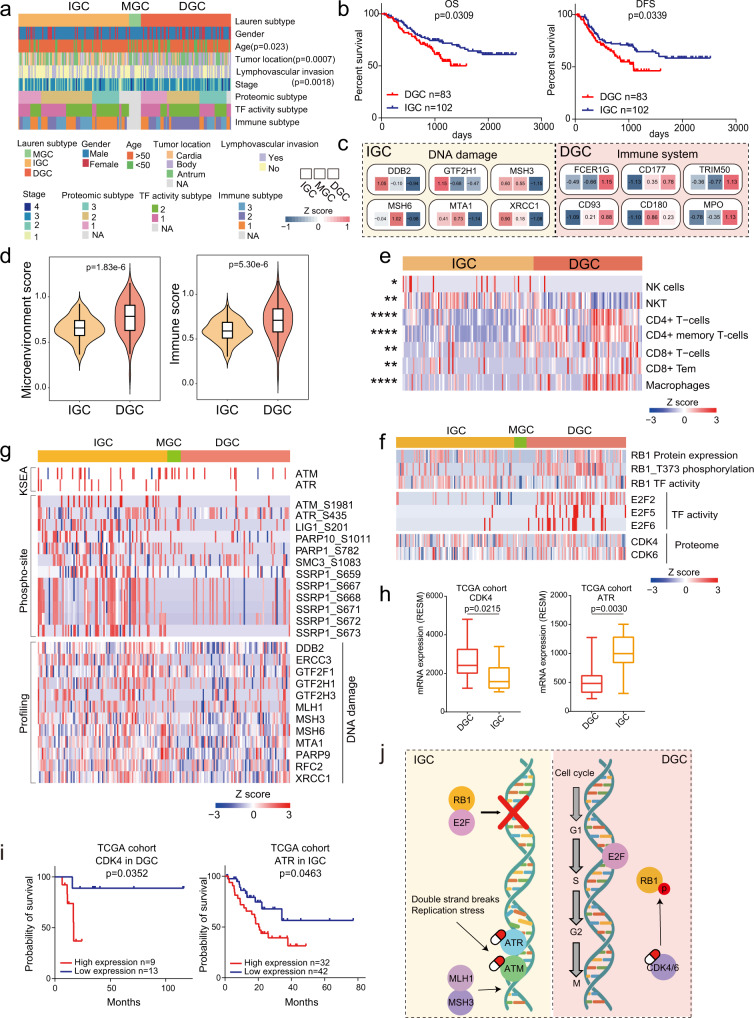
Fig. 3 Integrated multilevel proteomic analyses showed different pathogenic mechanism of DGC and IGC. a The association of Lauren classification with clinical information. Two-sided Fisher’s exact test is used for categorical variables. b The association of Lauren classification with clinical outcomes. n (DGC) = 83 and n (IGC) = 102 biologically independent samples. P-values are from Log-rank test. c Representative differentially expressed proteins in the featured pathways of DGC and IGC. d Microenvironment scores and immune scores of DGC and IGC. n (DGC) = 83 and n (IGC) = 100 biologically independent samples. Violin plots show median and interquartile range. The p-values are from two-sided Wilcoxon rank-sum test. e Comparison of immune cell infiltration between DGC and IGC. Two-sided Wilcoxon rank-sum test is used. The Benjamini–Hochberg (BH) adjusted p-values are 0.019 (NK cells), 0.0016 (NKT), 1.71E-9 (CD4 + T-cells), 1.89E-12 (CD4 + memory T-cells), 0.0017 (CD8 + T-cells), 0.00056 (CD8 + Tem), and 4.25E-7 (Macrophages). f Integrated analysis of cell cycle regulation pathway at protein, kinase, TF activity and phospho-site levels in DGC and IGC. g Integrated analysis of DNA mismatch repair pathway at protein, kinase and phospho-site levels in DGC and IGC. h The expression of CDK4 and ATR in DGC and IGC. n (DGC) = 10 and n (IGC) = 16 biologically independent samples. Boxplots show median (central line), upper and lower quartiles (box limits), min to max range. The p-values are calculated by two-sided Wilcoxon rank-sum test. i The prognostic analyses of CDK4 and ATR in TCGA cohort. In comparison of CDK4, n (high expression) = 9 and n (low expression) = 13 biologically independent samples. In comparison of ATR, n (high expression) = 32 and n (low expression) = 42 biologically independent samples. The p-value is calculated using Log-rank test. j Summary of signature proteins and pathways involved in DGC and IGC. ****p < 1.0e-4, ***p < 1.0e-3, **p < 0.01, *p < 0.05. Source data are provided as a Source Data file.
Fig. 3 Integrated multilevel proteomic analyses showed different pathogenic mechanism of DGC and IGC. a The association of Lauren classification with clinical information. Two-sided Fisher’s exact test is used for categorical variables. b The association of Lauren classification with clinical outcomes. n (DGC) = 83 and n (IGC) = 102 biologically independent samples. P-values are from Log-rank test. c Representative differentially expressed proteins in the featured pathways of DGC and IGC. d Microenvironment scores and immune scores of DGC and IGC. n (DGC) = 83 and n (IGC) = 100 biologically independent samples. Violin plots show median and interquartile range. The p-values are from two-sided Wilcoxon rank-sum test. e Comparison of immune cell infiltration between DGC and IGC. Two-sided Wilcoxon rank-sum test is used. The Benjamini–Hochberg (BH) adjusted p-values are 0.019 (NK cells), 0.0016 (NKT), 1.71E-9 (CD4 + T-cells), 1.89E-12 (CD4 + memory T-cells), 0.0017 (CD8 + T-cells), 0.00056 (CD8 + Tem), and 4.25E-7 (Macrophages). f Integrated analysis of cell cycle regulation pathway at protein, kinase, TF activity and phospho-site levels in DGC and IGC. g Integrated analysis of DNA mismatch repair pathway at protein, kinase and phospho-site levels in DGC and IGC. h The expression of CDK4 and ATR in DGC and IGC. n (DGC) = 10 and n (IGC) = 16 biologically independent samples. Boxplots show median (central line), upper and lower quartiles (box limits), min to max range. The p-values are calculated by two-sided Wilcoxon rank-sum test. i The prognostic analyses of CDK4 and ATR in TCGA cohort. In comparison of CDK4, n (high expression) = 9 and n (low expression) = 13 biologically independent samples. In comparison of ATR, n (high expression) = 32 and n (low expression) = 42 biologically independent samples. The p-value is calculated using Log-rank test. j Summary of signature proteins and pathways involved in DGC and IGC. ****p < 1.0e-4, ***p < 1.0e-3, **p < 0.01, *p < 0.05. Source data are provided as a Source Data file.CC BY · PubMed Central
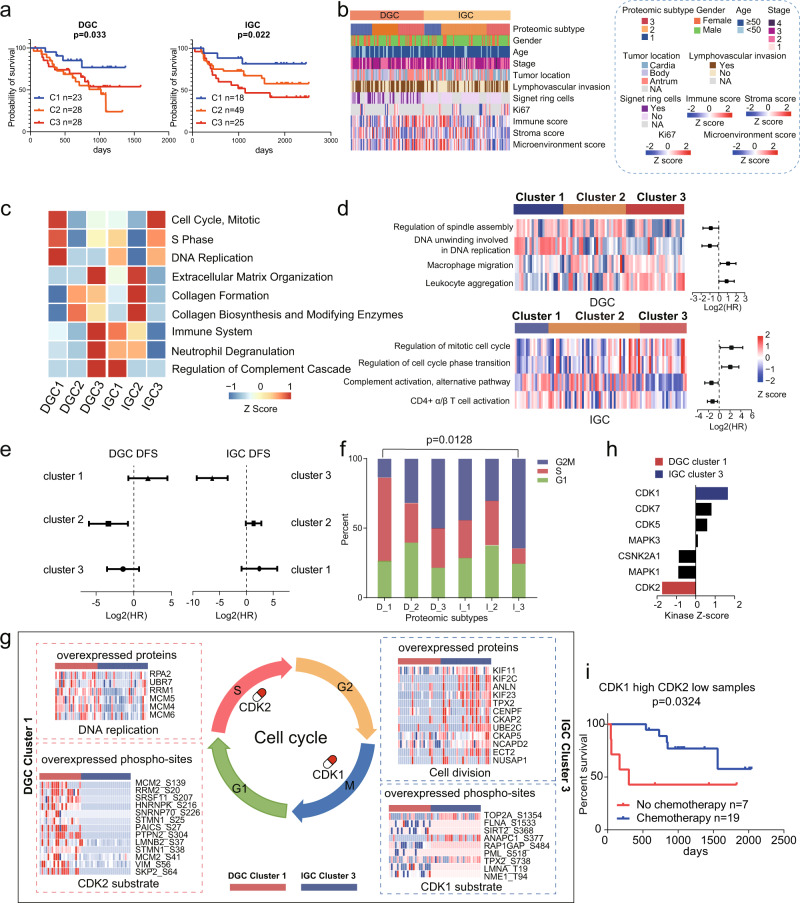
Fig. 4 Proteomic subtyping of GC and associations with clinical outcomes. a The association of proteomic subtypes with clinical outcomes in DGC and IGC. n (DGC cluster 1) = 23, n (DGC cluster 2) = 28, n (DGC cluster 3) = 28, n (IGC cluster 1) = 18, n (IGC cluster 2) = 49, and n (IGC cluster 3) = 25 biologically independent samples. P-values are from Log-rank test. b Clinical characteristics annotation in GC proteomic subtypes. c Pathways that significantly enriched in the proteomic subtypes. d GSEA revealed the cell cycle and immune related pathways are enriched in the proteomic subtypes and have opposite prognoses between DGC and IGC. n (DGC) = 79 and n (IGC) = 92 biologically independent samples. The points and error bars show the median of hazard ratio (HR) and 95% confidence interval (CI). e The association of chemotherapy with DFS in each GC proteomic subtypes. Chemotherapy: n (DGC cluster 1) = 19, n (DGC cluster 2) = 22, n (DGC cluster 3) = 22, n (IGC cluster 1) = 12, n (IGC cluster 2) = 36, and n (IGC cluster 3) = 20 biologically independent samples. No chemotherapy: n (DGC cluster 1) = 4, n (DGC cluster 2) = 6, n (DGC cluster 3) = 7, n (IGC cluster 1) = 6, n (IGC cluster 2) = 13, and n (IGC cluster 3) = 5 biologically independent samples. The points and error bars show the median of hazard ratio (HR) and 95% confidence interval (CI). f Percentage of patients with different cell cycle phases. The p-value is calculated by Fisher’s exact test. g Summary of cell cycle regulation in DGC cluster 1 and IGC cluster 3. Proteins involved in DNA replication and cell division in DGC cluster 1 and IGC cluster 3, phospho-sites of CDK1 and CDK2 substrates in DGC cluster 1 and IGC cluster 3 are shown, respectively. h KSEA analysis of CDKs kinase activities in DGC cluster 1 and IGC cluster 2. Kinases with p-value < 0.05 (permutation test) are colored in red (CDK2, p-value = 0.041) or blue (CDK1, p-value = 0.049). i The association of chemotherapy with DFS in GC patients with high CDK1 and low CDK2 level. n (chemotherapy) = 19 and n (no chemotherapy) = 7 biologically independent samples. The p-value is from Log-rank test. Source data are provided as a Source Data file.
Fig. 4 Proteomic subtyping of GC and associations with clinical outcomes. a The association of proteomic subtypes with clinical outcomes in DGC and IGC. n (DGC cluster 1) = 23, n (DGC cluster 2) = 28, n (DGC cluster 3) = 28, n (IGC cluster 1) = 18, n (IGC cluster 2) = 49, and n (IGC cluster 3) = 25 biologically independent samples. P-values are from Log-rank test. b Clinical characteristics annotation in GC proteomic subtypes. c Pathways that significantly enriched in the proteomic subtypes. d GSEA revealed the cell cycle and immune related pathways are enriched in the proteomic subtypes and have opposite prognoses between DGC and IGC. n (DGC) = 79 and n (IGC) = 92 biologically independent samples. The points and error bars show the median of hazard ratio (HR) and 95% confidence interval (CI). e The association of chemotherapy with DFS in each GC proteomic subtypes. Chemotherapy: n (DGC cluster 1) = 19, n (DGC cluster 2) = 22, n (DGC cluster 3) = 22, n (IGC cluster 1) = 12, n (IGC cluster 2) = 36, and n (IGC cluster 3) = 20 biologically independent samples. No chemotherapy: n (DGC cluster 1) = 4, n (DGC cluster 2) = 6, n (DGC cluster 3) = 7, n (IGC cluster 1) = 6, n (IGC cluster 2) = 13, and n (IGC cluster 3) = 5 biologically independent samples. The points and error bars show the median of hazard ratio (HR) and 95% confidence interval (CI). f Percentage of patients with different cell cycle phases. The p-value is calculated by Fisher’s exact test. g Summary of cell cycle regulation in DGC cluster 1 and IGC cluster 3. Proteins involved in DNA replication and cell division in DGC cluster 1 and IGC cluster 3, phospho-sites of CDK1 and CDK2 substrates in DGC cluster 1 and IGC cluster 3 are shown, respectively. h KSEA analysis of CDKs kinase activities in DGC cluster 1 and IGC cluster 2. Kinases with p-value < 0.05 (permutation test) are colored in red (CDK2, p-value = 0.041) or blue (CDK1, p-value = 0.049). i The association of chemotherapy with DFS in GC patients with high CDK1 and low CDK2 level. n (chemotherapy) = 19 and n (no chemotherapy) = 7 biologically independent samples. The p-value is from Log-rank test. Source data are provided as a Source Data file.CC BY · PubMed Central
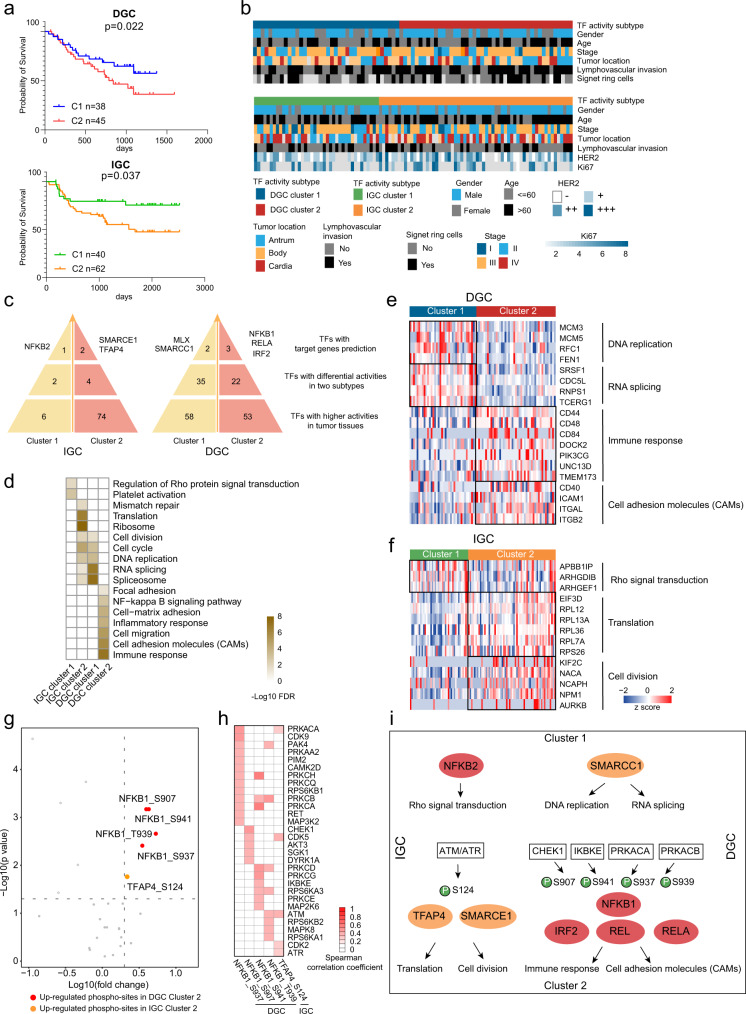
Fig. 5 DGC and IGC subtypes based on TF activity profiles. a The association of TF activity-based subtypes with clinical outcomes in DGC and IGC. n (DGC cluster 1) = 38, n (DGC cluster 2) = 45, n (IGC cluster 1) = 40, and n (IGC cluster 2) = 62 biologically independent samples. P-values are from Log-rank test. b Clinical characteristics annotation in GC TF activity-based subtypes. c Master TFs selection in each TF activity-based subtype. d Pathway enrichment analysis of master TFs regulated TGs in each TF activity-based subtype. e A list of TGs regulated by master TFs in significantly altered pathways and their abundance in each DGC TF activity-based subtype. f A list of TGs regulated by master TFs in significantly altered pathways and their abundance in each IGC TF activity-based subtype. g Expression of phospho-sites in each TF activity-based subtype. The p-values are from Wilcoxon rank-sum test. Red and orange colors, upregulated phospho-sites in DGC cluster 2 and IGC cluster 2, respectively. h Spearman’s correlation coefficients between kinases and phospho-sites upregulated in DGC cluster 2 and IGC cluster 2. i Phospho-regulatory network in GC. Source data are provided as a Source Data file.
Fig. 5 DGC and IGC subtypes based on TF activity profiles. a The association of TF activity-based subtypes with clinical outcomes in DGC and IGC. n (DGC cluster 1) = 38, n (DGC cluster 2) = 45, n (IGC cluster 1) = 40, and n (IGC cluster 2) = 62 biologically independent samples. P-values are from Log-rank test. b Clinical characteristics annotation in GC TF activity-based subtypes. c Master TFs selection in each TF activity-based subtype. d Pathway enrichment analysis of master TFs regulated TGs in each TF activity-based subtype. e A list of TGs regulated by master TFs in significantly altered pathways and their abundance in each DGC TF activity-based subtype. f A list of TGs regulated by master TFs in significantly altered pathways and their abundance in each IGC TF activity-based subtype. g Expression of phospho-sites in each TF activity-based subtype. The p-values are from Wilcoxon rank-sum test. Red and orange colors, upregulated phospho-sites in DGC cluster 2 and IGC cluster 2, respectively. h Spearman’s correlation coefficients between kinases and phospho-sites upregulated in DGC cluster 2 and IGC cluster 2. i Phospho-regulatory network in GC. Source data are provided as a Source Data file.CC BY · PubMed Central
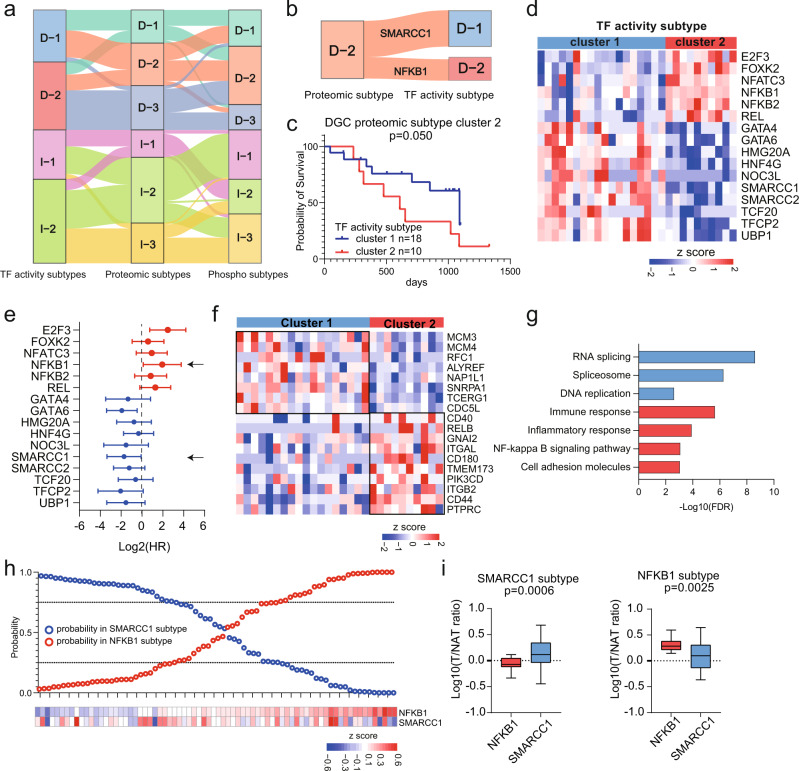
Fig. 6 Characteristics of Multilevel Proteomic Subtyping and its Robustness. a Sankey diagram depicting the association of samples classified into TF activity, proteome and phospho-proteome-based subtypes. b Sankey diagram depicting the association of samples classified into DGC proteomic cluster 2 and DGC TF subtypes. c Prognostic outcomes of GC patients in DGC proteomic subtype cluster 2. n (cluster 1) = 18 and n (cluster 2) = 10 biologically independent samples. The p-value is from Log-rank test. d TF activities comparison between two TF activity subtypes. e Prognostic outcomes of TFs with significantly differential activities in two TF activity subtypes. n = 28 biologically independent samples. The points and error bars show the median of hazard ratio (HR) and 95% confidence interval (CI). f Proteins expression of target genes of two TFs. g Pathways enriched in two subgroups of DGC proteomic subtype cluster 2. h Performance of the TF subtype predictor based on NFKB1 and SMARCC1. i The expression of NFKB1 and SMARCC1 in two subgroups. n (SMARCC1 subtype) = 28 and n (NFKB1 subtype) = 24 biologically independent samples. Boxplots show median (central line), upper and lower quartiles (box limits), min to max range. The p-value is calculated using two-sided student’s t-test. Source data are provided as a Source Data file.
Fig. 6 Characteristics of Multilevel Proteomic Subtyping and its Robustness. a Sankey diagram depicting the association of samples classified into TF activity, proteome and phospho-proteome-based subtypes. b Sankey diagram depicting the association of samples classified into DGC proteomic cluster 2 and DGC TF subtypes. c Prognostic outcomes of GC patients in DGC proteomic subtype cluster 2. n (cluster 1) = 18 and n (cluster 2) = 10 biologically independent samples. The p-value is from Log-rank test. d TF activities comparison between two TF activity subtypes. e Prognostic outcomes of TFs with significantly differential activities in two TF activity subtypes. n = 28 biologically independent samples. The points and error bars show the median of hazard ratio (HR) and 95% confidence interval (CI). f Proteins expression of target genes of two TFs. g Pathways enriched in two subgroups of DGC proteomic subtype cluster 2. h Performance of the TF subtype predictor based on NFKB1 and SMARCC1. i The expression of NFKB1 and SMARCC1 in two subgroups. n (SMARCC1 subtype) = 28 and n (NFKB1 subtype) = 24 biologically independent samples. Boxplots show median (central line), upper and lower quartiles (box limits), min to max range. The p-value is calculated using two-sided student’s t-test. Source data are provided as a Source Data file.CC BY · PubMed Central
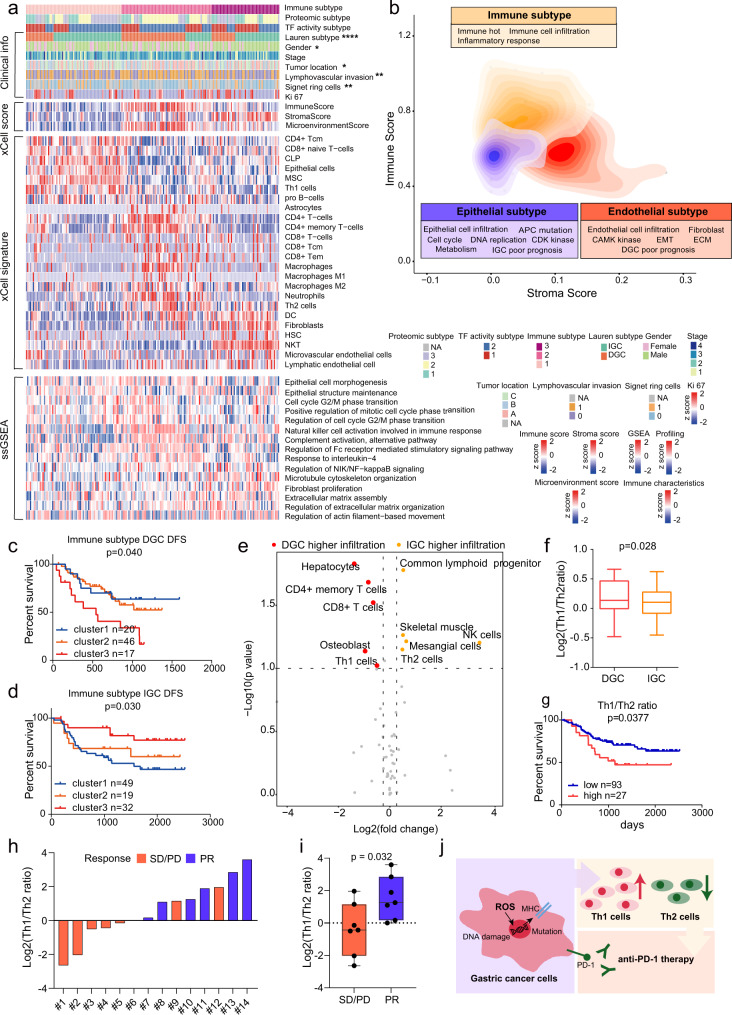
Fig. 7 Characterization of immune infiltration in GC. a Heatmap illustrating the immune/stroma signatures from xCell, and ssGSEA pathway scores in each immune subtype. P-values are from two-sided chi-square test. The p-values are 1.64E-6 (Lauren subtype), 0.017(Gender), 0.027(Tumor location), 0.01(Lymphovascular invasion), and 0.0059(Signet ring cells). b Contour plot of two-dimensional density based on immune score (y-axis) and stroma score (x-axis) among different immune clusters. c, d Kaplan–Meier curves of DFS for DGC and IGC based on immune subtypes. n (DGC cluster 1) = 20, n (DGC cluster 2) = 46, n (DGC cluster 3) = 17, n (IGC cluster 1) = 49, n (IGC cluster 2) = 19, and n (IGC cluster 3) = 32 biologically independent samples. P-values are from Log-rank test. e Immune cell infiltration between DGC and IGC. The p-values are from two-sided Wilcoxon rank-sum test. f Th1/Th2 ratio in DGC and IGC. n (DGC) = 17 and n (IGC) = 32 biologically independent samples. Boxplots show median (central line), upper and lower quartiles (box limits), min to max range. P-values are calculated using two-sided student’s t-test. g The association of Th1/Th2 ratio with prognostic outcomes in all GC patients. n (low) = 93 and n (high) = 27 biologically independent samples. P-values are from Log-rank test. h Distribution of Th1/Th2 ratio in the GC anti-PD-1 patient group. i Comparison of Th1/Th2 ratio between responder and non-responder groups. n (PR) = 7 and n (SD/PD) = 7 biologically independent samples. Boxplots show median (central line), upper and lower quartiles (box limits), min to max range. P-values are calculated using two-sided student’s t-test. Each point represents a sample. j Summary of T helper cells recruitment mechanism in GC. ****p < 1.0e-4, ***p < 1.0e-3, **p < 0.01, *p < 0.05. Source data are provided as a Source Data file.
Fig. 7 Characterization of immune infiltration in GC. a Heatmap illustrating the immune/stroma signatures from xCell, and ssGSEA pathway scores in each immune subtype. P-values are from two-sided chi-square test. The p-values are 1.64E-6 (Lauren subtype), 0.017(Gender), 0.027(Tumor location), 0.01(Lymphovascular invasion), and 0.0059(Signet ring cells). b Contour plot of two-dimensional density based on immune score (y-axis) and stroma score (x-axis) among different immune clusters. c, d Kaplan–Meier curves of DFS for DGC and IGC based on immune subtypes. n (DGC cluster 1) = 20, n (DGC cluster 2) = 46, n (DGC cluster 3) = 17, n (IGC cluster 1) = 49, n (IGC cluster 2) = 19, and n (IGC cluster 3) = 32 biologically independent samples. P-values are from Log-rank test. e Immune cell infiltration between DGC and IGC. The p-values are from two-sided Wilcoxon rank-sum test. f Th1/Th2 ratio in DGC and IGC. n (DGC) = 17 and n (IGC) = 32 biologically independent samples. Boxplots show median (central line), upper and lower quartiles (box limits), min to max range. P-values are calculated using two-sided student’s t-test. g The association of Th1/Th2 ratio with prognostic outcomes in all GC patients. n (low) = 93 and n (high) = 27 biologically independent samples. P-values are from Log-rank test. h Distribution of Th1/Th2 ratio in the GC anti-PD-1 patient group. i Comparison of Th1/Th2 ratio between responder and non-responder groups. n (PR) = 7 and n (SD/PD) = 7 biologically independent samples. Boxplots show median (central line), upper and lower quartiles (box limits), min to max range. P-values are calculated using two-sided student’s t-test. Each point represents a sample. j Summary of T helper cells recruitment mechanism in GC. ****p < 1.0e-4, ***p < 1.0e-3, **p < 0.01, *p < 0.05. Source data are provided as a Source Data file.CC BY · PubMed Central

Verification

Claims the paper makes

The claims and statistics of this paper haven’t been checked yet.

Free: it reads the open-access text and checks the first 5 claims that cite a source we can check. Create a free account to check every claim.

A few free checks a day · papers already verified open instantly · results are public

Claims other papers make about this one

Each is checked against this paper’s own text: does it say what the citing paper says it does?

Self-check

Percentages, sums and reported differences re-computed from the paper’s own numbers.

The self-check needs the paper’s full text.

Citations

Cites

Show all 69 references

Cited by

See all 50

Metadata

Authors
Shi, W., Wang, Y., Xu, C., Li, Y., Ge, S., Bai, B., Zhang, K., Wang, Y., Zheng, N., Wang, J., Wang, S., Ji, G., Li, J., Nie, Y., Liang, W., Wu, X., Cui, J., Wang, Y., Chen, L., Zhao, Q., Shen, L., He, F., Qin, J., & Ding, C.
Affiliations
  • Beijing Proteome Research Center (CN)
  • Fudan University (CN)
  • Peking University Cancer Hospital (CN)
  • National Clinical Research Center for Digestive Diseases (CN)
  • Chinese PLA General Hospital (CN)
  • Chinese Academy of Medical Sciences & Peking Union Medical College (CN)
  • Shanghai Medical College of Fudan University (CN)
Corresponding author
  • Chen, Lin
  • Zhao, Qingchuan
  • Shen, Lin
  • He, Fuchu
  • Qin, Jun
  • Ding, Chen
Venue
Nature Communications
Published
2023-02-14
Volume
14
Issue
1
Pages
835-835
ISSN
2041-1723 (ISSN-L)
OpenAlex
W4320856871
Cited by
50
References
69
Citations by year
2026: 13 · 2025: 14 · 2024: 20 · 2023: 3
FWCI
9.17
Type
journal article
Language
en
Open access
Licence
Locations
  • Nature Communications (publishedVersion, cc-by)
  • PubMed Central (publishedVersion, cc-by)
  • PubMed (publishedVersion)
  • RePEc: Research Papers in Economics (submittedVersion)
  • DOAJ (DOAJ: Directory of Open Access Journals) (submittedVersion, cc-by-sa)
Funders
  • National Natural Science Foundation of China (31972933, 2018YFA0507501, 2016YFA0502500, 2017YFA0505100, 22XD1420100, 2017SHZDZX01, 31700682, 31770886, 81902514)
  • Shanghai Education Development Foundation (19SG02)
  • Shanghai Municipal Education Commission (19SG02)
  • Chinese Academy of Medical Sciences (2017SHZDZX01, CIFMS, 2019, 2019-12M-5-063)
  • Program of Shanghai Academic Research Leader (22XD1420100)
Topics
  • Health Sciences › Medicine › Oncology › Gastric Cancer Management and Outcomes
  • Physical Sciences › Chemistry › Spectroscopy › Advanced Proteomics Techniques and Applications
  • Health Sciences › Medicine › Gastroenterology › Helicobacter pylori-related gastroenterology studies
Keywords
diffuse-type gastric cancer, intestinal-type gastric cancer, histological subtypes, proteogenomics, ARID1A mutation, phosphoproteome, transcription factor activity, SWI/SNF complex, NF-κB, tumor subtypes, extracellular matrix, immune cell infiltration, Th1/Th2 balance, anti-PD-1 therapy, prognosis
MeSH terms
Humans, Mutation, Stomach Neoplasms, Proteome, Proteomics

About these checks

Registry, retraction, Cites and statistics results are computed, not judged, with one exception: a printed reference that no index lists is read once by a model before it counts as a citation error. Claims are extracted by a model and kept only when their quote appears verbatim in the text; each cited source is then checked, with a model’s help, for whether it says what the claim relies on. Those verdicts can be wrong — read the claim’s quote and the cited source before relying on one.

Statistics and arithmetic are recomputed, not judged.

Confidence bands are shown only for fields calibrated on our annotated test set. None is calibrated yet, so no band is shown.

What counts as a claim ›How we measure confidence ›How we check this ›

Are you an author, or do you see a problem with this page? Request a review

How to cite

Cite CoChat for the checks on this page, and the paper for its own findings.

This page
CoChat. (2026). Citation check: Multilevel proteomic analyses reveal molecular diversity between diffuse-type and intestinal-type gastric cancer. https://app.cochat.ai/papers/10.1038/s41467-023-35797-6
The paper
Shi, W., Wang, Y., Xu, C., Li, Y., Ge, S., Bai, B., Zhang, K., Wang, Y., Zheng, N., Wang, J., Wang, S., Ji, G., Li, J., Nie, Y., Liang, W., Wu, X., Cui, J., Wang, Y., Chen, L., . . . Ding, C. (2023). Multilevel proteomic analyses reveal molecular diversity between diffuse-type and intestinal-type gastric cancer. Nature Communications. https://doi.org/10.1038/s41467-023-35797-6

Data sources

Bibliographic data: Semantic Scholar, OpenAlex, Crossref.

Contains information from the Semantic Scholar Academic Graph Datasets, made available under the ODC Attribution License (ODC-BY 1.0).

Semantic Scholar’s data is described in: Kinney, R., et al. (2023). The Semantic Scholar Open Data Platform. arXiv:2301.10140.