

The DOI matches its Crossref record; 3 of the 3 references it cites were found in a registry or an index.
Tandem mass tag-based quantitative proteomic profiling identifies candidate serum biomarkers of drug-induced liver injury in humans
Abstract
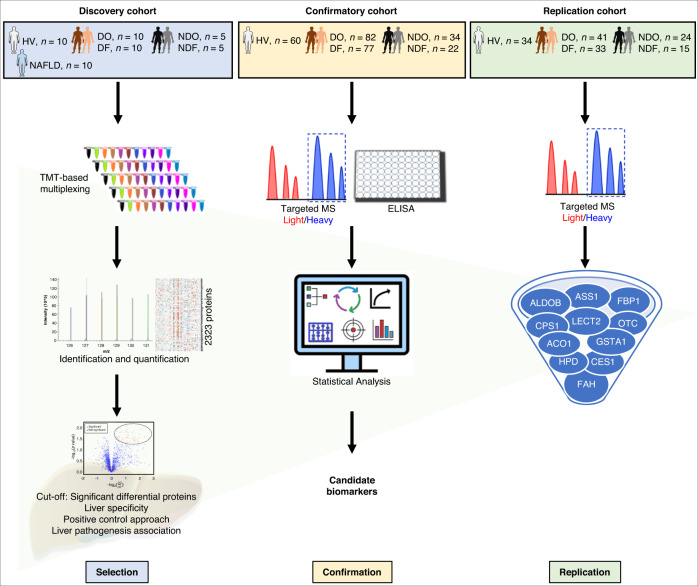
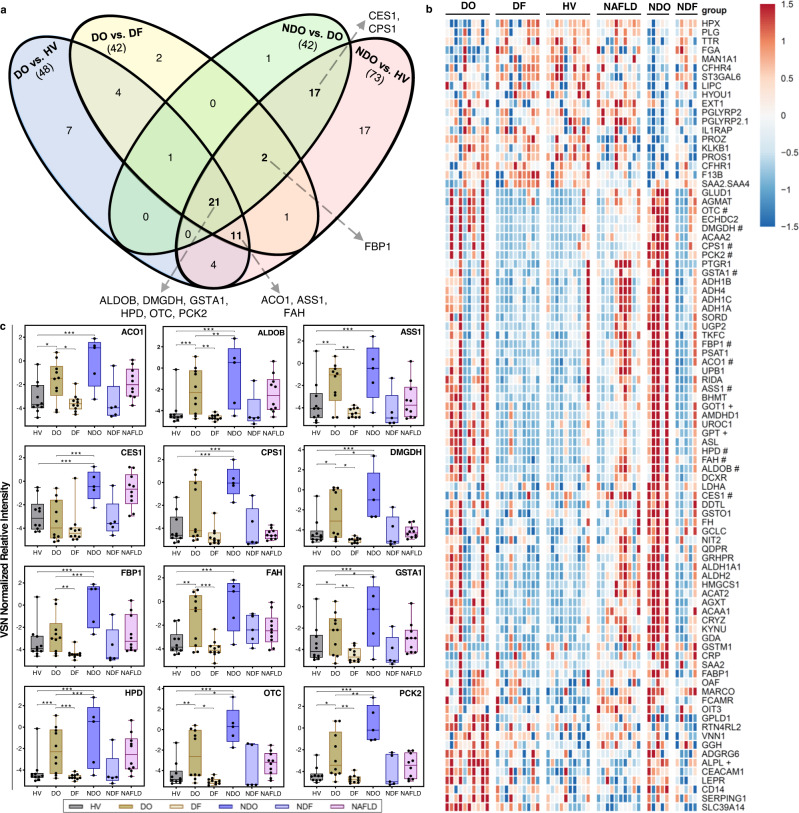
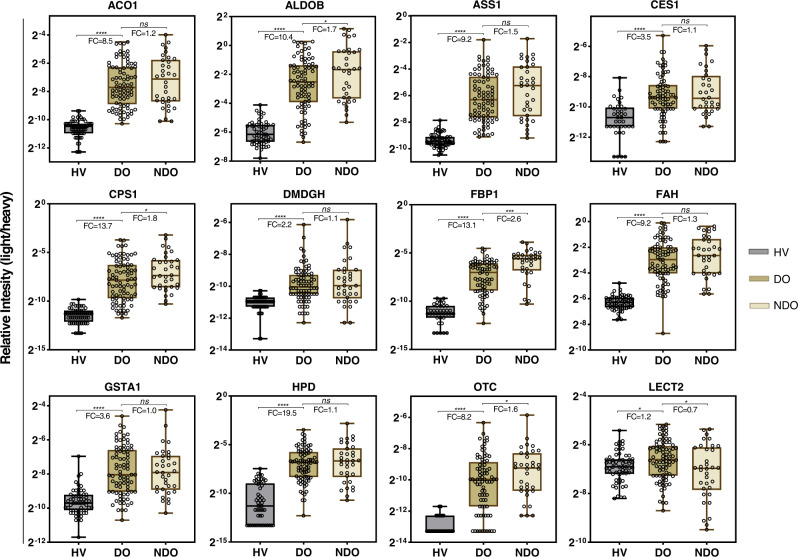
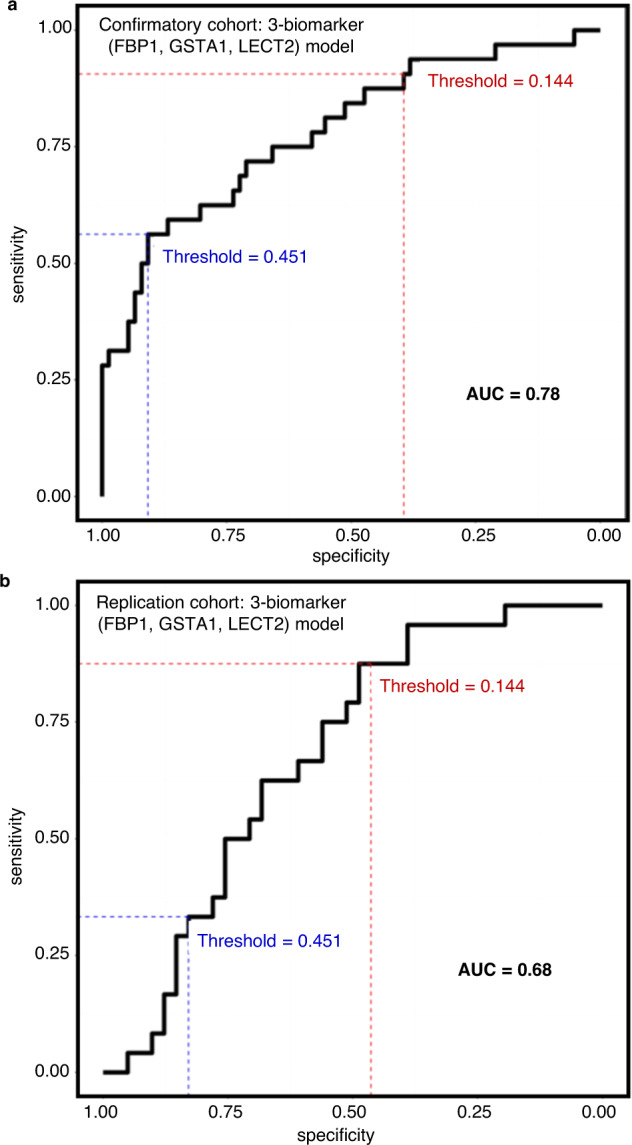
Diagnosis of drug-induced liver injury (DILI) and its distinction from other liver diseases are significant challenges in drug development and clinical practice. Here, we identify, confirm, and replicate the biomarker performance characteristics of candidate proteins in patients with DILI at onset (DO; n = 133) and follow-up ( n = 120), acute non-DILI at onset (NDO; n = 63) and follow-up ( n = 42), and healthy volunteers (HV; n = 104). Area under the receiver operating characteristic curve (AUC) for cytoplasmic aconitate hydratase, argininosuccinate synthase, carbamoylphosphate synthase, fumarylacetoacetase, fructose-1,6-bisphosphatase 1 (FBP1) across cohorts achieved near complete separation (range: 0.94–0.99) of DO and HV. In addition, we show that FBP1, alone or in combination with glutathione S-transferase A1 and leukocyte cell-derived chemotaxin 2, could potentially assist in clinical diagnosis by distinguishing NDO from DO (AUC range: 0.65–0.78), but further technical and clinical validation of these candidate biomarkers is needed.
Overview
The claims and statistics of this paper haven’t been checked yet.
Run the check — free, no account needed. It reads the open-access text and checks the sources it cites.
Integrity signals
Registry
Cites
Statistics
Figures
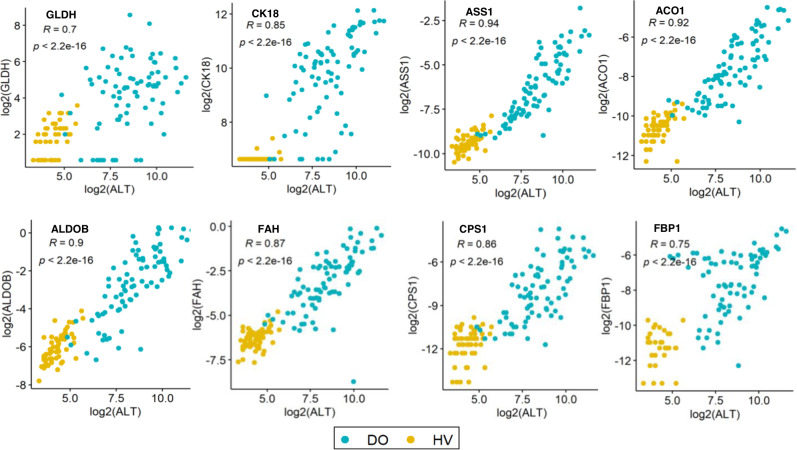
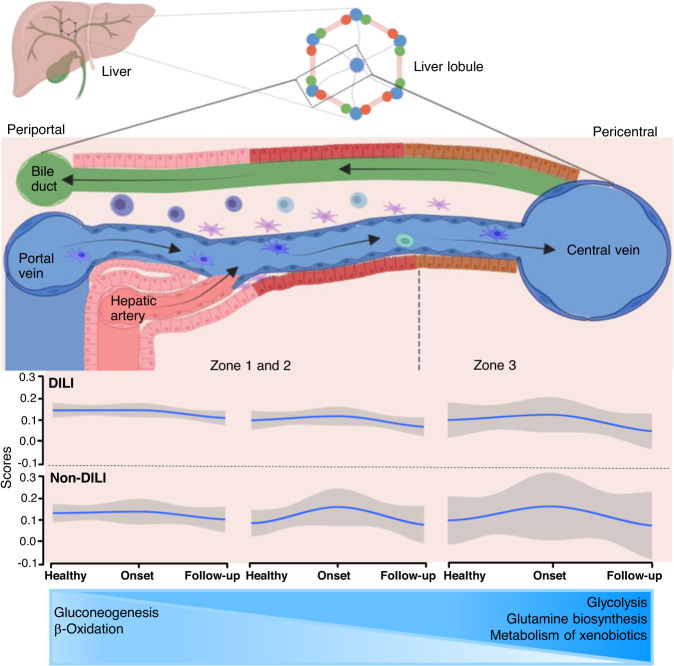
Verification
Claims the paper makes
The claims and statistics of this paper haven’t been checked yet.
Run the check — free, no account needed. It reads the open-access text and checks the sources it cites.
Claims other papers make about this one
Each is checked against this paper’s own text: does it say what the citing paper says it does?
The cited source says what the claim attributes to it.
In the citing paper
“Recently, a tandem mass tag‐based quantitative proteomic profiling identified FBP1, glutathione S‐transferase A1, and leukocyte cell‐derived chemotaxin 2 as potential serum biomarkers to discriminate acute DILI from acute non‐DILI (AUC range: .65–.78).”
From Methods for causality assessment of idiosyncratic drug‐induced liver injury (2025) · cites this paper as [14]
In the citing paper
“Although research into the discovery and qualification of DILI‐specific biomarkers has yielded interesting results, these have not yet been fully translated into the clinic”
From Methods for causality assessment of idiosyncratic drug‐induced liver injury (2025) · cites this paper as [14]
In the citing paper
“However, further technical and clinical validation of these promising biomarkers is required.”
From Methods for causality assessment of idiosyncratic drug‐induced liver injury (2025) · cites this paper as [14]
Self-check
Percentages, sums and reported differences re-computed from the paper’s own numbers.
The self-check needs the paper’s full text.
Citations
Cites
Evaluation of Abnormal Liver-Enzyme Results in Asymptomatic Patients
Pratt, D. S., & Kaplan, M. M. (2000) · New England Journal of Medicine · doi:10.1056/nejm200004273421707 · Cited by 1,203
A revised electronic version of RUCAM for the diagnosis of DILI
Hayashi, P. H., Lucena, M. I., Fontana, R. J., Bjornsson, E. S., Aithal, G. P., Barnhart, H., Gonzalez‐Jimenez, A., Yang, Q., Gu, J., Andrade, R. J., et al. (2022) · Hepatology · doi:10.1002/hep.32327 · Cited by 160
Self-citationConstitutive release of CPS1 in bile and its role as a protective cytokine during acute liver injury
Park, M.-J., D’Alecy, L. G., Anderson, M. A., Basrur, V., Feng, Y., Brady, G. F., Kim, D.-I., Wu, J., Nesvizhskii, A. I., Lahann, J., et al. (2019) · Proceedings of the National Academy of Sciences · doi:10.1073/pnas.1822173116 · Cited by 44
Research works printed but not linked: 52
- Fontana, R. J. et al. Persistent liver biochemistry abnormalities are more common in older patients and those with cholestatic drug induced liver injury. Am. J. Gastroenterol. 110, 1450–1459 (2015). · DOI
- Bjornsson, E. S. Clinical management of patients with drug-induced liver injury (DILI). United European Gastroenterol. J. 9, 781–786 (2021). · DOI
- Hayashi, P. H. et al. Death and liver transplantation within 2 years of onset of drug-induced liver injury. Hepatology 66, 1275–1285 (2017). · DOI · Paper page
- Kullak-Ublick, G. A. et al. Drug-induced liver injury: recent advances in diagnosis and risk assessment. Gut 66, 1154–1164 (2017). · DOI · Paper page
- Onakpoya, I. J., Heneghan, C. J. & Aronson, J. K. Post-marketing withdrawal of 462 medicinal products because of adverse drug reactions: a systematic review of the world literature. BMC Med. 14, 10 (2016). · DOI
- Pettersson, J. et al. Muscular exercise can cause highly pathological liver function tests in healthy men. Br. J. Clin. Pharmacol. 65, 253–259 (2008). · DOI
- Lewis, J. H. ‘Hy’s law,’ the ‘Rezulin Rule,’ and other predictors of severe drug-induced hepatotoxicity: putting risk-benefit into perspective. Pharmacoepidemiol. Drug Saf. 15, 221–229 (2006). · DOI
- Robles-Diaz, M. et al. Use of Hy’s law and a new composite algorithm to predict acute liver failure in patients with drug-induced liver injury. Gastroenterology 147, 109–118 (2014). · DOI · Paper page
- Senior, J. R. Alanine aminotransferase: a clinical and regulatory tool for detecting liver injury-past, present, and future. Clin. Pharmacol. Ther. 92, 332–339 (2012). · DOI
- Matheis, K. et al. A generic operational strategy to qualify translational safety biomarkers. Drug Discov. Today 16, 600–608 (2011). · DOI
- Church, R. J. et al. Candidate biomarkers for the diagnosis and prognosis of drug-induced liver injury: an international collaborative effort. Hepatology 69, 760–773 (2019). · DOI · Paper page
- Uhlen, M. et al. Proteomics. Tissue-based map of the human proteome. Science 347, 1260419 (2015). · DOI · Paper page
- MacParland, S. A. et al. Single cell RNA sequencing of human liver reveals distinct intrahepatic macrophage populations. Nat. Commun. 9, 4383 (2018). · DOI · Paper page
- Atallah, E. et al. Biomarkers of idiosyncratic drug-induced liver injury (DILI) - a systematic review. Expert Opin. Drug Metab. Toxicol. 17, 1327–1343 (2021). · DOI
- Vazquez, J. H. & McGill, M. R. Redrawing the map to novel DILI biomarkers in circulation: where are we, where should we go, and how can we get there? Livers 1, 286–293 (2021). · DOI
- Breu, A. C. et al. A Multicenter study into causes of severe acute liver injury. Clin. Gastroenterol. Hepatol. 17, 1201–1203 (2019). · DOI
- Donaghy, L. et al. Clinical and laboratory features and natural history of seronegative hepatitis in a nontransplant centre. Eur. J. Gastroenterol. Hepatol. 25, 1159–1164 (2013).
- Suzuki, A. et al. Assessment of the frequency, phenotypes, and outcomes of acute liver injury associated with amoxicillin/clavulanate in 1.4 million patients in the veterans health administration. Drug Saf. 46, 129–143 (2022). · DOI
- Wang, B., Hsu, S. H., Frankel, W., Ghoshal, K. & Jacob, S. T. Stat3-mediated activation of microRNA-23a suppresses gluconeogenesis in hepatocellular carcinoma by down-regulating glucose-6-phosphatase and peroxisome proliferator-activated receptor gamma, coactivator 1 alpha. Hepatology 56, 186–197 (2012). · DOI
- Wang, J. et al. Proteomic signature of acute liver failure: from discovery and verification in a pig model to confirmation in humans. Mol. Cell Proteomics 16, 1188–1199 (2017). · DOI
- Paris, J. & Henderson, N. C. Liver zonation, revisited. Hepatology 76, 1219–1230 (2022). · DOI
- Takata, N. et al. LECT2 as a hepatokine links liver steatosis to inflammation via activating tissue macrophages in NASH. Sci. Rep. 11, 555 (2021). · DOI
- Shaw, P. J., Ganey, P. E. & Roth, R. A. Idiosyncratic drug-induced liver injury and the role of inflammatory stress with an emphasis on an animal model of trovafloxacin hepatotoxicity. Toxicol. Sci. 118, 7–18 (2010). · DOI · Paper page
- Sato, Y. et al. Serum LECT2 level as a prognostic indicator in acute liver failure. Transplant Proc. 36, 2359–2361 (2004). · DOI
- Li, R. et al. Glutathione S-transferase A1 (GSTA1) as a marker of acetaminophen-induced hepatocyte injury in vitro. Toxicol. Mech. Methods 27, 401–407 (2017). · DOI
- Liu, F. et al. Glutathione S-transferase A1 (GSTA1) release, an early indicator of acute hepatic injury in mice. Food Chem. Toxicol. 71, 225–230 (2014). · DOI
- McGill, M. R. et al. Argininosuccinate synthetase as a plasma biomarker of liver injury after acetaminophen overdose in rodents and humans. Biomarkers 19, 222–230 (2014). · DOI
- Weerasinghe, S. V., Jang, Y. J., Fontana, R. J. & Omary, M. B. Carbamoyl phosphate synthetase-1 is a rapid turnover biomarker in mouse and human acute liver injury. Am. J. Physiol. Gastrointest. Liver Physiol. 307, G355–G364 (2014). · DOI
- Vazquez, J. H. et al. Identification of serum biomarkers to distinguish hazardous and benign aminotransferase elevations. Toxicol. Sci. 173, 244–254 (2020). · DOI
- Svetlov, S. I. et al. Identification and preliminary validation of novel biomarkers of acute hepatic ischaemia/reperfusion injury using dual-platform proteomic/degradomic approaches. Biomarkers 11, 355–369 (2006). · DOI
- Bailey, W. J. et al. A performance evaluation of three drug-induced liver injury biomarkers in the rat: alpha-glutathione S-transferase, arginase 1, and 4-hydroxyphenyl-pyruvate dioxygenase. Toxicol. Sci. 130, 229–244 (2012). · DOI
- Bell, L. N. et al. Serum proteomic profiling in patients with drug-induced liver injury. Aliment Pharmacol. Ther. 35, 600–612 (2012). · DOI
- Vickers, A. E., Ulyanov, A. V. & Fisher, R. L. Liver effects of clinical drugs differentiated in human liver slices. Int. J. Mol. Sci. 18, 574–606 (2017). · DOI
- Tegeris, A. S., Smalley, H. E. Jr., Earl, F. L. & Curtis, J. M. Ornithine carbamyl transferase as a liver function test comparative studies in the dog, swine, and man. Toxicol. Appl. Pharmacol. 14, 54–66 (1969). · DOI
- Fu, S. et al. Molecular biomarkers in drug-induced liver injury: Challenges and future perspectives. Front. Pharmacol. 10, 1667 (2019). · DOI
- Flanigan, K. M. et al. Pharmacokinetics and safety of single doses of drisapersen in non-ambulant subjects with Duchenne muscular dystrophy: results of a double-blind randomized clinical trial. Neuromuscul. Disord. 24, 16–24 (2014). · DOI
- Maniratanachote, R. et al. Detection of autoantibody to aldolase B in sera from patients with troglitazone-induced liver dysfunction. Toxicology 216, 15–23 (2005). · DOI
- Hu, Z. et al. Quantitative liver-specific protein fingerprint in blood: a signature for hepatotoxicity. Theranostics 4, 215–228 (2014). · DOI
- Murayama, H., Ikemoto, M., Fukuda, Y. & Nagata, A. Superiority of serum type-I arginase and ornithine carbamyltransferase in the detection of toxicant-induced acute hepatic injury in rats. Clin. Chim. Acta 391, 31–35 (2008). · DOI
- Furihata, T. et al. Characterization of release profile of ornithine carbamoyltransferase from primary rat hepatocytes treated with hepatotoxic drugs: Implications for its unique potential as a drug-induced liver injury biomarker. Drug Metab. Pharmacokinet. 31, 102–105 (2016). · DOI
- Danan, G. & Benichou, C. Causality assessment of adverse reactions to drugs–I. A novel method based on the conclusions of international consensus meetings: application to drug-induced liver injuries. J. Clin. Epidemiol. 46, 1323–1330 (1993). · DOI · Paper page
- Soga, T. et al. Serum metabolomics reveals gamma-glutamyl dipeptides as biomarkers for discrimination among different forms of liver disease. J. Hepatol. 55, 896–905 (2011). · DOI
- Huang, Y. et al. Metabolomics profiling and diagnosis biomarkers searching for drug-induced liver injury implicated to polygonum multiflorum: A cross-sectional cohort study. Front. Med. 7, 592434 (2020). · DOI
- Bjornsson, E. S. et al. A new framework for advancing in drug-induced liver injury research. The Prospective European DILI Registry. Liver Int. 43, 115–126 (2023). · DOI · Paper page
- Aithal, G. P. et al. Case definition and phenotype standardization in drug-induced liver injury. Clin. Pharmacol. Ther. 89, 806–815 (2011). · DOI · Paper page
- Eng, J. K., McCormack, A. L. & Yates, J. R. An approach to correlate tandem mass spectral data of peptides with amino acid sequences in a protein database. J. Am. Soc. Mass Spectrom. 5, 976–989 (1994). · DOI · Paper page
- Huttlin, E. L. et al. A tissue-specific atlas of mouse protein phosphorylation and expression. Cell 143, 1174–1189 (2010). · DOI · Paper page
- Elias, J. E. & Gygi, S. P. Target-decoy search strategy for increased confidence in large-scale protein identifications by mass spectrometry. Nat. Methods 4, 207–214 (2007). · DOI · Paper page
- Gallien, S., Kim, S. Y. & Domon, B. Large-scale targeted proteomics using internal standard triggered-parallel reaction monitoring (IS-PRM). Mol. Cell Proteomics 14, 1630–1644 (2015). · DOI
- MacLean, B. et al. Skyline: an open source document editor for creating and analyzing targeted proteomics experiments. Bioinformatics 26, 966–968 (2010). · DOI · Paper page
- Llewellyn, H. P. et al. Evaluating the sensitivity and specificity of promising circulating biomarkers to diagnose liver injury in humans. Toxicol. Sci. 181, 23–34 (2021). · DOI
- Ritchie, M. E. et al. limma powers differential expression analyses for RNA-sequencing and microarray studies. Nucleic Acids Res. 43, e47 (2015). · DOI · Paper page
Cited by
Sorted by citations
Methods for causality assessment of idiosyncratic drug‐induced liver injury
García‐Cortés, M., Matilla‐Cabello, G., & Lucena, M. I. (2025) · Liver International · doi:10.1111/liv.16083 · Cited by 15
Self-citation
Metadata
- Authors
- Ravindra, K. C., Vaidya, V. S., Wang, Z., Federspiel, J. D., Virgen-Slane, R., Everley, R. A., Grove, J. I., Stephens, C., Ocana, M. F., Robles-Díaz, M., Isabel Lucena, M., Andrade, R. J., Atallah, E., Gerbes, A. L., Weber, S., Cortez-Pinto, H., Fowell, A. J., Hussaini, H., Bjornsson, E. S., Patel, J., Stirnimann, G., Verma, S., Elsharkawy, A. M., Griffiths, W. J. H., Hyde, C., Dear, J. W., Aithal, G. P., & Ramaiah, S. K.
- ORCID
- Venue
- Nature Communications
- Published
- 2023-03-03
- Volume
- 14
- Issue
- 1
- ISSN
- 2041-1723
- PMC
- PMC9984368
- Cited by
- 44
- References
- 3
- Language
- en
About these checks
Registry, retraction, Cites and statistics results are computed, not judged, with one exception: a printed reference that no index lists is read once by a model before it counts as a citation error. Claims are extracted by a model and kept only when their quote appears verbatim in the text; each cited source is then checked, with a model’s help, for whether it says what the claim relies on. Those verdicts can be wrong — read the claim’s quote and the cited source before relying on one.
Statistics and arithmetic are recomputed, not judged.
Confidence bands are shown only for fields calibrated on our annotated test set. None is calibrated yet, so no band is shown.
What counts as a claim ›How we measure confidence ›How we check this ›
Are you an author, or do you see a problem with this page? Request a review
