Cited by 11HIV Research and TreatmentT-cell and Retrovirus StudiesEnzyme Structure and Function

The DOI matches its Crossref record; 1 of the 1 references it cites were found in a registry or an index.

The crystal structure of a simian Foamy Virus receptor binding domain provides clues about entry into host cells

Open access
Fernández, Ignacio, Dynesen, Lasse Toftdal, Coquin, Youna, Pederzoli, Riccardo, Brun, Delphine, Haouz, Ahmed, Gessain, Antoine, Rey, Félix A., Buseyne, Florence, Backovic, Marija·2023·Nature Communications

Published version of a preprint

Abstract

The surface envelope glycoprotein (Env) of all retroviruses mediates virus binding to cells and fusion of the viral and cellular membranes. A structure-function relationship for the HIV Env that belongs to the Orthoretrovirus subfamily has been well established. Structural information is however largely missing for the Env of Foamy viruses (FVs), the second retroviral subfamily. In this work we present the X-ray structure of the receptor binding domain (RBD) of a simian FV Env at 2.57 Å resolution, revealing two subdomains and an unprecedented fold. We have generated a model for the organization of the RBDs within the trimeric Env, which indicates that the upper subdomains form a cage-like structure at the apex of the Env, and identified residues K342, R343, R359 and R369 in the lower subdomain as key players for the interaction of the RBD and viral particles with heparan sulfate.

Overview

The claims and statistics of this paper haven’t been checked yet.

Run the check — free, no account needed. It reads the open-access text and checks the sources it cites.

A few free checks a day · papers already verified open instantly · results are public

Integrity signals

Registry

Crossref · 10.1038/s41467-023-36923-0

Cites

1 of 1 references verified0 citation errors · 0 not checkable

Statistics

Figures

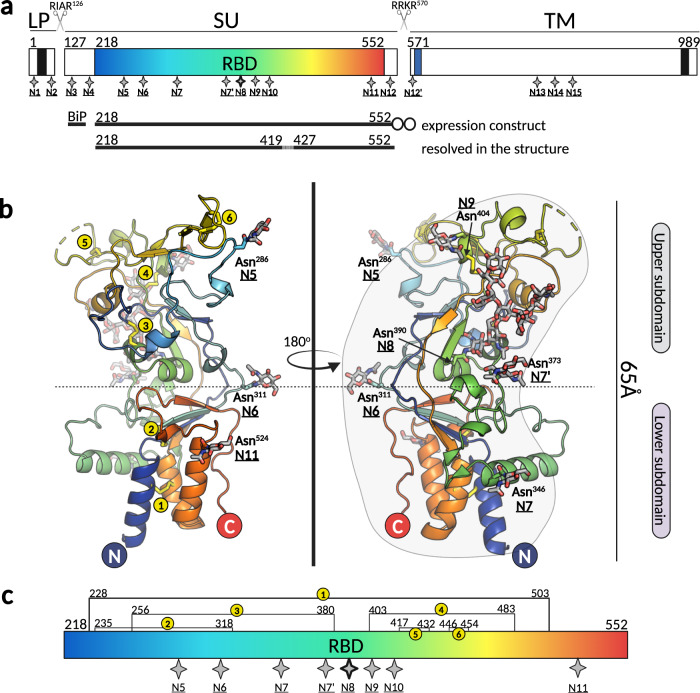
Fig. 1 Overview of the novel fold adopted by the SFV RBD. a Schematic representation of SFV Env protein organization indicating the three constituent chains: leader peptide (LP), surface subunit (SU), and transmembrane subunit (TM). The transmembrane domains anchoring the LP and TM in the membrane are represented as black boxes; the receptor-binding domain (RBD) within SU is highlighted in blue-red spectrum; the fusion peptide at the N-terminus of the TM is shown in blue. The furin sites between the LP and SU (RIAR126), and SU and TM (RRKR570) are indicated with scissors icons. The RBD expression construct contained the exogenous BiP signal at the N-terminus, residues 218 to 552 of the SFV gorilla GII Env and a double strep tag at the C-terminus (shown as two circles). The region comprising residues 420–426 is drawn as a dashed line because it was not seen in the electron density map. The 17 putative N-glycosylation sites for gorilla SFV Env are indicated with star symbols and labeled N1 to N15, following the previously established nomenclature22. b The X-ray structure of the RBDD is shown in ribbon model colored from N- to C-terminus in blue to red spectrum, respectively. The dashed-line indicates the separation between the upper and lower subdomains. The N-glycosylation sites are indicated with N, and the sugars and the asparagine side chains carrying them are displayed as sticks. The figure was created with Pymol65. c Linear representation of the RBD. The 8 N-glycosylation sites with sugars built into the electron density are shown as gray stars, including site N10 (N411) that showed density for an attached carbohydrate in RBDG (molecule B), but not in RBDD. Site N8 (N390), which contains a long, partially buried sugar moiety is highlighted with a thicker outline. The locations of six disulfides are indicated with numbered yellow circles as in panel b. The figure was created in BioRender.com.
Fig. 1 Overview of the novel fold adopted by the SFV RBD. a Schematic representation of SFV Env protein organization indicating the three constituent chains: leader peptide (LP), surface subunit (SU), and transmembrane subunit (TM). The transmembrane domains anchoring the LP and TM in the membrane are represented as black boxes; the receptor-binding domain (RBD) within SU is highlighted in blue-red spectrum; the fusion peptide at the N-terminus of the TM is shown in blue. The furin sites between the LP and SU (RIAR126), and SU and TM (RRKR570) are indicated with scissors icons. The RBD expression construct contained the exogenous BiP signal at the N-terminus, residues 218 to 552 of the SFV gorilla GII Env and a double strep tag at the C-terminus (shown as two circles). The region comprising residues 420–426 is drawn as a dashed line because it was not seen in the electron density map. The 17 putative N-glycosylation sites for gorilla SFV Env are indicated with star symbols and labeled N1 to N15, following the previously established nomenclature22. b The X-ray structure of the RBDD is shown in ribbon model colored from N- to C-terminus in blue to red spectrum, respectively. The dashed-line indicates the separation between the upper and lower subdomains. The N-glycosylation sites are indicated with N, and the sugars and the asparagine side chains carrying them are displayed as sticks. The figure was created with Pymol65. c Linear representation of the RBD. The 8 N-glycosylation sites with sugars built into the electron density are shown as gray stars, including site N10 (N411) that showed density for an attached carbohydrate in RBDG (molecule B), but not in RBDD. Site N8 (N390), which contains a long, partially buried sugar moiety is highlighted with a thicker outline. The locations of six disulfides are indicated with numbered yellow circles as in panel b. The figure was created in BioRender.com.CC BY · PubMed Central
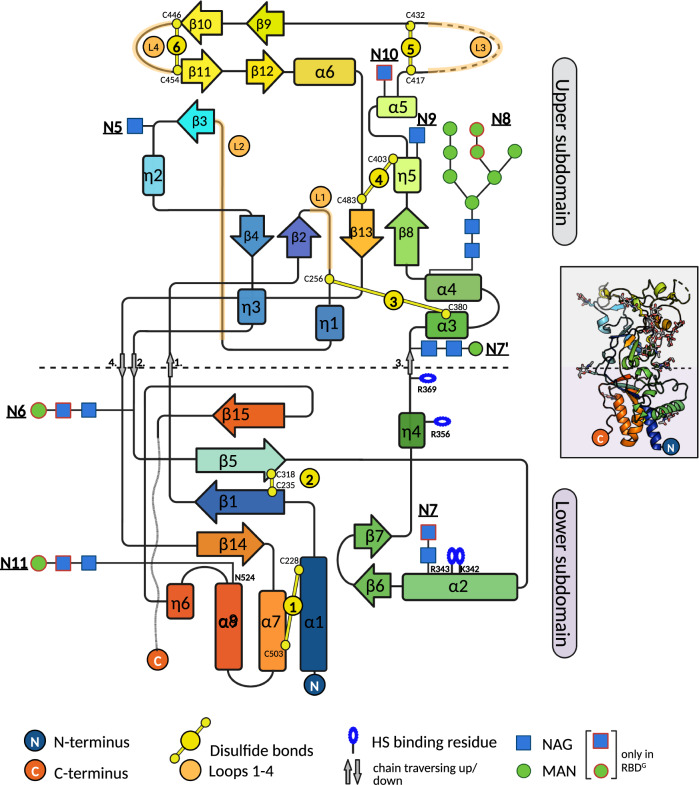
Fig. 2 SFV RBD secondary structure topology diagram. The horizontal dashed-line designates the boundary between the lower and upper subdomains. The NAG and MAN units built only into the RBDG (and not RBDD) structure are indicated with red frames. The figure was created with BioRender.com.
Fig. 2 SFV RBD secondary structure topology diagram. The horizontal dashed-line designates the boundary between the lower and upper subdomains. The NAG and MAN units built only into the RBDG (and not RBDD) structure are indicated with red frames. The figure was created with BioRender.com.CC BY · PubMed Central
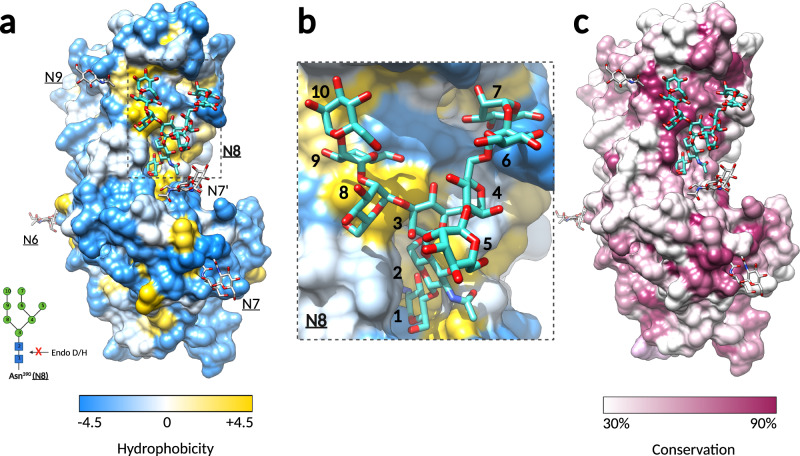
Fig. 3 The oligosaccharide linked to N390 plays a structural role in the RBD. a Molecular surface representation of the SFV RBD colored by residue hydrophobicity. Hydrophobicity for each residue was calculated according to the Kyte and Doolittle scale66 in Chimera29, with the gradient color key indicating the lowest hydrophobicity in blue, to the highest hydrophobicity in yellow. The sugars at sites N6, N7, N7’, and N9 are displayed as white sticks, and the sugar attached to N8 as cyan sticks. The inlet shows the bond cleaved by glycosidases Endo D/H, which is protected in N8. b The N8 sugar attached to N390 covers a hydrophobic region. Magnified region within the dashed-line rectangle in panel a Is shown. The NAG and MAN residues are labeled with numbers that correspond to the N-oligosaccharide drawn in the inlet of panel a. c The hydrophobic patch covered by N8 is well-conserved. The SFV RBD surface is rendered by residue conservation in Chimera29, according to the % of the identical residues in the 11 FV Env sequences (alignment shown in Fig. S6). Residues conserved in less than 30% and more than 90% of sequences are colored in white and purple, respectively, and residues in between with a white-purple gradient, as indicated on the color key below the surface representation.
Fig. 3 The oligosaccharide linked to N390 plays a structural role in the RBD. a Molecular surface representation of the SFV RBD colored by residue hydrophobicity. Hydrophobicity for each residue was calculated according to the Kyte and Doolittle scale66 in Chimera29, with the gradient color key indicating the lowest hydrophobicity in blue, to the highest hydrophobicity in yellow. The sugars at sites N6, N7, N7’, and N9 are displayed as white sticks, and the sugar attached to N8 as cyan sticks. The inlet shows the bond cleaved by glycosidases Endo D/H, which is protected in N8. b The N8 sugar attached to N390 covers a hydrophobic region. Magnified region within the dashed-line rectangle in panel a Is shown. The NAG and MAN residues are labeled with numbers that correspond to the N-oligosaccharide drawn in the inlet of panel a. c The hydrophobic patch covered by N8 is well-conserved. The SFV RBD surface is rendered by residue conservation in Chimera29, according to the % of the identical residues in the 11 FV Env sequences (alignment shown in Fig. S6). Residues conserved in less than 30% and more than 90% of sequences are colored in white and purple, respectively, and residues in between with a white-purple gradient, as indicated on the color key below the surface representation.CC BY · PubMed Central
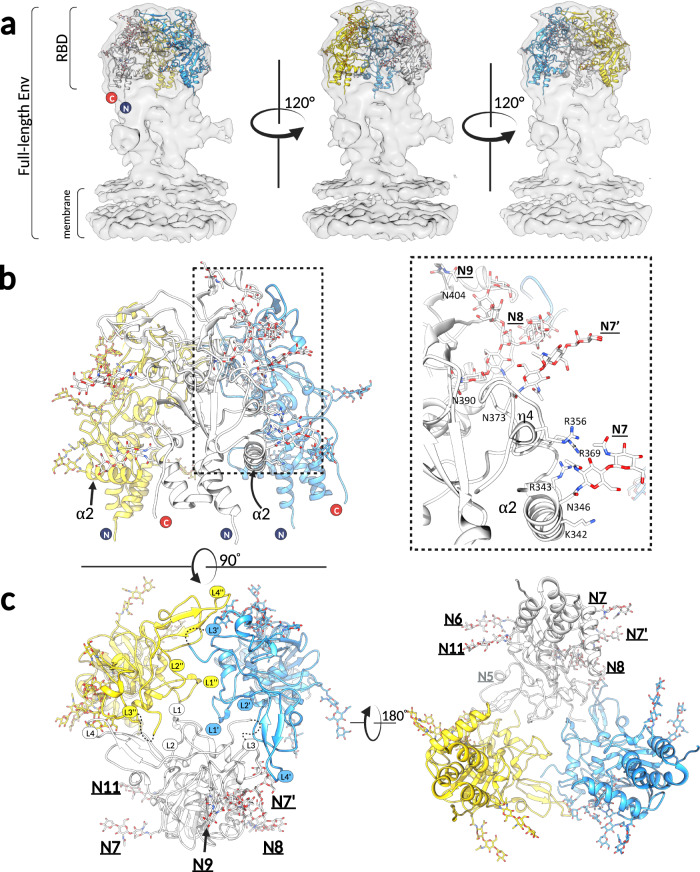
Fig. 4 The RBDs form a trimeric assembly at the apex of the full-length Env. a Three SFV RBDD protomers were fitted in the 9 Å cryo-EM map (EMBD: 4013) obtained by cryo-EM 3D reconstruction of the full-length PFV Env expressed on viral vector particles13. The map is shown in light gray surface, and RBDs in cartoon mode, with each protomer colored differently (yellow, white, light blue). b The three RBDs, fitted as explained in panel a, are shown to illustrate that the α2 and η4 helices, which carry the HS-binding residues (K342, R343, R359, R369), and the N-linked glycosylations (N6, N7, N7’, N8, N9 and N11) point outward and are solvent accessible. The boxed region on the left panel is magnified and displayed on the right panel (only one protomer, colored in white, is represented for clarity purposes). c The views at the trimeric RBD arrangement from the top i.e. looking at the membrane (left) and bottom i.e. looking from the membrane (right) are shown. The RBDs form interprotomer contacts via the L1-L4 in the upper domain. The loops belonging to each protomer are designated as L, L’, and L”. Images were generated in Chimera29.
Fig. 4 The RBDs form a trimeric assembly at the apex of the full-length Env. a Three SFV RBDD protomers were fitted in the 9 Å cryo-EM map (EMBD: 4013) obtained by cryo-EM 3D reconstruction of the full-length PFV Env expressed on viral vector particles13. The map is shown in light gray surface, and RBDs in cartoon mode, with each protomer colored differently (yellow, white, light blue). b The three RBDs, fitted as explained in panel a, are shown to illustrate that the α2 and η4 helices, which carry the HS-binding residues (K342, R343, R359, R369), and the N-linked glycosylations (N6, N7, N7’, N8, N9 and N11) point outward and are solvent accessible. The boxed region on the left panel is magnified and displayed on the right panel (only one protomer, colored in white, is represented for clarity purposes). c The views at the trimeric RBD arrangement from the top i.e. looking at the membrane (left) and bottom i.e. looking from the membrane (right) are shown. The RBDs form interprotomer contacts via the L1-L4 in the upper domain. The loops belonging to each protomer are designated as L, L’, and L”. Images were generated in Chimera29.CC BY · PubMed Central
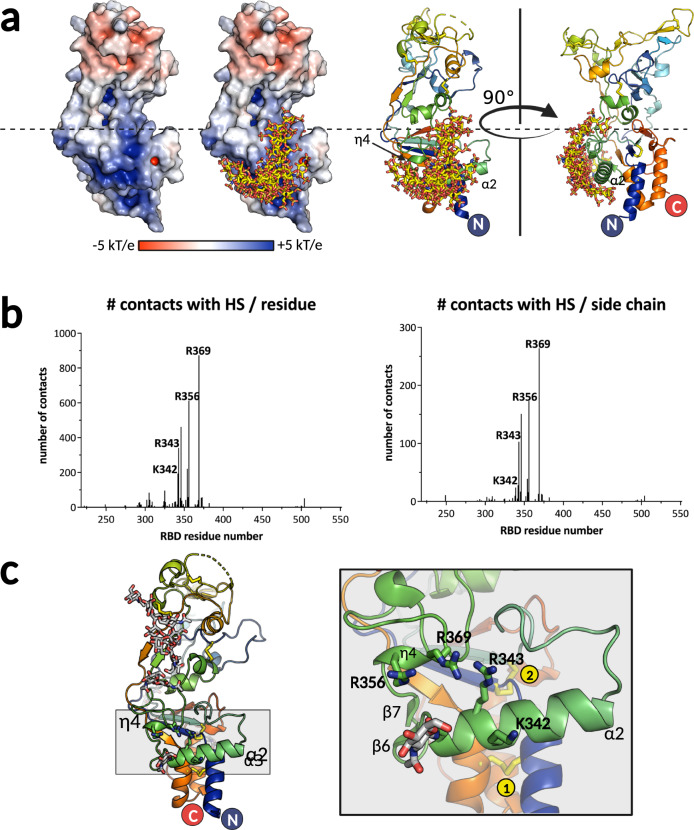
Fig. 5 Prediction of HS-binding residues and design of the variants impaired in binding. a Electrostatic potential distribution was calculated using Adaptive Poisson-Boltzmann Solver module67 in Pymol65 and plotted on the solvent excluded surface of the RBD, with red corresponding to the negative, and blue to positive potentials (two left panels). The ensemble of HS molecules modeled by ClusPro31 map to the lower subdomain and are displayed in sticks on the two right panels. The RBD is shown in cartoon model and in two orientations to illustrate the location of predicted HS-binding secondary structure elements. b Predicted number of contacts per residue and per side chain atoms calculated by ClusPro and plotted for each RBD residue, revealing the most likely candidates to be engaged in HS binding. Source data are provided as a Source Data file. c Structure of RBD is shown in cartoon, with the region containing α2 and η4 helices highlighted in gray. Magnification of the gray boxed region is shown on the right panel, with the relevant secondary structure elements and predicted HS-binding residues shown in sticks. Two disulfide bonds are indicated with yellow circles. The figure was created with Pymol65 and BioRender.com.
Fig. 5 Prediction of HS-binding residues and design of the variants impaired in binding. a Electrostatic potential distribution was calculated using Adaptive Poisson-Boltzmann Solver module67 in Pymol65 and plotted on the solvent excluded surface of the RBD, with red corresponding to the negative, and blue to positive potentials (two left panels). The ensemble of HS molecules modeled by ClusPro31 map to the lower subdomain and are displayed in sticks on the two right panels. The RBD is shown in cartoon model and in two orientations to illustrate the location of predicted HS-binding secondary structure elements. b Predicted number of contacts per residue and per side chain atoms calculated by ClusPro and plotted for each RBD residue, revealing the most likely candidates to be engaged in HS binding. Source data are provided as a Source Data file. c Structure of RBD is shown in cartoon, with the region containing α2 and η4 helices highlighted in gray. Magnification of the gray boxed region is shown on the right panel, with the relevant secondary structure elements and predicted HS-binding residues shown in sticks. Two disulfide bonds are indicated with yellow circles. The figure was created with Pymol65 and BioRender.com.CC BY · PubMed Central
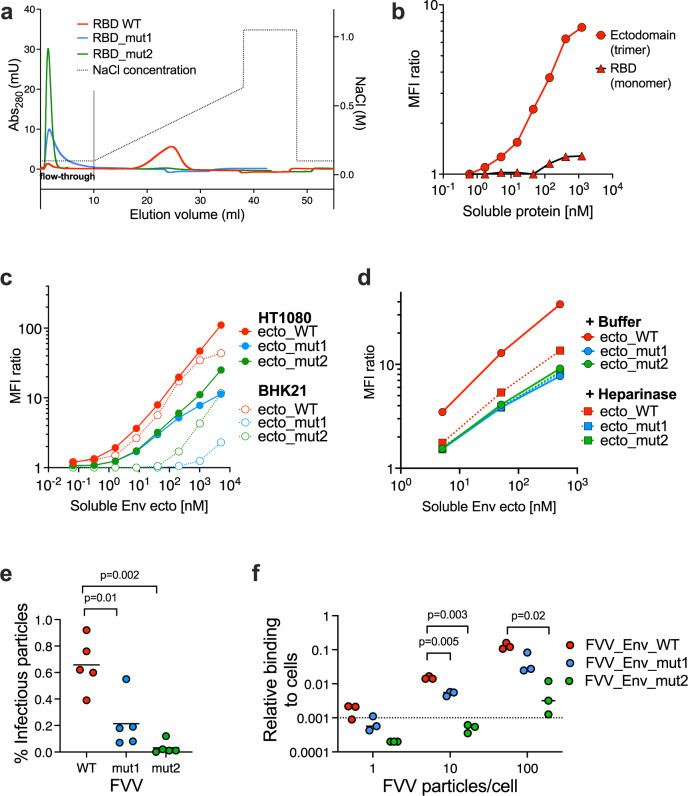
Fig. 6 The SFV RBD residues K342, R343, R356 and R369 mediate Env binding to HS. a Heparin-Sepharose chromatogram of the recombinant SFV RBD, WT (red) and variants with mutations in HS-binding residues, mut1 (K342A/R343A) in blue, and mut2 (R356A/R369A) in green. Dotted line indicates salt concentration, plotted on the right y-axis. Source data are provided as a Source Data file. b Binding of recombinant WT RBD and Env ectodomains to HT1080 cells. SFV RBD and ectodomain binding levels were expressed as the ratio of MFI from protein treated to untreated cells. To be comparable with the RBD, the concentration for the ectodomain is calculated and plotted for the monomeric protein. Gating strategy is presented in (Fig. S13a). Source data are provided as a Source Data file. c Binding of WT, mut1 (K342A/R343A), and mut2 (R356A/R369A) recombinant Env ectodomains to HT1080 and BHK-21 cells. SFV Env binding level to live single cells was expressed as the ratio of MFI from protein treated to untreated cells (Fig. S13b). Mean from two independent experiments are shown. Cell HS expression levels were monitored on the day of each of the two experiments (the HS staining levels were 85.4 and 61.6 for HT1080 cells, 8.40 and 2.68 for BHK-21 cells (Fig. S13c)). Source data are provided as a Source Data file. d Binding of WT, mut1 (K342A/R343A), and mut2 (R356A/R369A) recombinant Env ectodomains to HT1080 cells, treated with heparinase or buffer, was quantified at increasing ectodomain concentrations. Ectodomain binding level to live single cells was expressed as the ratio of MFI from protein treated to untreated cells (Fig. S13b). Mean values from two independent experiments are shown. HS surface expression and removal were quantified by HS and ΔHS-specific antibodies (Fig. S13d). Source data are provided as a Source Data file. e Five batches of FVVs carrying WT (red), mut1 (blue) and mut2 (green) Envs were produced. Each batch is represented with a single dot; the black lines indicate the mean values. The percentage of infectious FVV particles carrying WT, mut1 or mut2 Env was calculated as the ratio between the number of infectious particles (determined by titration on susceptible cells, Fig. S14a) and the amount of vector particles obtained by RT-qPCR (Fig. S14b). The mutant FVVs were compared to the WT FVVs using the two-way paired t-test, with p-values indicated on the graph. Source data are provided as a Source Data file. f Binding of FVVs carrying the WT, mut1 or mut2 Env to HT1080 cells. Three batches of FVVs were incubated with HT1080 cells on ice for 1 h at different number of particles/cell ratios, before washing and quantifying the remaining vector particles by RT-qPCR. The dotted line represents the quantification threshold. The FVVs carrying the mutant and WT Envs were compared using the two-way paired t-test, with p-values indicated on the graph. Source data are provided as a Source Data file.
Fig. 6 The SFV RBD residues K342, R343, R356 and R369 mediate Env binding to HS. a Heparin-Sepharose chromatogram of the recombinant SFV RBD, WT (red) and variants with mutations in HS-binding residues, mut1 (K342A/R343A) in blue, and mut2 (R356A/R369A) in green. Dotted line indicates salt concentration, plotted on the right y-axis. Source data are provided as a Source Data file. b Binding of recombinant WT RBD and Env ectodomains to HT1080 cells. SFV RBD and ectodomain binding levels were expressed as the ratio of MFI from protein treated to untreated cells. To be comparable with the RBD, the concentration for the ectodomain is calculated and plotted for the monomeric protein. Gating strategy is presented in (Fig. S13a). Source data are provided as a Source Data file. c Binding of WT, mut1 (K342A/R343A), and mut2 (R356A/R369A) recombinant Env ectodomains to HT1080 and BHK-21 cells. SFV Env binding level to live single cells was expressed as the ratio of MFI from protein treated to untreated cells (Fig. S13b). Mean from two independent experiments are shown. Cell HS expression levels were monitored on the day of each of the two experiments (the HS staining levels were 85.4 and 61.6 for HT1080 cells, 8.40 and 2.68 for BHK-21 cells (Fig. S13c)). Source data are provided as a Source Data file. d Binding of WT, mut1 (K342A/R343A), and mut2 (R356A/R369A) recombinant Env ectodomains to HT1080 cells, treated with heparinase or buffer, was quantified at increasing ectodomain concentrations. Ectodomain binding level to live single cells was expressed as the ratio of MFI from protein treated to untreated cells (Fig. S13b). Mean values from two independent experiments are shown. HS surface expression and removal were quantified by HS and ΔHS-specific antibodies (Fig. S13d). Source data are provided as a Source Data file. e Five batches of FVVs carrying WT (red), mut1 (blue) and mut2 (green) Envs were produced. Each batch is represented with a single dot; the black lines indicate the mean values. The percentage of infectious FVV particles carrying WT, mut1 or mut2 Env was calculated as the ratio between the number of infectious particles (determined by titration on susceptible cells, Fig. S14a) and the amount of vector particles obtained by RT-qPCR (Fig. S14b). The mutant FVVs were compared to the WT FVVs using the two-way paired t-test, with p-values indicated on the graph. Source data are provided as a Source Data file. f Binding of FVVs carrying the WT, mut1 or mut2 Env to HT1080 cells. Three batches of FVVs were incubated with HT1080 cells on ice for 1 h at different number of particles/cell ratios, before washing and quantifying the remaining vector particles by RT-qPCR. The dotted line represents the quantification threshold. The FVVs carrying the mutant and WT Envs were compared using the two-way paired t-test, with p-values indicated on the graph. Source data are provided as a Source Data file.CC BY · PubMed Central

Verification

Claims the paper makes

The claims and statistics of this paper haven’t been checked yet.

Run the check — free, no account needed. It reads the open-access text and checks the sources it cites.

A few free checks a day · papers already verified open instantly · results are public

Self-check

Percentages, sums and reported differences re-computed from the paper’s own numbers.

The self-check needs the paper’s full text.

Citations

Cites

Research works printed but not linked: 65

  1. Aiewsakun, P. & Katzourakis, A. Marine origin of retroviruses in the early Palaeozoic Era. Nat. Commun. 8, 13954 (2017). · DOI
  2. Rethwilm, A. & Bodem, J. Evolution of foamy viruses: the most ancient of all retroviruses. Viruses 5, 2349–2374 (2013). · DOI
  3. Pinto-Santini, D. M., Stenbak, C. R. & Linial, M. L. Foamy virus zoonotic infections. Retrovirology 14, 55 (2017). · DOI
  4. Buseyne, F. et al. Clinical signs and blood test results among humans infected with zoonotic simian foamy virus: a case-control study. Journal of Infectious Diseases 218, 144–151 (2018).
  5. Ledesma-Feliciano, C. et al. Feline foamy virus infection: characterization of experimental infection and prevalence of natural infection in domestic cats with and without chronic kidney disease. Viruses 11, 662 (2019). · DOI
  6. Meiering, C. D. & Linial, M. L. Historical perspective of foamy virus epidemiology and infection. Clin. Microbiol. Rev. 14, 165–176 (2001). · DOI
  7. Rajawat, Y. S., Humbert, O. & Kiem, H.-P. In-vivo gene therapy with foamy virus vectors. Viruses 11, 1091 (2019). · DOI
  8. White, J. M. & Whittaker, G. R. Fusion of enveloped viruses in endosomes. Traffic 17, 593–614 (2016). · DOI
  9. Harrison, S. C. Viral membrane fusion. Virology 479-480, 498–507 (2015). · DOI
  10. Picard-Maureau, M., Jarmy, G., Berg, A., Rethwilm, A. & Lindemann, D. Foamy virus envelope glycoprotein-mediated entry involves a pH-dependent fusion process. J. Virol. 77, 4722–4730 (2003). · DOI
  11. Dupont, A. et al. Identification of an intermediate step in foamy virus fusion. Viruses 12, 1472 (2020). · DOI
  12. Rey, F. A. & Lok, S. M. Common features of enveloped viruses and implications for immunogen design for next-generation vaccines. Cell 172, 1319–1334 (2018). · DOI
  13. Effantin, G. et al. Cryo-electron microscopy structure of the native prototype foamy virus glycoprotein and virus architecture. PLoS Pathog. 12, e1005721 (2016). · DOI
  14. Wilk, T. et al. The intact retroviral Env glycoprotein of human foamy virus is a trimer. J. Virol. 74, 2885–2887 (2000). · DOI
  15. Pancera, M. et al. Structure and immune recognition of trimeric pre-fusion HIV-1 Env. Nature 514, 455–461 (2014). · DOI
  16. Nasimuzzaman, M. & Persons, D. A. Cell membrane-associated heparan sulfate is a receptor for prototype foamy virus in human, monkey, and rodent cells. Mol. Ther. 20, 1158–1166 (2012). · DOI
  17. Plochmann, K. et al. Heparan sulfate is an attachment factor for foamy virus entry. J. Virol. 86, 10028–10035 (2012). · DOI
  18. Duda, A., Luftenegger, D., Pietschmann, T. & Lindemann, D. Characterization of the prototype foamy virus envelope glycoprotein receptor-binding domain. J. Virol. 80, 8158–8167 (2006). · DOI
  19. Lambert, C. et al. Potent neutralizing antibodies in humans infected with zoonotic simian foamy viruses target conserved epitopes located in the dimorphic domain of the surface envelope protein. PLoS Pathog. 14, e1007293 (2018). · DOI
  20. Lambert, C. et al. An immunodominant and conserved B-cell epitope in the envelope of simian foamy virus recognized by humans infected with zoonotic strains from apes. J. Virol. 93, e00068–19 (2019). · DOI
  21. Luftenegger, D., Picard-Maureau, M., Stanke, N., Rethwilm, A. & Lindemann, D. Analysis and function of prototype foamy virus envelope N glycosylation. J. Virol. 79, 7664–7672 (2005). · DOI
  22. Khan, A. S. et al. Spumaretroviruses: updated taxonomy and nomenclature. Virology 516, 158–164 (2018). · DOI
  23. Holm, L. DALI and the persistence of protein shape. Protein Sci. 29, 128–140 (2020). · DOI
  24. Aiewsakun, P. et al. Modular nature of simian foamy virus genomes and their evolutionary history. Virus Evol. 5, vez032 (2019). · DOI
  25. Richard, L. et al. Cocirculation of two env molecular variants, of possible recombinant origin, in Gorilla and Chimpanzee Simian Foamy virus Strains from Central Africa. J. Virol. 89, 12480–12491 (2015). · DOI
  26. Zhang, Y. & Skolnick, J. Scoring function for automated assessment of protein structure template quality. Proteins 57, 702–710 (2004). · DOI · Paper page
  27. Dong, R., Peng, Z., Zhang, Y. & Yang, J. mTM-align: an algorithm for fast and accurate multiple protein structure alignment. Bioinformatics 34, 1719–1725 (2018). · DOI
  28. Pettersen, E. F. et al. UCSF Chimera−a visualization system for exploratory research and analysis. J. Comput. Chem. 25, 1605–1612 (2004). · DOI
  29. Krissinel, E. & Henrick, K. Inference of macromolecular assemblies from crystalline state. J. Mol. Biol. 372, 774–797 (2007). · DOI
  30. Kozakov, D. et al. The ClusPro web server for protein-protein docking. Nat. Protoc. 12, 255–278 (2017). · DOI
  31. Fass, D., Harrison, S. C. & Kim, P. S. Retrovirus envelope domain at 1.7 angstrom resolution. Nat. Struct. Biol. 3, 465–469 (1996). · DOI
  32. Fass, D. et al. Structure of a murine leukemia virus receptor-binding glycoprotein at 2.0 angstrom resolution. Science 277, 1662–1666 (1997). · DOI
  33. McCarthy, K. R. et al. Structure of the receptor binding domain of EnvP(b)1, an endogenous retroviral envelope protein expressed in human tissues. mBio 11, e02772–20 (2020). · DOI
  34. Kwong, P. D. et al. Structure of an HIV gp120 envelope glycoprotein in complex with the CD4 receptor and a neutralizing human antibody. Nature 393, 648–659 (1998). · DOI
  35. Lindemann, D., Hutter, S., Wei, G. & Lochelt, M. The unique, the known, and the unknown of spumaretrovirus assembly. Viruses 13, 105 (2021). · DOI
  36. Rethwilm, A. The replication strategy of foamy viruses. Curr. Top. Microbiol. Immunol. 277, 1–26 (2003).
  37. Battini, J. L., Heard, J. M. & Danos, O. Receptor choice determinants in the envelope glycoproteins of amphotropic, xenotropic, and polytropic murine leukemia viruses. J. Virol. 66, 1468–1475 (1992). · DOI
  38. Chen, B. Molecular mechanism of HIV-1 entry. Trends Microbiol. 27, 878–891 (2019). · DOI
  39. Wang, H. et al. Cryo-EM structure of a CD4-bound open HIV-1 envelope trimer reveals structural rearrangements of the gp120 V1V2 loop. Proc. Natl Acad. Sci. USA 113, E7151–E7158 (2016). · DOI
  40. Burton, D. R. & Hangartner, L. Broadly neutralizing antibodies to HIV and their role in vaccine design. Annu. Rev. Immunol. 34, 635–659 (2016). · DOI
  41. Dynesen, L. T. et al. Neutralization of zoonotic simian foamy viruses: genotype-specific epitopes within the receptor-binding domain. https://doi.org/10.1101/2022.11.06.515319 (2022). · DOI
  42. Burton, D. R., Poignard, P., Stanfield, R. L. & Wilson, I. A. Broadly neutralizing antibodies present new prospects to counter highly antigenically diverse viruses. Science 337, 183–186 (2012). · DOI
  43. Rua, R., Betsem, E., Calattini, S., Saib, A. & Gessain, A. Genetic characterization of simian foamy viruses infecting humans. J. Virol. 86, 13350–13359 (2012). · DOI
  44. Kelley, L. A., Mezulis, S., Yates, C. M., Wass, M. N. & Sternberg, M. J. The Phyre2 web portal for protein modeling, prediction and analysis. Nat. Protoc. 10, 845–858 (2015). · DOI · Paper page
  45. Krey, T. et al. The disulfide bonds in glycoprotein E2 of hepatitis C virus reveal the tertiary organization of the molecule. PLoS Pathog. 6, e1000762 (2010). · DOI
  46. Backovic, M. & Krey, T. Stable Drosophila cell lines: an alternative approach to exogenous protein expression. Methods Mol. Biol. 1350, 349–358 (2016). · DOI
  47. Weber, P. et al. High-throughput crystallization pipeline at the crystallography core facility of the Institut Pasteur. Molecules 24, 4451 (2019). · DOI
  48. Chavas, L. M. G. et al. PROXIMA-1 beamline for macromolecular crystallography measurements at Synchrotron SOLEIL. J. Synchrotron Radiat. 28, 970–976 (2021). · DOI
  49. Kabsch, W. XDS. Acta Crystallogr. D Biol. Crystallogr. 66, 125–132 (2010). · DOI · Paper page
  50. Evans, P. R. & Murshudov, G. N. How good are my data and what is the resolution? Acta Crystallogr. D Biol. Crystallogr. 69, 1204–1214 (2013). · DOI
  51. Karplus, P. A. & Diederichs, K. Linking crystallographic model and data quality. Science 336, 1030–1033 (2012). · DOI · Paper page
  52. Winn, M. D. et al. Overview of the CCP4 suite and current developments. Acta Crystallogr. D Biol. Crystallogr. 67, 235–242 (2011). · DOI · Paper page
  53. Adams, P. D. et al. PHENIX: a comprehensive Python-based system for macromolecular structure solution. Acta Crystallogr. D Biol. Crystallogr. 66, 213–221 (2010). · DOI · Paper page
  54. Terwilliger, T. C. et al. Decision-making in structure solution using Bayesian estimates of map quality: the PHENIX AutoSol wizard. Acta Crystallogr. D Biol. Crystallogr. 65, 582–601 (2009). · DOI
  55. Cowtan, K. The Buccaneer software for automated model building. 1. Tracing protein chains. Acta Crystallogr. D Biol. Crystallogr. 62, 1002–1011 (2006). · DOI
  56. Blanc, E. et al. Refinement of severely incomplete structures with maximum likelihood in BUSTER-TNT. Acta Crystallogr. D Biol. Crystallogr. 60, 2210–2221 (2004). · DOI
  57. Bricogne, G. et al. BUSTER. 2.8.0 edn (Global Phasing Ltd., Cambridge, 2009).
  58. Emsley, P. & Cowtan, K. Coot: model-building tools for molecular graphics. Acta Crystallogr. D Biol Crystallogr. 60, 2126–2132 (2004). · DOI · Paper page
  59. McCoy, A. J. et al. Phaser crystallographic software. J Appl Crystallogr. 40, 658–674 (2007). · DOI · Paper page
  60. Chen, V. B. et al. MolProbity: all-atom structure validation for macromolecular crystallography. Acta Crystallogr. D Biol. Crystallogr. 66, 12–21 (2010). · DOI · Paper page
  61. Mottarella, S. E. et al. Docking server for the identification of heparin binding sites on proteins. J. Chem. Inf. Model 54, 2068–2078 (2014). · DOI
  62. Vajda, S. et al. New additions to the ClusPro server motivated by CAPRI. Proteins 85, 435–444 (2017). · DOI
  63. Desta, I. T., Porter, K. A., Xia, B., Kozakov, D. & Vajda, S. Performance and its limits in rigid body protein-protein docking. Structure 28, 1071–1081 (2020).e3. · DOI
  64. Kyte, J. & Doolittle, R. F. A simple method for displaying the hydropathic character of a protein. J. Mol. Biol. 157, 105–132 (1982). · DOI
  65. Jurrus, E. et al. Improvements to the APBS biomolecular solvation software suite. Protein Sci. 27, 112–128 (2018). · DOI

Metadata

Authors
Fernández, I., Dynesen, L. T., Coquin, Y., Pederzoli, R., Brun, D., Haouz, A., Gessain, A., Rey, F. A., Buseyne, F., & Backovic, M.
Affiliations
Centre National de la Recherche Scientifique (FR)
Venue
Nature Communications
Published
2023-03-06
Volume
14
Issue
1
Pages
1262-1262
ISSN
2041-1723 (ISSN-L)
OpenAlex
W4323310853
Cited by
11
References
1
Citations by year
2026: 4 · 2025: 2 · 2024: 3 · 2023: 2
FWCI
1.44
Type
journal article
Language
en
Open access
Locations
  • Nature Communications (publishedVersion, cc-by)
  • bioRxiv (Cold Spring Harbor Laboratory) (acceptedVersion)
  • Research Square (acceptedVersion, cc-by)
  • PubMed Central (publishedVersion, cc-by)
  • PubMed (publishedVersion)
  • HAL (submittedVersion, cc-by)
  • Archivio Istituzionale della Ricerca (Universita Degli Studi Di Milano) (submittedVersion, other-oa)
  • RePEc: Research Papers in Economics (submittedVersion)
  • DOAJ (DOAJ: Directory of Open Access Journals) (submittedVersion, cc-by-sa)
Funders
Agence Nationale de la Recherche (ANR‐10‐LABX‐62‐IBEID, ANR-10, ANR-10-LABX-0062)
Topics
  • Life Sciences › Immunology and Microbiology › Virology › HIV Research and Treatment
  • Life Sciences › Immunology and Microbiology › Immunology › T-cell and Retrovirus Studies
  • Life Sciences › Biochemistry, Genetics and Molecular Biology › Structural Biology › Enzyme Structure and Function
Keywords
simian foamy virus, receptor binding domain, envelope glycoprotein, viral entry, host cell receptors, heparan sulfate, cage-like structure, X-ray crystal structure
MeSH terms
Cell Membrane, Membrane Glycoproteins, Retroviridae, Spumavirus, Simian foamy virus

About these checks

Registry, retraction, Cites and statistics results are computed, not judged, with one exception: a printed reference that no index lists is read once by a model before it counts as a citation error. Claims are extracted by a model and kept only when their quote appears verbatim in the text; each cited source is then checked, with a model’s help, for whether it says what the claim relies on. Those verdicts can be wrong — read the claim’s quote and the cited source before relying on one.

Statistics and arithmetic are recomputed, not judged.

Confidence bands are shown only for fields calibrated on our annotated test set. None is calibrated yet, so no band is shown.

What counts as a claim ›How we measure confidence ›How we check this ›

Are you an author, or do you see a problem with this page? Request a review